GOLD: Short Trade with Entry/SL/TP
GOLD
- Classic bearish formation
- Our team expects pullback
SUGGESTED TRADE:
Swing Trade
Short GOLD
Entry - 4218.4
Sl - 4224.0
Tp - 4207.6
Our Risk - 1%
Start protection of your profits from lower levels
Disclosure: I am part of Trade Nation's Influencer program and receive a monthly fee for using their TradingView charts in my analysis.
❤️ Please, support our work with like & comment! ❤️
Trade ideas

GOLD: Strong Breakout Opens the Door for Higher TargetsGOLD: Strong Breakout Opens the Door for Higher Targets
Gold remains firmly bullish after breaking above the key resistance zone and flipping it into support around the 4,255 area.
This level has already been respected, confirming strong buyer interest and continuation momentum.
The impulsive move higher shows that bulls are in control, and as long as price holds above the newly formed support, further upside remains likely.
Short-term pullbacks could offer continuation opportunities, while the overall structure favors higher prices.
Key Levels to Watch:
🎯 4,320
🎯 4,350
🎯 4,380
You may find more details in the chart!
Thank you and Good Luck!
PS: Please support with a like or comment if you find this analysis useful for your trading day

Major Supply Zone Test - Anticipating Retracement to $4,200 OBCurrent Price Action: Gold is currently trading around $4,299.91.
Previous Bias: Strong Bullish Continuation (from the lower Order Block).
Current Market Read (Short-Term Reversal Setup)
Major Supply Zone Encountered: The key event is the price moving sharply into the Upper Order Block (OB) and FVG (Fair Value Gap) supply zone. This area (roughly $4,280 - $4,320) represents the major resistance from which a correction is anticipated. The price has now tagged this zone.
Bullish Exhaustion: The strong upward rally from the lower Trend Line and OB has completed its objective and has now run into a ceiling. The strong resistance at this level is likely to cause profit-taking and a temporary momentum reversal.
Projected Retracement: The most logical immediate move is the red arrow: a sharp retracement back down to the Lower Order Block. This area (around $4,180 - $4,200) is the recent structural demand zone that provided the launchpad for the rally. Price often seeks to re-test the origin of a major impulse.
Conditional Short: This setup provides a high-probability short-term SHORT trade, aiming to ride the correction back to the previous demand zone.
Invalidation
The short-term bearish retracement is invalidated if Gold closes a 4H candle decisively above $4,340, signaling a continuation directly to the next high (e.g., towards $4,381, the all-time high).
Disclaimer: This analysis is based on technical patterns (SMC) and is for educational and informational purposes only. Trading involves substantial risk.

The perfect time to buy gold!Gold remains inside a tight accumulation range beneath the premium supply zone at 4256–4268. Price continues respecting trendline support, and every sweep into 4168–4185 demand has been met with strong re-accumulation.
As long as demand holds, the market is likely preparing to deliver toward unmitigated liquidity above.
Bullish Continuation Plan
Maintain structure above 4180–4185 → bullish bias remains valid.
If price reclaims 4214–4222, expansion becomes likely:
Target 1: 4238
Target 2: 4256
Target 3: 4268 liquidity objective
Bearish Breakdown Plan (Only if Demand Fails)
Break & acceptance below 4170 = bullish structure invalid.
First target: 4135
Extended target: 4050–4080 HTF demand
Bias: Neutral inside the range. Bullish above 4214. Bearish under 4170.
No trades in the middle — only traps.

Gold buy idea Gold has been rising since yesterday’s employment report and is now approaching all-time-high levels. There is a high probability that price will push toward 4393 to fill the remaining range before making a new ATH.
Key Levels
1. 4330 psychological level-micro demand
2. 4320 main demand-second psychological level
How to Trade It
Look for a bullish engulfing candle with increasing volume at 4330
or
* Wait for price to test 4320–4330, then look for the same confirmations:
* Bullish engulfing
* Pin bar rejection
* Strong or increasing volume
If price breaks below both psychological levels (4330 & 4320)with momentum, do not take the trade
Instead, wait for price to **close back above either psychological level** and apply the same entry confirmations.

THE KOG REPORT - UpdateEnd of day update from us here at KOG:
Not a bad week at all with price bouncing the low to give us the long into the region of interest where we wanted to short. We got the short into the defence box which is where we faced a bit of ranging and accumulation but the level held well and we're on our way.
Now, we have support 4240 as the key level for the close while 4265-70 is the level to watch for the break. Defence above, we'll be happy to achieve that for the week.
Wishing you all a great weekend and we'll see you on Sunday for the KOG Report and our view for the week ahead. Please take some time to hit the boost button on our ideas.
As always, trade safe.
KOG

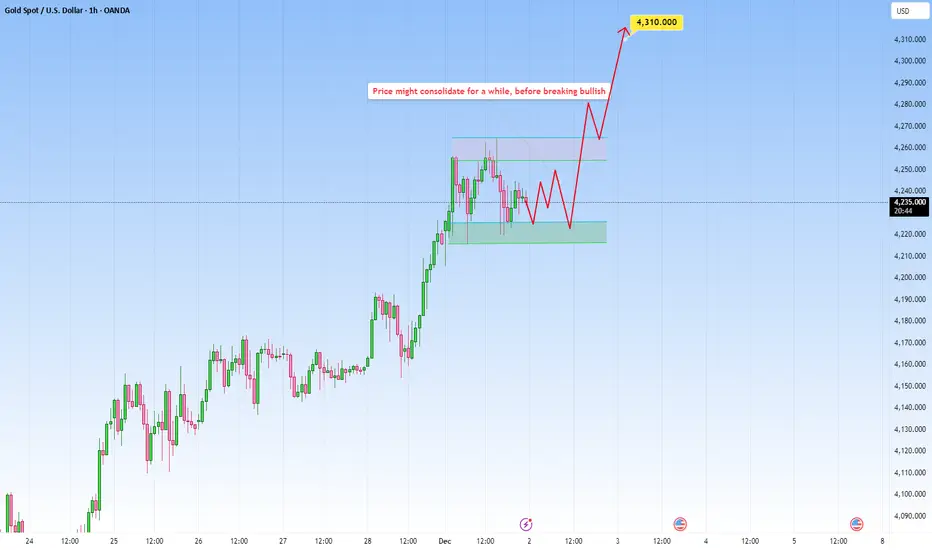
XAUUSD: Waiting for directionPrice recently pushed to the upside, but now the market is slowing down, moving sideways.
This is classic reaction after an impulsive move. Buyers are still in control overall, but taking a breather.
A clean break above the upper range would confirm that buyers are ready to continue the trend and push for new highs.
That’s the scenario I’m watching, a bit of back-and-forth, then a breakout to the upside once the market is done consolidating.
Gold traded within a rangeIn the short term, gold remains range-bound. It's not advisable to chase higher prices before a valid breakout. The recommended strategy is to buy on dips. Consider entering long positions near 4195. If the price breaks through the 4230 resistance level, add to long positions, targeting the 4245-4255 area. This area represents a resistance zone formed by connecting the previous downtrend highs; a break above this level would signal the start of a daily-level rebound in gold.
In the short term, the market will likely continue to trade within a range; the strategy should be to buy on dips.

Gold trading plan!- Change of Characteristics
- Symmetrical Triangle as an corrective pattern in Short Time Frame
- Consolidation Phase
- Order Block
- Fair Value Gap

XAUUSD one more down wave might be comingwe will be talking about 5k next year but today and near future i think correction may continue, for now i am waiting on the sides and look for a short when another big correction wave starts, possible targets 4126-4080-3860 theese targets are for only to start next impulsive wave, market always goes around in same cycle, Impulse-Correction-Impulse-Correction and i intend to be there when next impulse starts, so catious sell when it goes high until next impulse.

Gold weekly chart with Buy and sell areas last week we smashed it with both the weekly chart and the 1 off chart lets hope we are going to do the same this week
### 1H XAUUSD In-Depth Chart Analysis
#### Market Structure Overview
- **Overall Trend**: Short-term bearish correction within a larger bullish impulse (higher highs/lows on 4H/Daily). Price in descending channel post-recent high (~4280), testing multi-timeframe supports.
- **Key Levels**:
| Type | Level | Significance |
|------|--------|--------------|
| Support | 4213 | 200 EMA + 61.8% Fib retrace (from 4280-4100 swing) + prior 1H swing low. |
| Resistance | 4236-4250 | 50 EMA cluster + channel midline + 38.2% Fib retrace. |
| Support (Deeper) | 4192 | Channel lower bound + 100 EMA + prior session low. |
- **Volume Profile**: Declining volume on downside suggests exhaustion; spikes on bounces indicate accumulation.
- **Volatility**: ATR(14) ~25 pips; Bollinger Bands contracting, signaling potential expansion.
#### Buy Entry @ 4213 (Green Lines) - Bullish Reversal Setup
- **Primary Confluence**:
- **EMA Alignment**: Triple-touch on 200 EMA (dynamic support, slope +0.15%/hr). Price held above rising 100/200 EMA "golden cross" zone.
- **Fibonacci**: Exact 61.8% retracement of rally from 4100 low to 4280 high ($x = 4213$). Aligns with 50% of broader uptrend from 4000.
- **Candlestick & Momentum**:
- Bullish engulfing + hammer doji sequence (3-candle reversal).
- RSI(14): Oversold divergence (dipped to 25, diverged vs. price lows → climbed to 50). Stochastic(14,3,3) crossover from <20.
- **Other Confirmations**:
- MACD: Histogram flip positive + signal line cross above zero.
- Volume: 1.5x average on green candles, confirming buyer conviction.
- Structure: Higher low (HL) formation breaking minor downtrendline from 4260.
- **Invalidation**: SL below 4205 (recent wick low, R:R 1:2+).
#### Sell Entry @ 4192 (Red Lines) - Bearish Breakdown Setup
- **Primary Confluence**:
- **Channel Break**: Close below ascending channel (drawn from 4100-4213 lows) + prior 1H low cluster.
- **EMA Rejection**: 100 EMA acting as failed support (price pierced and rejected).
- **Fibonacci**: 38.2% extension of recent bounce (4213-4265) projecting to 4192; aligns with 161.8% of minor pullback.
- **Candlestick & Momentum**:
- Bearish pinbar + engulfing on high volume (rejection wick > body).
- RSI(14): Bearish divergence at 60 (price higher high, RSI lower) → momentum fade.
- MACD: Bearish crossover (fast line below signal) + expanding negative histogram.
- **Other Confirmations**:
- Stochastic: Overbought rejection (>80) with failure to hold.
- Ichimoku: Price below cloud base (Tenkan cross Kijun bearish).
- Structure: Lower low (LL) confirming breakdown; volume spike 2x avg on red candles.
- **Invalidation**: SL above 4200 (channel retest, R:R 1:2+).
#### Suggested Take Profits & Risk Management
| Trade | Entry | SL | TP1 (1:2 R:R) | TP2 (1:3 R:R) | TP3 (Swing) |
|-------|--------|----|---------------|---------------|-------------|
| **Buy** | 4213 | 4205 (-8 pts) | 4240 (+27 pts) | 4265 (+52 pts) | 4280 (prior high) |
| **Sell** | 4192 | 4200 (+8 pts) | 4175 (-17 pts) | 4155 (-37 pts) | 4140 (200 SMA daily) |
- **Position Sizing**: Risk 0.5-1% per trade (e.g., 1 lot = ~$8 risk on 8-pip SL).
- **Trailing**: Move to BE after TP1; trail using 20 EMA.
#### Multi-Timeframe Confluence & Bias
- **Higher TF (4H)**: Bullish above 4213 (200 EMA hold); aligns with daily uptrend from 4000.
- **Lower TF (15M)**: Micro bounces at 4213 suggest continuation if holds.
- **Overall Bias**: **Mildly Bullish** – Favor buys on 4213 retest if RSI >45 & volume holds. Bearish only on 4192 close (targets 4140). Watch USDX for macro (inverse correlation). Avoid trades during low-volume Asia session.
- **Probability Edge**: Buy ~65% (stronger support confluence); monitor for news (FOMC, NFP).
**Trade Only with Confirmation Candle Close. Backtest R:R >1:2 for 60%+ Win Rate.**

Brainiak | Gold impulsive move beginsAfter waiting for what felt like forever, the price finally started moving up. I entered a long at 4171 and already moved my SL to breakeven, so there’s no way this trade can lose now. Price is about to hit my TP#1 at 4129, where I’ll close around 50%, and let the rest run with breakeven protection.
The market has already completed its check of the previous downside move, exactly as planned. This plays out perfectly with the outlook we had from December 6.
Right now, I’m just waiting for the price to continue upward. If you want to trade along the way, I’d suggest waiting for a pullback .. don’t chase this move. Any entry here would be weak. If it does pull back, I’m watching around 4183 for a potential setup. But since price already tapped the higher-timeframe zone, there’s a chance it won’t give another clean pullback.
So for now, we wait.
Thanks for the support on these analyses, everyone.

GOLD XAUUSD GOLD XAUUSD ,the week candle finally updated the supply roof at 4349-4352 zone on the roof of the bullish channel running since October . After the break of the neckline of the double top from daily line chart perspective. we found a trade direction and setting a strong buy impetus . With the broken supply roof now as support and demand floor ,today candle on 4hr FOUND SUPPORT at 4264-4255 zone again on the daily line chart broken neckline . Newyork gold buyers rejected the current price by selling to retest a broken resistance and a neckline to daily double top as a new demand floor .technically this floor become s my litmus test for holding buy position or look for sell.
technical supply roof will be a retest of the current all time high at 4378-4380.
technical resistance next to watch on the ascending trendline line is 4444-4500 zone .
technical break and close of 4hr /daily candle below 4255-450 will be considered a sell case scenario with next demand floor on the ascending trendline at estimated to be around 4100-4160 zone ..
United states fundamental outlook.
US10Y=4.190%
DXY=98.411
INTEREST RATE =3.75%
HEAD OF FEDS .Sir Jerome Powell
GOODLUCK
#GOLD #XAUUSD #DOLLAR #US10Y

Gold Advances as Rate Cut Probability IncreasesGold has been consolidating as if it is waiting for direction from FOMC. As the Fed will release decision on within 16 hours as of the time of the writing.
If cut rates proceed as expected, we can see XAU challenge the prices near all-time high. And possibly create new ATH before the year ends. My Safe targets are the Fibonacci ratios.
CME Fed watch tool is used here for the positive sentiment of the Gold market. Increasing probability of rate cuts will always make the sentiment bullish.

XAUUSD Intraday AnalysisXAUUSD Intraday Analysis – Trend Exhaustion at Key Resistance, Pullback Scenario in Focus
Price has respected a clean ascending trendline, forming higher highs and higher lows. The most recent impulse leg pushed aggressively into the 4,330 – 4,335 area, which aligns with previous supply and psychological resistance. Momentum has weakened right at this zone, suggesting buyers are losing control.
EMA Structure (Trend Confirmation)
The EMA cluster (short-term to mid-term) remains bullishly aligned, with price extended far above the EMA band. This overextension often precedes a corrective pullback rather than trend continuation.
Key dynamic supports from EMA structure:
EMA zone: 4,270 – 4,258
Deeper EMA / mean support: 4,236
Long-term equilibrium (EMA 89 / 200 area): 4,214
Fibonacci Perspective
Measuring the latest bullish leg, the current resistance aligns closely with the Fibonacci extension zone, while potential pullback targets coincide with:
38.2% retracement: ~4,270
50% retracement: ~4,255 – 4,258
61.8% retracement: ~4,236
This strengthens the probability of a technical correction rather than immediate breakout.
RSI & Momentum Behavior
Although not explicitly shown, price behavior indicates momentum divergence characteristics:
Strong bullish candles followed by smaller-bodied candles at the top
Upper wick rejection near resistance
This is typical of profit-taking phases after impulsive rallies.
Key Levels to Watch
Resistance
4,333 – 4,340 (major intraday resistance)
Support
4,270 – 4,266 (first pullback zone)
4,258 (EMA cluster support)
4,236 (key structure & Fibonacci support)
4,214 (trend invalidation zone if broken)
Trading Scenarios
Scenario 1: Pullback Sell (Preferred Intraday Setup)
If price fails to hold above 4,330 and shows bearish confirmation on lower timeframes, short-term sell opportunities may target:
TP1: 4,270
TP2: 4,258
TP3: 4,236
Scenario 2: Buy the Dip (Trend Continuation)
Bullish continuation is only favored after a healthy retracement into EMA/Fibonacci support zones with clear bullish reaction.
Scenario 3: Breakout Continuation (Lower Probability)
A clean H1 close above 4,340 with strong volume could invalidate the pullback scenario and open continuation toward higher extensions.
Conclusion
XAUUSD remains bullish in structure, but current price is at a high-risk zone for buyers. Patience is key. The market is more likely to correct before deciding the next major direction.

1212 XAUUSD Trading Plan on FridayHello traders,
XAUUSD Trading Plan – December 12
(Based on 5/13 EMA, Fib Levels & 4-hour Chart)
1. Market Context
Gold remains in a strong bullish trend:
5/13 EMA is in a bullish alignment (short-term EMA above long-term EMA);
Price has broken through the "Breakthrough Level (4236.51)", with bullish momentum continuing;
RSI (14) is near 70 (slightly overbought), so a minor pullback may occur before further upside (avoid chasing highs blindly).
2. Core Strategy: Buy on Pullback (Priority Execution)
Entry Conditions
Price retraces to the 4225-4230 zone (meets both: ① 0.886 Fib support; ② 13 EMA support area), confirmed by a bullish 4-hour candle close.
Stop Loss
Below 4200 (breaks 13 EMA + 0.618 Fib level; risk exposure ~25-30 pips).
Take Profit
1. First target: 4285 (current swing high; profit potential ~55-60 pips);
2. Second target: 4329.74 (1.27 Fib extension; profit potential ~99-104 pips).
3. Secondary Strategy: Buy on Breakout
Entry Conditions
Price firmly holds above 4285 (3 consecutive 4-hour candles close above this level, with increased volume).
Stop Loss
Below 4265 (5 EMA support; risk exposure ~20 pips).
Take Profit
4329.74 (1.27 Fib extension; profit potential ~44-45 pips).
4. Risk Management
1. Limit position size to ≤2% of total capital per trade;
2. Exit immediately if price breaks below 4200 (avoid counter-trend trades);
3. Monitor Fed comments/geopolitical news and adjust stops accordingly.
Good Luck !
LESS IS MORE!

Could we see a bounce from here?Gold (XAU/USD) is falling towards the pivot and could bounce to he 1st resistance which acts as a multi swing high resistance.
Pivot: 4,200.44
1st Support: 4,167.93
1st Resistance: 4241.96
Disclaimer:
The opinions given above constitute general market commentary and do not constitute the opinion or advice of IC Markets or any form of personal or investment advice.
Any opinions, news, research, analyses, prices, other information, or links to third-party sites contained on this website are provided on an "as-is" basis, are intended to be informative only, and are not advice, a recommendation, research, a record of our trading prices, an offer of, or solicitation for, a transaction in any financial instrument and thus should not be treated as such. The information provided does not involve any specific investment objectives, financial situation, or needs of any specific person who may receive it. Please be aware that past performance is not a reliable indicator of future performance and/or results. Past performance or forward-looking scenarios based upon the reasonable beliefs of the third-party provider are not a guarantee of future performance. Actual results may differ materially from those anticipated in forward-looking or past performance statements. IC Markets makes no representation or warranty and assumes no liability as to the accuracy or completeness of the information provided, nor any loss arising from any investment based on a recommendation, forecast, or any information supplied by any third party

XAU/USD Elliott Wave Analysis: Potential Bearish Reversal OANDA:XAUUSD PEPPERSTONE:XAUUSD ICMARKETS:XAUUSD
The chart suggests that Gold Spot/U.S. Dollar (XAU/USD) has completed a major correction pattern and is now on the verge of a significant downward move.
Major Correction (A) ➡️ (B):
The price action from the major peak appears to be forming a complex correction, with the current phase completing the major (B) wave.
The sharp drop to the low around November 1st is labeled as a major (A) wave.
The subsequent rally is labeled as the major (B) wave, which is currently subdividing.
Subdivision of Wave (B): The corrective rally (B) is showing signs of completion as a smaller ABC pattern:
o Wave A (of B): A strong 5-wave impulse (labeled 1-2-3-4-5) completed in mid-November.
o Wave B (of B): A correction followed this high.
o Wave C (of B): The current rally is the final leg, Wave C (of B), aiming for the final target.
• Critical Reversal Target for (B) Wave: The chart anticipates the completion of the final Wave C (of B) at a specific price point, coinciding with a key Fibonacci level and trendline resistance:
61.80% Fibonacci Retracement at $4,313.88
This $4,313 zone is the high-probability reversal point before the major downside move begins.
📈 Technical Levels and Trendlines
Major Resistance (The Reversal Zone):
Upper Red Trendline: This descending trendline connects the initial peak with the top of the internal Wave (B), serving as strong dynamic resistance.
Key Price Target: The $4,313.88 level is the projected apex of the rally.
Understood. Here is the full analysis and titles for your post, presented in English, as requested.
📉 XAU/USD Elliott Wave Analysis: Potential Bearish Reversal from $4,313
🌊 Wave Count Interpretation (Elliott Wave)
The chart suggests that Gold Spot/U.S. Dollar (XAU/USD) has completed a major correction pattern and is now on the verge of a significant downward move.
Major Correction (A) ➡️ (B): The price action from the major peak appears to be forming a complex correction, with the current phase completing the major (B) wave.
The sharp drop to the low around November 1st is labeled as a major (A) wave.
The subsequent rally is labeled as the major (B) wave, which is currently subdividing.
Subdivision of Wave (B): The corrective rally (B) is showing signs of completion as a smaller ABC pattern:
Wave A (of B): A strong 5-wave impulse (labeled 1-2-3-4-5) completed in mid-November.
Wave B (of B): A correction followed this high.
Wave C (of B): The current rally is the final leg, Wave C (of B), aiming for the final target.
Critical Reversal Target for (B) Wave: The chart anticipates the completion of the final Wave C (of B) at a specific price point, coinciding with a key Fibonacci level and trendline resistance:
61.80% Fibonacci Retracement at $4,313.88
This $4,313 zone is the high-probability reversal point before the major downside move begins.
📈 Technical Levels and Trendlines
Major Resistance (The Reversal Zone):
Upper Red Trendline: This descending trendline connects the initial peak with the top of the internal Wave (B), serving as strong dynamic resistance.
Key Price Target: The $4,313.88 level is the projected apex of the rally.
Major Support (The Target Zone):
Lower Green Trendline: This ascending trendline connects the key lows and represents the potential final target for the upcoming decline.
Target Price Zone: The final target for the major (C) wave is indicated near the $3,826.25 level.
🎯 Trading Strategy Implication
Imminent Move: The price is completing the final internal wave towards the $4,313.88 reversal zone.
Short Entry: The ideal short-entry zone is near the $4,313.88 level, with a tight stop-loss placed just above the upper red trendline to manage risk.
Profit Target: The anticipated sharp decline, labeled as the massive (C) wave, targets the lower green trendline around $3,826.25, offering a substantial risk/reward opportunity.
Disclaimer:
This analysis is for educational purposes only and is based on Elliott Wave Theory and technical indicators. It is not financial advice. Trading foreign exchange, cryptocurrencies, and commodity futures involves significant risk of loss and is not suitable for all investors. Past performance is not indicative of future results.
Always do your own research

Can Gold Sustain Momentum Above 4250 for the Next Leg Up?🔥 XAU/USD BREAKOUT ALERT! 🚀
Gold vs. U.S. Dollar – Metals Market Opportunity (Day/Swing Trade)
Blueprint for the bullish breakout setup with pending order strategy!
🟡 Asset:
XAU/USD – “GOLD vs U.S. DOLLAR”
Metals Market Opportunity Blueprint (Day / Swing Trade)
🔶 TRADE PLAN – Bullish Breakout Pending Order ✨
Gold is building momentum and preparing for a key breakout structure.
The bullish continuation plan remains valid only after price breaks and holds above 4250, confirming fresh demand flow.
📌 Entry:
You can enter at any price level after the confirmed breakout @ 4250,
or use stack-layering entries based on your preferred “Thief layering technique”.
🔻 STOP LOSS (Risk Advisory Inside)
SL Zone: Around 4170 (Thief SL)
📝 Note:
Dear Ladies & Gentlemen (Thief OG’s) — adjust your SL according to your own strategy and risk comfort.
This is not a mandatory level; you can protect your capital in your own style.
🎯 TARGET – Resistances, Police Barricade Zone & Profit Escape Route
Market structure shows a strong resistance cluster + potential trap area ahead.
📌 Primary Target: 4340
This zone aligns with:
Strong police barricade resistance
Overbought pressure zones
Liquidity trap pockets where price may reverse
📝 Note:
Dear Ladies & Gentlemen (Thief OG’s), you are NOT required to use my TP.
Make your money and take it at your own pace and your own risk.
🌍 RELATED PAIRS TO WATCH (Correlated & Inversely Correlated Markets)
Monitoring correlated markets helps confirm breakout strength, money flow, and sentiment.
🟦 1. TVC:DXY (U.S. Dollar Index)
Inverse correlation with XAU/USD.
If DXY weakens, GOLD often surges faster.
If DXY strengthens, GOLD upside may slow down.
🟩 2. SP:SPX / PEPPERSTONE:NAS100 (US Indices)
Risk sentiment gauge.
If indices drop → flight-to-safety boosts GOLD.
If indices rally strongly → GOLD may stall or pull back.
🟪 3. TVC:SILVER / XAGUSD
Commodity correlation.
Silver breakout usually supports GOLD momentum confirmation.
Watch for synchronized metal market buying.
🟥 4. TVC:US10Y (10-Year Treasury Yield)
Bond yields affect GOLD heavily.
Falling yields → lower opportunity cost → GOLD bullish.
Rising yields → limited GOLD upside.
🟧 5. TOCOM:DBAIE / OIL
Macro inflation correlation.
Rising oil = inflation risk = GOLD safe-haven bids.
Sharp oil drops = deflation fear = GOLD might contract.
🧭 KEY POINT SUMMARY
Breakout confirmation only after 4250
SL flexibility encouraged based on trader strategy
Take-profit zone at 4340 aligns with trap & resistance
Cross-asset correlation strengthens directional conviction

GOLD & FED DAY — Key Market SetupHello everyone,
Today is an important day for the markets as we have the Federal Reserve news coming up.
Based on the chart, we expect an initial bullish move, followed by a price correction.

Gold Trade Plan 08/12/2025Dear Traders,
Price is experiencing strong compression inside a triangle, and since it is approaching the end of the triangle, it is getting ready for a rally move. It is currently ranging in the 4190–4220 zone. Overall, I have drawn two scenarios on the chart, and in both cases I expect a drop to the 4120–4130 area as the first target. It’s better not to trade until price breaks out of this zone due to the market being in a range.
Regards,
Alireza!

Gold Looks Prime for All-Time High Breakout📈 Technical Analysis of the Chart
The chart shows XAU/USD (Gold vs. USD) moving in what appears to be an upward-sloping channel — higher lows are marked by trend-line support.
Price recently revisited the lower boundary (support zone + trendline) and appears to have held firm — a bullish signal (i.e. a “retest & bounce”).
The annotation “POI” (Point of Interest) near that bounce suggests a probable pivot from support → initiating the next leg up.
On the upside, the chart projects a move toward a new all-time high (ATH) — the red horizontal line — implying a breakout of the current consolidation zone.
If gold breaks above current resistance and stays above the channel’s upper boundary, that increase could accelerate with bullish momentum. This aligns with typical breakout + retest strategies often used in gold trading.
Conversely, if price fails to hold this support zone and drops below the trendline, the bullish setup would be invalidated — a risk to watch, especially if sentiment shifts.
Technical conclusion: The chart shows a classic channel-retest setup — if upward momentum continues, a move toward the all-time high is well justified. The current bounce from support provides a favorable entry setup for bulls, with manageable risk if a stop-loss is set just below the channel support.
🌍 Fundamental & Macro Context
Gold’s recent strength is driven by expectations of lower interest rates: as a non-yielding asset, gold tends to benefit when rates fall because the opportunity cost of holding gold decreases.
A weaker U.S. dollar — often accompanying potential rate cuts — makes gold cheaper for foreign buyers, adding further demand support.
Broad economic context: unsteady global growth, geopolitical uncertainty, and rising demand for safe-haven assets help maintain strong gold demand.
Market forecasts remain bullish: some analysts see gold reaching as high as $4,950/oz by 2026, with a more likely base-case target around $4,500/oz — assuming rate cuts and continued macroeconomic uncertainty.
That said, the key risk remains in a potential rebound of the U.S. Dollar or abrupt shift in monetary policy (e.g. fewer rate cuts than expected) — either could undercut gold’s rally.
Fundamental conclusion: The macro backdrop — rate-cut expectations, weak USD, and global uncertainty — strongly supports a continuation of gold’s upward trajectory. If these tailwinds persist, gold’s push toward new highs is fundamentally justified.
✅ What This Setup Means & What to Watch
If bullish scenario plays out
Expect price to challenge the all-time high. A breakout may target or even exceed prior ATHs.
A bounce-and-run scenario may attract momentum traders, fueling further upside.
Key triggers to monitor
Keep an eye on announcements from Federal Reserve: rate-cut decisions or dovish signals accelerate gold demand.
Watch USD strength: a strong dollar could cap gains or reverse the uptrend.
Monitor global risk sentiment — geopolitical events or economic slowdown fears tend to push money into gold.
Risk control considerations
Use the channel support / trendline as a stop-loss anchor. A breakdown below could invalidate the bullish bias.
Consider that strong moves in the dollar or surprising inflation data might compress gold’s upside or spark a pullback.

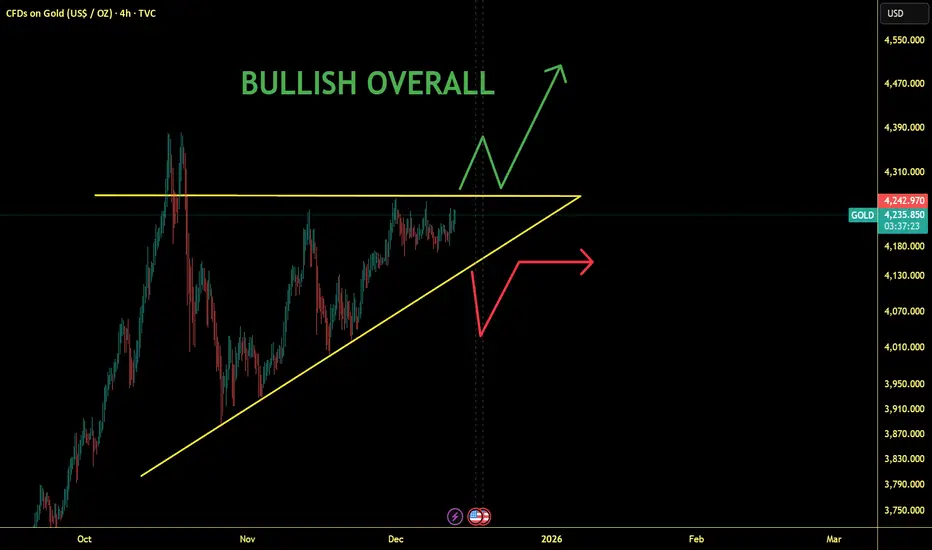
Gold Is Coiling for a Monster Move: Breakout to New HighsGold looks bullish because price has been forming an ascending triangle, which is a classic continuation pattern that often leads to an upside breakout. The chart shows a series of higher lows, meaning buyers are consistently stepping in earlier each time the market dips. At the same time, price keeps returning to the same horizontal resistance level without creating lower highs, which suggests that sellers are gradually losing strength.
As the market compresses toward the apex of this triangle, it reaches a critical decision point. A clean break above resistance would confirm the pattern and likely send price toward a retest of the all-time highs. This aligns well with your overall bullish sentiment, since the structure shows tightening momentum in favor of buyers.
If the rising trendline fails, the pattern would break down and a deeper pullback could follow, but the prevailing trend and current structure still lean toward strength. Overall, the chart supports the idea that gold is on the verge of a significant move, with the pressure building in favor of an upside breakout.