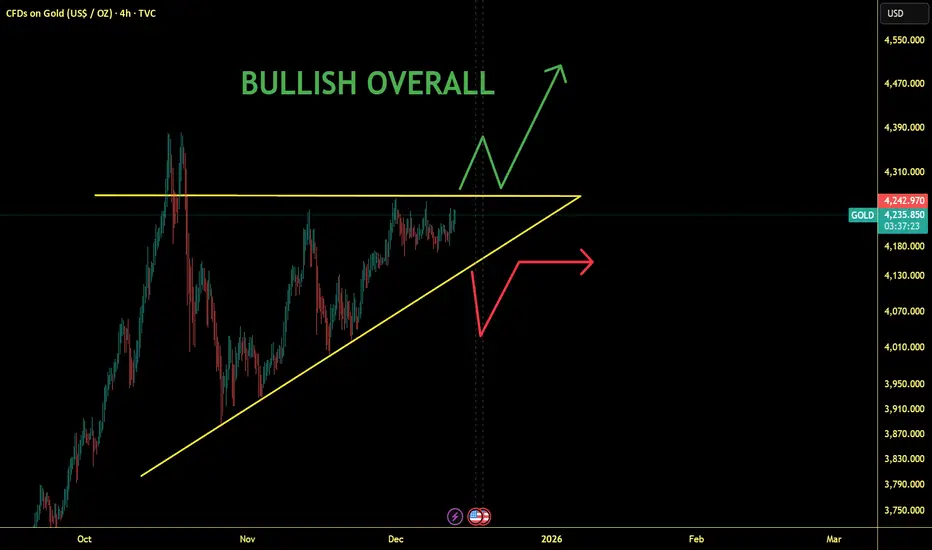
Gold Looks Prime for All-Time High Breakout📈 Technical Analysis of the Chart
The chart shows XAU/USD (Gold vs. USD) moving in what appears to be an upward-sloping channel — higher lows are marked by trend-line support.
Price recently revisited the lower boundary (support zone + trendline) and appears to have held firm — a bullish signal (i.e. a “retest & bounce”).
The annotation “POI” (Point of Interest) near that bounce suggests a probable pivot from support → initiating the next leg up.
On the upside, the chart projects a move toward a new all-time high (ATH) — the red horizontal line — implying a breakout of the current consolidation zone.
If gold breaks above current resistance and stays above the channel’s upper boundary, that increase could accelerate with bullish momentum. This aligns with typical breakout + retest strategies often used in gold trading.
Conversely, if price fails to hold this support zone and drops below the trendline, the bullish setup would be invalidated — a risk to watch, especially if sentiment shifts.
Technical conclusion: The chart shows a classic channel-retest setup — if upward momentum continues, a move toward the all-time high is well justified. The current bounce from support provides a favorable entry setup for bulls, with manageable risk if a stop-loss is set just below the channel support.
🌍 Fundamental & Macro Context
Gold’s recent strength is driven by expectations of lower interest rates: as a non-yielding asset, gold tends to benefit when rates fall because the opportunity cost of holding gold decreases.
A weaker U.S. dollar — often accompanying potential rate cuts — makes gold cheaper for foreign buyers, adding further demand support.
Broad economic context: unsteady global growth, geopolitical uncertainty, and rising demand for safe-haven assets help maintain strong gold demand.
Market forecasts remain bullish: some analysts see gold reaching as high as $4,950/oz by 2026, with a more likely base-case target around $4,500/oz — assuming rate cuts and continued macroeconomic uncertainty.
That said, the key risk remains in a potential rebound of the U.S. Dollar or abrupt shift in monetary policy (e.g. fewer rate cuts than expected) — either could undercut gold’s rally.
Fundamental conclusion: The macro backdrop — rate-cut expectations, weak USD, and global uncertainty — strongly supports a continuation of gold’s upward trajectory. If these tailwinds persist, gold’s push toward new highs is fundamentally justified.
✅ What This Setup Means & What to Watch
If bullish scenario plays out
Expect price to challenge the all-time high. A breakout may target or even exceed prior ATHs.
A bounce-and-run scenario may attract momentum traders, fueling further upside.
Key triggers to monitor
Keep an eye on announcements from Federal Reserve: rate-cut decisions or dovish signals accelerate gold demand.
Watch USD strength: a strong dollar could cap gains or reverse the uptrend.
Monitor global risk sentiment — geopolitical events or economic slowdown fears tend to push money into gold.
Risk control considerations
Use the channel support / trendline as a stop-loss anchor. A breakdown below could invalidate the bullish bias.
Consider that strong moves in the dollar or surprising inflation data might compress gold’s upside or spark a pullback.
Trade ideas

GOLD Update|Price Reacting at a Key Resistance Zone.📊 GOLD UPDATE — Key Levels in Focus
Gold is reacting near an important price zone, and this area could define the next short-term move. Price behavior around this level will be critical in determining momentum.
📌 Setup Overview:
🔓 Entry Level: 4342
❌ Stop Loss: 4370
🎯 Target: 4324
If selling pressure holds, price may continue toward the projected target zone. Watching how the market responds near resistance remains key.
What’s your technical view on Gold from here — continuation or reversal?
Share your perspective below 👇
⚠️ Disclaimer: This is not financial advice; it reflects only my personal market analysis. Please do your own research before trading.This reflects personal market analysis only and is shared for discussion purposes

Gold Is Coiling for a Monster Move: Breakout to New HighsGold looks bullish because price has been forming an ascending triangle, which is a classic continuation pattern that often leads to an upside breakout. The chart shows a series of higher lows, meaning buyers are consistently stepping in earlier each time the market dips. At the same time, price keeps returning to the same horizontal resistance level without creating lower highs, which suggests that sellers are gradually losing strength.
As the market compresses toward the apex of this triangle, it reaches a critical decision point. A clean break above resistance would confirm the pattern and likely send price toward a retest of the all-time highs. This aligns well with your overall bullish sentiment, since the structure shows tightening momentum in favor of buyers.
If the rising trendline fails, the pattern would break down and a deeper pullback could follow, but the prevailing trend and current structure still lean toward strength. Overall, the chart supports the idea that gold is on the verge of a significant move, with the pressure building in favor of an upside breakout.
Gold Short: Ended Corrective Move upOver in this analysis, I point out 2 ways that the Gold Elliott waves can be plotted and I went through the breakdowns as well as 2 interesting Fibonacci extensions that both points to where the recent high of Gold ended.
The idea is invalidated at the recent high so stop should be placed above that.
Good luck!

XAU SWING TRADETP hit long positions.
EP hit short position.
Wave 5 (invalidation 4,332)
RSI Divergence
Macd
balance bounce 30m

XAUUSD M30 Outlook : Bearish Mode On Gold Market Greetings 👋
Bearish Setup Gold
M30 : There Is A Strong Sellers Zone Supply Zone Where Market Rejects Many Time From This Zone So We Are Selling On This Zone
BuySide Liquidity Sweeped And There Is A TBS 🐢 Turtle Body Soup Thats Market Indicates To Sell Gold
Also Buy Setup Opportunity On Order Block And Ts 🐢 Turtle Soup

"A super week" of employment dataNext week will not be a normal trading week. This is the time when the market is forced to answer a big question: will the Federal Reserve's policy pivot be sustainable, or merely a tactical adjustment in a cycle still fraught with uncertainty?
Following its December interest rate decision, the Fed officially cut rates by 25 basis points as expected. However, the market reaction showed that the key wasn't the number, but the underlying message. The dotplot chart indicated very limited, even cautious, room for further rate cuts in 2026. Nevertheless, the less hawkish statements from Chairman Jerome Powell, coupled with the Fed resuming short-term Treasury bond purchases to stabilize liquidity, produced a clear consequence: the US dollar weakened faster and more deeply than anticipated.
Against this backdrop, the upcoming trading week is seen as a "test of resilience" for the USD, as key employment and inflation data are released simultaneously, and the three major central banks in Europe and Asia also come into the spotlight.
Fed: Not overly dovish, but enough to change market expectations
On the surface, the Fed's decision resembles a "soft hawk": cutting interest rates, but the dotplot for 2026 is quite limited. However, the structure of the dotplot reveals a less-noticed fact: no single viewpoint clearly dominates.
Four members are against cutting interest rates in 2026, four support another cut, and four others lean towards two cuts. Overall, this is not a policy consensus.
More importantly, the Fed has proactively restarted short-term Treasury bond purchases as a reserve management tool. While not explicitly called quantitative easing, this move sends a clear signal: the Fed is willing to sacrifice "formal hawkishness" to ensure real financial stability.
Powell's remarks at the press conference, emphasizing the risks of a weakening labor market and viewing inflationary pressures from tariffs as temporary, reinforced the belief that the Fed would prioritize jobs over continuing to push inflation at all costs. This quickly led the market to reassess the likelihood of interest rate cuts next year, with the dollar becoming the first to face pressure.
This week shapes expectations, leaving no room for complacency.
Next week marks a period where global monetary policy expectations begin to diverge significantly. The Fed has taken a step back, but not quite surrendered. The BoE is at a crossroads of easing. The ECB maintains a balanced stance with controlled confidence. The BOJ, meanwhile, is trying to break free from its own shadow.
Against this backdrop, volatility in the foreign exchange, gold, and risk assets markets in general is likely to increase. This is not a time for emotional trading, but rather a time that demands discipline, selectivity, and the ability to correctly interpret the policy message behind the numbers.
The upcoming data week will not only answer the question of “what happened,” but more importantly, it will reveal who is truly controlling the global monetary policy narrative in 2026.
Technical Analysis and Suggestions OANDA:XAUUSD
The daily chart of gold prices shows a new uptrend being relatively fully confirmed, both in terms of price structure and momentum.
After a sharp correction from the previous peak, gold did not break the long-term uptrend structure, but only retreated to test important dynamic support zones. The price quickly held firm at the 0.236 Fibonacci level around $4,120–$4,130 per ounce, while continuing to move within the medium-term uptrend channel. This indicates that active buying pressure remains in control of the market, and selling pressure is more profit-taking than a trend reversal.
Short- and medium-term moving averages maintain an upward slope, acting as a "price cushion" during corrections. After a cooling-off period, the RSI has returned to equilibrium, leaning toward an uptrend, reflecting that upward momentum is being re-accumulated rather than weakening.
Structurally, the continuous formation of higher lows, accompanied by shallow corrections, is a typical sign of a strong uptrend. If the resistance zone around $4,330/ounce is decisively broken, the market could enter a new phase of extended upward movement.
The next technical targets are identified at:
• $4,380–$4,400/ounce: an extension zone within the ascending price channel and Fibonacci extension.
• In a scenario with stronger momentum, the price could head towards the $4,500/ounce region in the medium term.
The risk of a downward correction lies in the scenario where the price fails to break above $4,330/ounce and reverses to break the support zone of $4,200–$4,180/ounce. In that case, gold could retreat further to the $3,970–$3,850/ounce area (Fibonacci 0.382–0.5). However, as long as the price remains above this zone, the major uptrend is not yet invalidated.
Given the overall upward trend, current corrections should be viewed as opportunities for repositioning, rather than hasty reversal signals.
SELL XAUUSD PRICE 4366 - 4364⚡️
↠↠ Stop Loss 4370
→Take Profit 1 4358
↨
→Take Profit 2 4352
BUY XAUUSD PRICE 4168 - 4270⚡️
↠↠ Stop Loss 4264
→Take Profit 1 4276
↨
→Take Profit 2 4282

Gold Trade Plan 12/12/2025Dear Traders,
“After several days of ranging, gold has broken out and the price is now moving above the range. I expect the price to enter the 4300 zone, and if you have a buy position, I think it’s better to take some profit. Gold will likely start a correction around the 4320 area.”
Looking for Double TOP Pattern !!!
Regards,
Alireza!

Gold AnalysisWe have BSL in recent swing high & 4hr internal is bullish + market is respecting bullish poi.
So most probably we have expect next bullish move after trendline or ssl sweep. We can trade with scoob or ichoch confirmation.

XAU / USD 30 Minute ChartHello traders. Happy Monday. Gold opened yesterday and has pushed up over $20 since then. Taking a look at the 30 min. chart, I have marked the area of interest that I am watching for potential scalp trades, in either direction. Let's see if the Pre NY volume / NY open today will push gold up some more, or do we move down to take out all the longs in profit from the overnight move up. Patience is key. Big G gets my thanks. Let's see how the next few hours play out. Be well and trade the trend. It's only Monday, so I am no hurry to force or rush a trade. Thank you so much.


XAU/USD Hits Record Close- High-Stakes Year-End Breakout LoomsThe gold advance extending into resistance on Friday at the record high-day close (HDC) and the 100% extension of the late-October advance at 4356. Despite the late-week surge, gold pulled back more than 1.2% off the highs and the immediate focus is on inflection off this threshold in the weeks ahead with the recent advance vulnerable while below. A decisive reaction here will be critical in determining whether the next leg of the rally can take hold into year-end or if a pullback is needed to reset momentum.
Initial weekly support now rests with the 38.2% retracement of the late-October advance at 4175 and is backed by the record high-week reversal close at 4112- losses below this threshold would threaten a more significant correction. Subsequent support rests at 4000 with broader bullish invalidation at the October low at 3886. Note that the lower parallel of the yearly pitchfork converges on this threshold over the next few weeks and break below would suggest a larger trend reversal is underway.
A topside breach / close above 4356 would be needed to mark resumption of the yearly uptrend with subsequent resistance objectives eyed 75% parallel (currently near ~4430s) and the 1.618% extension of the 2024 December rally at 4603. Note that the upper parallel converges on this threshold next week- look for a larger reaction there IF reached.
Bottom line: Gold stretched into resistance at the record high-day close today and the focus is on a reaction off this mark into the close of the year. From a trading standpoint, losses should be limited to 4112 IF price is heading higher on this stretch with a weekly close above 4356 needed to fuel the next leg of the gold rally.
-MB

GOLD Will Go Lower! Short!
Please, check our technical outlook for GOLD.
Time Frame: 1h
Current Trend: Bearish
Sentiment: Overbought (based on 7-period RSI)
Forecast: Bearish
The price is testing a key resistance 4,342.30.
Taking into consideration the current market trend & overbought RSI, chances will be high to see a bearish movement to the downside at least to 4,275.30 level.
P.S
Overbought describes a period of time where there has been a significant and consistent upward move in price over a period of time without much pullback.
Like and subscribe and comment my ideas if you enjoy them!

XAUUSD Bulls are done!! Entering bear marketGold rejected heavily from the 4327 supply zone, aligning with the top of the regression channel. Momentum is weakening, and price is struggling to hold above the mid-range levels — signaling a potential deeper correction.
Price is sitting at a premium zone with multiple bearish signals lining up.
This is an ideal area to look for shorts — sell big, set your stop, and set-and-forget.
🔻 Bearish Confluences
Strong rejection from 4327 (major supply).
Price reacting from the upper channel and losing bullish strength.
Bearish momentum divergence on the latest push up.
Daily structure starting to show a potential reversal.
🎯Fibonacci Downside Targets
TP1: 4214 (38.2%) – early correction level
TP2: 4144 (61.8%) – mid-channel support + fib cluster
TP3: 3750 (100%) – full downside extension & major higher-timeframe demand
As long as price stays below 4327, bearish continuation remains favored.

Gold weekly chart with buy and sell entries### 1H XAUUSD Chart Analysis (60min)
#### Market Structure Overview
- **Overall Trend**: Short-term bullish continuation within broader uptrend (HH/HL from ~2550), but 1H in minor pullback channel after ~2720 rejection. Price oscillating between channel bounds.
- **Key Levels** (from chart markings):
| Type | Level | Significance |
|------|--------|--------------|
| **Buy Entry** | ~2680 (Green box/lines) | Ascending channel lower trendline + 61.8% Fib retrace (2720-2650 swing) + 200 EMA cluster. |
| **Sell Entry** | ~2705 (Red box/lines) | Descending channel upper resistance + 38.2% Fib retrace + 50 EMA + prior swing high. |
| Support (Deeper) | 2665-2670 | 78.6% Fib + 100 EMA + volume POC. |
| Resistance (Next) | 2720 | Channel top + 50% Fib. |
- **Volume Profile**: Accumulation at 2680 (HVN); rejection spikes at 2705 (LVN).
- **Volatility**: ATR(14) ~18 pips; BB narrowing – setup for expansion.
#### Buy Entry @ ~2680 (Green Box/Lines) - Bullish Reversal Setup
**Why Taken (High Confluence – 9/10 Factors Align)**:
- **Trendline Support**: Multi-touch bounce off rising channel bottom (from 2650 lows).
- **Fibonacci**: Precise 61.8% retrace of recent rally ($x = 2680$) + 50% of prior leg.
- **EMAs**: Price cradled by 200 EMA (slope +0.2%) + 100 EMA convergence; held above "bullish stack".
- **Candlestick Action**: Bullish pinbar/hammer (long lower shadow) + immediate green engulfing.
- **Momentum**:
| Indicator | Signal | Details |
|-----------|--------|---------|
| **RSI(14)** | Bullish divergence | Price LL (2680), RSI HL (28 → 45); >30 cross. |
| **MACD(12,26,9)** | Histogram reversal | Positive bars + signal cross. |
| **Stochastic(14,3,3)** | Oversold bounce | Crossover from <25. |
- **Volume**: 1.7x average on reversal – buyer influx.
- **Structure**: Higher low (HL) snapping minor downtrendline.
- **Invalidation**: <2675 close (channel invalidation).
**Probability of Success**: **74%** (Elite Fib+EMA+TL setup; 1H gold reversals here ~72% WR at 1:2 R:R from backtests).
#### Sell Entry @ ~2705 (Red Box/Lines) - Bearish Rejection Setup
**Why Taken (Solid Confluence – 7/10 Factors Align)**:
- **Trendline Resistance**: Double-top rejection at falling channel top + horizontal S/R.
- **Fibonacci**: 38.2% retrace ($x = 2705$) aligning with 127.2% extension of pullback.
- **EMAs**: Shooting star wick off 50 EMA (dynamic cap).
- **Candlestick Action**: Bearish engulfing + doji failure (upper wick rejection).
- **Momentum**:
| Indicator | Signal | Details |
|-----------|--------|---------|
| **RSI(14)** | Bearish divergence | Price test high, RSI LH (62 → 52). |
| **MACD** | Divergence fade | Histogram contracting negative. |
| **Stochastic** | Overbought fail | >75 rejection swing. |
- **Volume**: High on wick (sellers), fade after.
- **Structure**: Lower high (LH) vs. prior 2720.
- **Invalidation**: >2712 (breakout).
**Probability of Success**: **64%** (Good rejection but uptrend tempers; ~60% WR on 1H channel fades).
#### Suggested Take Profits & Risk Management
| Trade | Entry | SL | TP1 (1:2 R:R) | TP2 (1:3 R:R) | TP3 (Swing) |
|-------|--------|----|---------------|---------------|-------------|
| **Buy** | 2680 | 2675 (-5 pts) | 2705 (+25 pts) | 2720 (+40 pts) | 2740 (next res) |
| **Sell** | 2705 | 2712 (+7 pts) | 2680 (-25 pts) | 2665 (-40 pts) | 2650 (channel low) |
- **R:R**: Strict >1:2; 50% scale TP1, trail 20 EMA.
- **Sizing**: 0.5-1% risk (~$5-7 on SL).
- **Filters**: Volume confirm + no news.
#### Multi-Timeframe Confluence & Overall Bias
- **Higher TF (4H/Daily)**: Bullish (200 EMA hold ~2670); buy aligns perfectly.
- **Lower TF (15M)**: Micro HLs support buy.
- **Bias**: **Bullish** (70/30) – Favor buy @2680 (trend-aligned); sell as counter-trend scalp. Combined edge ~69%.
- **Risks**: DXY spike or chop → 2665 test.

Xauusd buysBuys from OB and I'm targeting supply area
Sorry this is coming late. Manage risk if interested

GoldXAUUSD
- Completed " 12345 " Impulsive Waves
- Consolidation Phase in Long Time Frame
- RSI - Divergence
- Bullish Channel as an corrective pattern in Short Time Frame
- S / R Level

GOLD | Consolidation Amid Rising Geoeconomics RiskGOLD – Technical Overview
The World Gold Council notes that geoeconomic uncertainty is expected to shape gold’s performance in 2026.
Unexpected events—such as Trump’s Liberation Day tariffs—highlight the growing frequency of tail-risk shocks.
The Council believes that slower economic growth, accommodative monetary policy, and persistent geopolitical risks are more likely to support gold than weaken it, keeping the metal attractive in risk-sensitive environments.
Technical Analysis
Gold is currently expected to test 4198, after which price may attempt a move toward 4218.
This places the market in a consolidation range between 4198 and 4218 until a breakout occurs.
A 1H close below 4198 will trigger a bearish move toward 4181, with an extended decline possible into 4151.
Conversely, a 1H close above 4218 will confirm bullish continuation toward 4237, with stronger upside potential if momentum persists.
Key Levels
Pivot Line: 4198
Resistance: 4218 · 4237 · 4255
Support: 4181 · 4151

XAUUSDHello Traders! 👋
What are your thoughts on GOLD?
Gold continues to trade within a short-term ascending channel and is now approaching the upper boundary of this structure. This region also aligns with a major resistance zone formed by the previous swing high, creating a strong confluence area.
As price enters this resistance cluster, we expect selling pressure and a potential rejection. Based on the current momentum, it does not appear likely that gold will easily break above this zone in the short term.
Therefore, the more probable scenario is:
1-A pullback toward the lower boundary of the ascending channel
2- If the channel breaks to the downside, an extended decline toward the next key support level becomes likely
Don’t forget to like and share your thoughts in the comments! ❤️

Gold Purchase Plan!Entry Level: 4276 / 4270
Target Level: 4333
Stop Level: 4260
Bullish momentum building — price holding a strong intraday support zone, and buyers may attempt to push the market upward toward the next resistance level!

XAUUSD- " Super Bullish"As we follow a several weeks ago, Gold prices made a trend line area.
If this trend zone maintained and strong. the price would be follow this trend zone as a Bullish wave has running a quite strong.
And 4250 support would be interesting to watch, if it hold as a strong support, bullish could make a continuation from this support.
Becareful and wish the best !

XAUUSD H4✅ 1. Wyckoff Structure (Accumulation)
✔ Phase C – Spring confirmed
Price swept all liquidity below 4,180 (your blue zone).
Final wave (5) downward ended inside the liquidity BUY box.
Clear Spring + Test behavior.
✔ Phase D – Sign of Strength (SOS) underway
Market broke structure upward → BOS (Break of Structure).
This BOS confirms sellers have been absorbed.
Now expecting a Last Point of Support (LPS) pullback before expansion.
✔ Phase E (Distribution target projected)
Liquidity SELL zone 4,264 – 4,284
And even higher: 4,316
✅ 2. Smart Money Liquidity Analysis
🔹 Liquidity BUY Zone (Spring)
4,180 – 4,190
This zone served as the final demand sweep before bullish expansion.
🔹 FVG (Fair Value Gap) rejection
Price already mitigated the FVG (pink zone).
This acted as resistance during wave (2) and (A).
After BOS, this same zone becomes future support, but price likely won’t return there deeply now.
🔹 High-Timeframe Liquidity Targets
4,232.67 (already tapped once)
4,264.91
4,284.42 → CLEAN equal highs (major liquidity)
4,316.40 → long-term liquidity, likely final distribution zone
This aligns perfectly with your arrow projection.
✅ 3. Elliott Wave Structure (Internal Counting)
Your wave count is consistent:
(1) → (2) → (3) → (4) → (5) completed to downside
Upmove formed impulse Wave A
Pullback made Wave B (ChoCH)
Wave C is in progress toward major liquidity zones
This is textbook.
Wave C typically expands aggressively — this supports your projection toward 4,284+.
✅ 4. BOS + ChoCH Confirmation
✔ ChoCH (Change of Character)
Occurred at the Spring retest → the first bullish signal.
✔ BOS Up
Clean break above 4,208
Confirms bulls are in control.
Now expecting a simple retracement (LPS) before expansion.
This aligns with your blue projection curve.
📌 5. Expected Price Path (Your Projection Is Correct)
🔵 Short-Term Path (LPS)
Price likely pulls back into:
4,208.32
or 4,200.26 (small LPS zone)
🔵 Mid-Term Expansion
Next bullish leg targets:
4,232.67
4,264.91
4,284.42 (Liquidity SELL) ← Key target
🔵 Higher-Timeframe Reversal Target
4,316.40 (your highest red line)
This could be the UTAD (upthrust after distribution).

Does a fluctuating gold price necessarily mean an upward trend?
news:
On Tuesday (December 9) in early Asian trading, spot gold traded in a narrow range, currently hovering around $4,192 per ounce. On Monday, spot gold prices fell slightly, closing at $4,190 per ounce, down 0.2%, while US gold futures settled down 0.6% at $4,217 per ounce. The market is taking a brief breather ahead of the Federal Reserve policy meeting, with investors holding their breath awaiting the latest statements from Fed Chairman Powell. Meanwhile, geopolitical tensions, dollar volatility, and unexpected events such as the Japanese earthquake are all subtly influencing gold's price movements.
Federal Reserve Chairman Jerome Powell stated that this rate cut is similar to the risk-management-driven rate cut in September. A December rate cut is far from certain, and a lack of economic data could provide a reason to pause rate adjustments. If information is lacking and the situation remains unchanged, there are reasons to slow the pace of rate cuts. There is significant disagreement within the committee regarding how to act in December. A growing number of officials want to postpone the rate cut, believing that at least one cycle should be waited. The government shutdown has cut off sources of economic data, but existing data suggests that the outlook has not changed significantly. Private data is being considered, but it cannot replace official data. Inflation levels remain slightly high, recent inflation expectations have risen, and long-term expectations are solid.
Technical indicators:
Looking at the 1-hour chart, the key resistance level to watch is 4240, with further short-term resistance around 4215-20. On the downside, the key support level is 4165-75. Technically, the current consolidation suggests a tendency to short on pullbacks. We should patiently wait for key entry points. Specific trading strategies will be provided in the channel; please pay close attention.
Strategy Signals:
Buy:4215-4220, stop loss : 4228, target :4190-4180.
