Gold AnalysisWe have BSL in recent swing high & 4hr internal is bullish + market is respecting bullish poi.
So most probably we have expect next bullish move after trendline or ssl sweep. We can trade with scoob or ichoch confirmation.
Market insights

XAU / USD 30 Minute ChartHello traders. Happy Monday. Gold opened yesterday and has pushed up over $20 since then. Taking a look at the 30 min. chart, I have marked the area of interest that I am watching for potential scalp trades, in either direction. Let's see if the Pre NY volume / NY open today will push gold up some more, or do we move down to take out all the longs in profit from the overnight move up. Patience is key. Big G gets my thanks. Let's see how the next few hours play out. Be well and trade the trend. It's only Monday, so I am no hurry to force or rush a trade. Thank you so much.

Gold weekly chart with buy and sell entries### 1H XAUUSD Chart Analysis (60min)
#### Market Structure Overview
- **Overall Trend**: Short-term bullish continuation within broader uptrend (HH/HL from ~2550), but 1H in minor pullback channel after ~2720 rejection. Price oscillating between channel bounds.
- **Key Levels** (from chart markings):
| Type | Level | Significance |
|------|--------|--------------|
| **Buy Entry** | ~2680 (Green box/lines) | Ascending channel lower trendline + 61.8% Fib retrace (2720-2650 swing) + 200 EMA cluster. |
| **Sell Entry** | ~2705 (Red box/lines) | Descending channel upper resistance + 38.2% Fib retrace + 50 EMA + prior swing high. |
| Support (Deeper) | 2665-2670 | 78.6% Fib + 100 EMA + volume POC. |
| Resistance (Next) | 2720 | Channel top + 50% Fib. |
- **Volume Profile**: Accumulation at 2680 (HVN); rejection spikes at 2705 (LVN).
- **Volatility**: ATR(14) ~18 pips; BB narrowing – setup for expansion.
#### Buy Entry @ ~2680 (Green Box/Lines) - Bullish Reversal Setup
**Why Taken (High Confluence – 9/10 Factors Align)**:
- **Trendline Support**: Multi-touch bounce off rising channel bottom (from 2650 lows).
- **Fibonacci**: Precise 61.8% retrace of recent rally ($x = 2680$) + 50% of prior leg.
- **EMAs**: Price cradled by 200 EMA (slope +0.2%) + 100 EMA convergence; held above "bullish stack".
- **Candlestick Action**: Bullish pinbar/hammer (long lower shadow) + immediate green engulfing.
- **Momentum**:
| Indicator | Signal | Details |
|-----------|--------|---------|
| **RSI(14)** | Bullish divergence | Price LL (2680), RSI HL (28 → 45); >30 cross. |
| **MACD(12,26,9)** | Histogram reversal | Positive bars + signal cross. |
| **Stochastic(14,3,3)** | Oversold bounce | Crossover from <25. |
- **Volume**: 1.7x average on reversal – buyer influx.
- **Structure**: Higher low (HL) snapping minor downtrendline.
- **Invalidation**: <2675 close (channel invalidation).
**Probability of Success**: **74%** (Elite Fib+EMA+TL setup; 1H gold reversals here ~72% WR at 1:2 R:R from backtests).
#### Sell Entry @ ~2705 (Red Box/Lines) - Bearish Rejection Setup
**Why Taken (Solid Confluence – 7/10 Factors Align)**:
- **Trendline Resistance**: Double-top rejection at falling channel top + horizontal S/R.
- **Fibonacci**: 38.2% retrace ($x = 2705$) aligning with 127.2% extension of pullback.
- **EMAs**: Shooting star wick off 50 EMA (dynamic cap).
- **Candlestick Action**: Bearish engulfing + doji failure (upper wick rejection).
- **Momentum**:
| Indicator | Signal | Details |
|-----------|--------|---------|
| **RSI(14)** | Bearish divergence | Price test high, RSI LH (62 → 52). |
| **MACD** | Divergence fade | Histogram contracting negative. |
| **Stochastic** | Overbought fail | >75 rejection swing. |
- **Volume**: High on wick (sellers), fade after.
- **Structure**: Lower high (LH) vs. prior 2720.
- **Invalidation**: >2712 (breakout).
**Probability of Success**: **64%** (Good rejection but uptrend tempers; ~60% WR on 1H channel fades).
#### Suggested Take Profits & Risk Management
| Trade | Entry | SL | TP1 (1:2 R:R) | TP2 (1:3 R:R) | TP3 (Swing) |
|-------|--------|----|---------------|---------------|-------------|
| **Buy** | 2680 | 2675 (-5 pts) | 2705 (+25 pts) | 2720 (+40 pts) | 2740 (next res) |
| **Sell** | 2705 | 2712 (+7 pts) | 2680 (-25 pts) | 2665 (-40 pts) | 2650 (channel low) |
- **R:R**: Strict >1:2; 50% scale TP1, trail 20 EMA.
- **Sizing**: 0.5-1% risk (~$5-7 on SL).
- **Filters**: Volume confirm + no news.
#### Multi-Timeframe Confluence & Overall Bias
- **Higher TF (4H/Daily)**: Bullish (200 EMA hold ~2670); buy aligns perfectly.
- **Lower TF (15M)**: Micro HLs support buy.
- **Bias**: **Bullish** (70/30) – Favor buy @2680 (trend-aligned); sell as counter-trend scalp. Combined edge ~69%.
- **Risks**: DXY spike or chop → 2665 test.


XAU/USD Hits Record Close- High-Stakes Year-End Breakout LoomsThe gold advance extending into resistance on Friday at the record high-day close (HDC) and the 100% extension of the late-October advance at 4356. Despite the late-week surge, gold pulled back more than 1.2% off the highs and the immediate focus is on inflection off this threshold in the weeks ahead with the recent advance vulnerable while below. A decisive reaction here will be critical in determining whether the next leg of the rally can take hold into year-end or if a pullback is needed to reset momentum.
Initial weekly support now rests with the 38.2% retracement of the late-October advance at 4175 and is backed by the record high-week reversal close at 4112- losses below this threshold would threaten a more significant correction. Subsequent support rests at 4000 with broader bullish invalidation at the October low at 3886. Note that the lower parallel of the yearly pitchfork converges on this threshold over the next few weeks and break below would suggest a larger trend reversal is underway.
A topside breach / close above 4356 would be needed to mark resumption of the yearly uptrend with subsequent resistance objectives eyed 75% parallel (currently near ~4430s) and the 1.618% extension of the 2024 December rally at 4603. Note that the upper parallel converges on this threshold next week- look for a larger reaction there IF reached.
Bottom line: Gold stretched into resistance at the record high-day close today and the focus is on a reaction off this mark into the close of the year. From a trading standpoint, losses should be limited to 4112 IF price is heading higher on this stretch with a weekly close above 4356 needed to fuel the next leg of the gold rally.
-MB

GOLD Will Go Lower! Short!
Please, check our technical outlook for GOLD.
Time Frame: 1h
Current Trend: Bearish
Sentiment: Overbought (based on 7-period RSI)
Forecast: Bearish
The price is testing a key resistance 4,342.30.
Taking into consideration the current market trend & overbought RSI, chances will be high to see a bearish movement to the downside at least to 4,275.30 level.
P.S
Overbought describes a period of time where there has been a significant and consistent upward move in price over a period of time without much pullback.
Like and subscribe and comment my ideas if you enjoy them!

Xauusd buysBuys from OB and I'm targeting supply area
Sorry this is coming late. Manage risk if interested

GoldXAUUSD
- Completed " 12345 " Impulsive Waves
- Consolidation Phase in Long Time Frame
- RSI - Divergence
- Bullish Channel as an corrective pattern in Short Time Frame
- S / R Level

Gold Purchase Plan!Entry Level: 4276 / 4270
Target Level: 4333
Stop Level: 4260
Bullish momentum building — price holding a strong intraday support zone, and buyers may attempt to push the market upward toward the next resistance level!

XAUUSD- " Super Bullish"As we follow a several weeks ago, Gold prices made a trend line area.
If this trend zone maintained and strong. the price would be follow this trend zone as a Bullish wave has running a quite strong.
And 4250 support would be interesting to watch, if it hold as a strong support, bullish could make a continuation from this support.
Becareful and wish the best !

XAUUSD H4✅ 1. Wyckoff Structure (Accumulation)
✔ Phase C – Spring confirmed
Price swept all liquidity below 4,180 (your blue zone).
Final wave (5) downward ended inside the liquidity BUY box.
Clear Spring + Test behavior.
✔ Phase D – Sign of Strength (SOS) underway
Market broke structure upward → BOS (Break of Structure).
This BOS confirms sellers have been absorbed.
Now expecting a Last Point of Support (LPS) pullback before expansion.
✔ Phase E (Distribution target projected)
Liquidity SELL zone 4,264 – 4,284
And even higher: 4,316
✅ 2. Smart Money Liquidity Analysis
🔹 Liquidity BUY Zone (Spring)
4,180 – 4,190
This zone served as the final demand sweep before bullish expansion.
🔹 FVG (Fair Value Gap) rejection
Price already mitigated the FVG (pink zone).
This acted as resistance during wave (2) and (A).
After BOS, this same zone becomes future support, but price likely won’t return there deeply now.
🔹 High-Timeframe Liquidity Targets
4,232.67 (already tapped once)
4,264.91
4,284.42 → CLEAN equal highs (major liquidity)
4,316.40 → long-term liquidity, likely final distribution zone
This aligns perfectly with your arrow projection.
✅ 3. Elliott Wave Structure (Internal Counting)
Your wave count is consistent:
(1) → (2) → (3) → (4) → (5) completed to downside
Upmove formed impulse Wave A
Pullback made Wave B (ChoCH)
Wave C is in progress toward major liquidity zones
This is textbook.
Wave C typically expands aggressively — this supports your projection toward 4,284+.
✅ 4. BOS + ChoCH Confirmation
✔ ChoCH (Change of Character)
Occurred at the Spring retest → the first bullish signal.
✔ BOS Up
Clean break above 4,208
Confirms bulls are in control.
Now expecting a simple retracement (LPS) before expansion.
This aligns with your blue projection curve.
📌 5. Expected Price Path (Your Projection Is Correct)
🔵 Short-Term Path (LPS)
Price likely pulls back into:
4,208.32
or 4,200.26 (small LPS zone)
🔵 Mid-Term Expansion
Next bullish leg targets:
4,232.67
4,264.91
4,284.42 (Liquidity SELL) ← Key target
🔵 Higher-Timeframe Reversal Target
4,316.40 (your highest red line)
This could be the UTAD (upthrust after distribution).

Does a fluctuating gold price necessarily mean an upward trend?
news:
On Tuesday (December 9) in early Asian trading, spot gold traded in a narrow range, currently hovering around $4,192 per ounce. On Monday, spot gold prices fell slightly, closing at $4,190 per ounce, down 0.2%, while US gold futures settled down 0.6% at $4,217 per ounce. The market is taking a brief breather ahead of the Federal Reserve policy meeting, with investors holding their breath awaiting the latest statements from Fed Chairman Powell. Meanwhile, geopolitical tensions, dollar volatility, and unexpected events such as the Japanese earthquake are all subtly influencing gold's price movements.
Federal Reserve Chairman Jerome Powell stated that this rate cut is similar to the risk-management-driven rate cut in September. A December rate cut is far from certain, and a lack of economic data could provide a reason to pause rate adjustments. If information is lacking and the situation remains unchanged, there are reasons to slow the pace of rate cuts. There is significant disagreement within the committee regarding how to act in December. A growing number of officials want to postpone the rate cut, believing that at least one cycle should be waited. The government shutdown has cut off sources of economic data, but existing data suggests that the outlook has not changed significantly. Private data is being considered, but it cannot replace official data. Inflation levels remain slightly high, recent inflation expectations have risen, and long-term expectations are solid.
Technical indicators:
Looking at the 1-hour chart, the key resistance level to watch is 4240, with further short-term resistance around 4215-20. On the downside, the key support level is 4165-75. Technically, the current consolidation suggests a tendency to short on pullbacks. We should patiently wait for key entry points. Specific trading strategies will be provided in the channel; please pay close attention.
Strategy Signals:
Buy:4215-4220, stop loss : 4228, target :4190-4180.

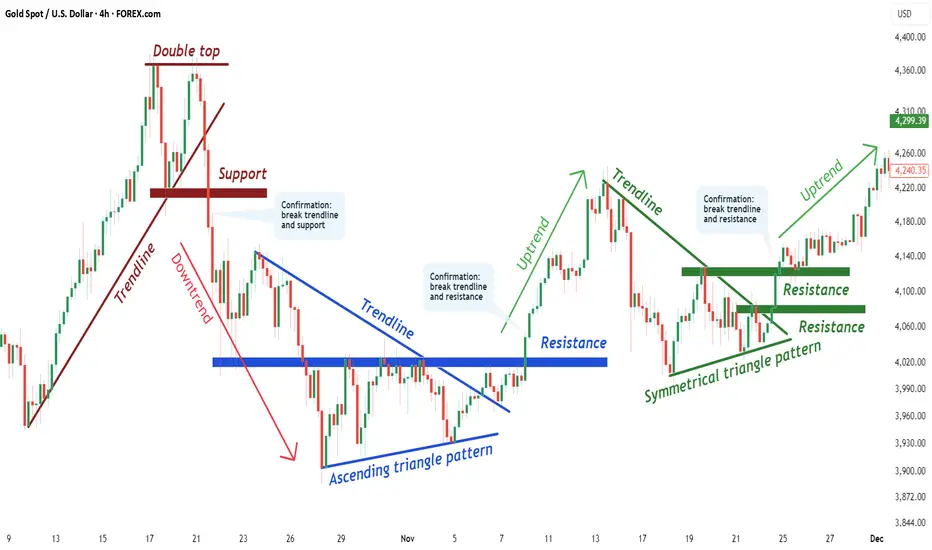
How to Use Chart Patterns in a High-Probability Way Tutorial #1In this tutorial, I explain how to use chart patterns in a structured and high-probability way, focusing on confirmation, market logic, and clean execution.
WHAT IS A CHART PATTERN?
A chart pattern is a visual representation of price behavior that forms due to market psychology, supply and demand, and repeated trader reactions.
Chart patterns help identify potential continuations or reversals when confirmed correctly.
CHART PATTERNS COVERED IN THIS TUTORIAL
1.) Double Top
2.) Ascending Triangle Pattern
3.) Symmetrical Triangle Pattern
WHAT IS A DOUBLE TOP?
A Double Top is a bearish reversal pattern formed after an uptrend.
Price fails to break a resistance level twice, signaling buyer exhaustion and a potential shift in control from buyers to sellers.
WHAT IS AN ASCENDING TRIANGLE PATTERN?
An Ascending Triangle is a bullish continuation pattern characterized by higher lows pressing against a flat resistance level.
It reflects increasing buyer strength and often leads to a breakout once resistance is broken with confirmation.
WHAT IS A SYMMETRICAL TRIANGLE PATTERN?
A Symmetrical Triangle represents consolidation, where higher lows and lower highs compress price action.
The breakout direction defines the next impulsive move once volatility expands.
GENERAL STEP-BY-STEP PROCESS
1.) Identify the chart pattern on the chart
(Unconfirmed structure forming)
2.) Draw the key trendlines and neckline
(Support and resistance define structure validity)
3.) Wait for a break of BOTH the trendline and the neckline
(This confirms the chart pattern)
4.) Move to a lower timeframe and look for an entry
(Trade in the direction of the confirmed breakout using clean price action)
If you want PART 2 , leave a like and a comment.
Follow for high-quality trading education and clean technical logic.
DISCLAIMER
This content is for educational purposes only and does not constitute financial advice.
Trading involves risk. Always conduct your own analysis.
I am not responsible for any decisions or losses based on this material.

XAUUSD Aggressive Scalp Swing LongOANDA:XAUUSD XAU/USD – Aggressive Scalp/Swing Long (15m timeframe) – Updated Signal Entry Zone: 4,280 – 4,285 (buy limit or market if already bouncing)
Stop Loss: 4,274 (tight, just below today’s low – risk max 9–11$)
Take Profit Targets: TP1: 4,295 – 4,297 (quick scalp – 50–60% position)
TP2: 4,308 – 4,313 (main target – previous highs + upper red zone)
TP3: 4,325 – 4,330 (runner if we get strong follow-through)
Risk/Reward: 1:2 up to 1:5 depending on how many targets you let run Confluence & Reasoning (right now): Price just printed a strong bullish engulfing + pinbar reversal exactly at 4,280 demand
Holding the blue ascending trendline for the 4th time
Higher-timeframe daily trend still very bullish (Gold > 4,200 = structural bull)
Volume spike on the reversal candle
Risk events mostly priced in, safe-haven flows supporting
Execution tips: If you’re not in yet → buy the break & close above 4,288 for confirmation
Already in from 4,280–4,285 → move SL to breakeven now
Partial at 4,295–4,297, let the rest run with trailing stop
#Gold #XAUUSD #GoldTrading #XAUAnalysis #Commodities #DayTrading #SwingTrading #NotFinancialAdvice This is NOT financial advice. Trading involves high risk. Always use proper position sizing and manage your own risk.

1012 GOLD a new chance for mid-term buyersHello traders,
Gold Entry Opportunities Analysis (Harmonic Pattern + Fundamentals)
1. Key Harmonic Pattern Structure Verification
- Proportions:
- XA wave (Uptrend): Magnitude of 1.359;
- AB wave (Pullback): Retraces 0.794 of XA (aligns with the Bat Pattern’s AB = 0.618-0.786 of XA);
- BC wave (Rebound): Extends 1.102 of AB (aligns with the Bat Pattern’s BC = 1.13-1.618 of AB);
- CD wave (Decline): Currently retraces 0.904 of BC (close to the Bat Pattern’s CD = 0.886-1.13 of BC).
The pattern is nearly complete.
The target support for the CD wave corresponds to the 4170-4175 zone (overlapping with prior technical support).
2. Long Entry Opportunity (High-Level Consolidation + Breakout Bias)
Gold is currently in a high-level consolidation phase (trading within a tight range after recent gains). Entering long at the 4170-4175 support zone not only targets the short-term rebound (to 4220), but also positions for a medium-to-long-term breakout:
- Entry Conditions:
Price stabilizes in the 4170-4175 zone (confirmed by bullish candlestick patterns, e.g., hammer/engulfing) + RSI (current 45.13) rebounds above 50.
- Stop Loss:
Below 4163 (the starting point of the XA wave, a critical prior support level).
- Targets:
1st target: 4220 (the high of the BC wave);
2nd target: 4250+ (driven by the Fed rate cut narrative).
3. Fundamental Resonance
Current Fed rate cut expectations + the “dual buffer” from potential BOJ tightening limit deep short-term declines in gold. The harmonic support zone (4170-4175) coincides with the fundamental “pullback buying zone,” making it a high risk-reward long entry level.
GOOD LUCK!
LESS IS MORE!

Gold Holds Steady as Traders Position Ahead of Key Fed Outlook🔹 MARKET BRIEFING – XAU/USD (4H)
Market State:
– Price is holding above short-term support and consolidating sideways, with momentum still leaning toward the buyers.
Key Levels:
– Support: 4164
– Resistance: 4264
– Breakout Zone: 4300–4340
Next Move:
– Bullish momentum remains in control; a breakout above 4300 would open the path toward 4340 and 4380.

Market Landscape After the Fed Rate Cut !Gold Price Trend Analysis: Yesterday, gold opened higher and encountered resistance near 4219, then began to fluctuate downwards. During the European session, it fell to around 4187 before consolidating. Influenced by the Fed's interest rate decision, gold exhibited a pattern of rising first, then falling, and then rising again, reaching a low of around 4182 and a high of around 4239. The daily candlestick closed as a bullish candle. Logically, after this upward move, the subsequent target should be the 4255-4265 area. However, considering the current market trend, this tendency to rise more easily than fall is the most sustainable. We can actually see the upper limit, with the first high point at 4265, and at least for the current stage, we haven't reached the top yet.
Gold Technical Analysis: On the hourly chart, the moving averages are arranged in a bullish pattern, maintaining strong upward momentum. Technically, the bulls have broken through the neckline and are rising again. The price action shows a large bullish candle at the bottom, indicating strong upward momentum. The current high also coincides with the current cyclical pullback level, making a technical correction reasonable. Today, we expect the price to continue its upward trend after a pullback. Short-term support is around 4210-4200, a support/resistance level. Resistance is around 4255-4265. Avoid chasing highs, but the short-term bullish stance remains unchanged. Intraday trading should continue with a buy-on-dips strategy. In summary, today's gold trading strategy is to primarily buy on dips and secondarily sell on rallies. Key resistance is around 4255-4265, and key support is around 4210-4190. Please follow the trend closely.

gold await breakout#XAUUSD base on price movement and H4 past candle, we need retest above 4226-35 for sell to reverse back.
Await buy on valid breakout 4209.4, SL 4196, TP 4226-35
Below the rectangle on M15-30 closure price will fall back till 4175 or more.

XAUUSD 10Dec 2025 🔥 Gold (XAUUSD) Trade Plans | 30M Chart
- Pullback Short (Scalp):
Sell 4,212-4,219 | SL: 4,220 | TP: 4,190
- Main Long (Distribution): Buy 4,181-4,172 | SL: 4,163 | TP: 4,260
Smart Money Concepts: Targeting pullback into demand zone, then bullish distribution! 🚀
_Not financial advice._
#Gold #SMC #Trading"

XAU/USD NEXT MOVEGOLD NEXT MOVE...
Let me know what you think about my analysis in the comment section, and please hit boost and follow for more ideas.
Trading is not hard if you have a good coach! Thank you.

Gold price around 4200 - market waiting⭐️GOLDEN INFORMATION:
Gold Price (XAU/USD) trades in negative territory around $4,195 during the early Asian session on Tuesday. The precious metal edges lower amid concerns that the US Federal Reserve (Fed) will adopt a hawkish tone in its rhetoric, despite delivering a rate cut on Wednesday.
Markets widely expect a 25 basis points (bps) rate cut at the Fed’s December meeting, with traders seeing a 90% probability, up from about 66% in November, according to the CME FedWatch tool. Traders will closely monitor the press conference and a Summary of Economic Projections, or ‘dot-plot,’ for fresh impetus. If the US central bank delivers a "hawkish cut," this could support the US Dollar (USD) and weigh on the USD-denominated commodity price.
⭐️Personal comments NOVA:
Gold price adjusted down around 4200, market mainly sideways before December interest rate
⭐️SET UP GOLD PRICE:
🔥SELL GOLD zone: 4258 - 4260 SL 4265
TP1: $4245
TP2: $4230
TP3: $4215
🔥BUY GOLD zone: 4162 - 4160 SL 4155
TP1: $4175
TP2: $4190
TP3: $4200
⭐️Technical analysis:
Based on technical indicators EMA 34, EMA89 and support resistance areas to set up a reasonable BUY order.
⭐️NOTE:
Note: Nova wishes traders to manage their capital well
- take the number of lots that match your capital
- Takeprofit equal to 4-6% of capital account
- Stoplose equal to 2-3% of capital account

XAUUSDHello Traders! 👋
What are your thoughts on GOLD?
Gold continues to trade within a short-term ascending channel and is now approaching the upper boundary of this structure. This region also aligns with a major resistance zone formed by the previous swing high, creating a strong confluence area.
As price enters this resistance cluster, we expect selling pressure and a potential rejection. Based on the current momentum, it does not appear likely that gold will easily break above this zone in the short term.
Therefore, the more probable scenario is:
1-A pullback toward the lower boundary of the ascending channel
2- If the channel breaks to the downside, an extended decline toward the next key support level becomes likely
Don’t forget to like and share your thoughts in the comments! ❤️
