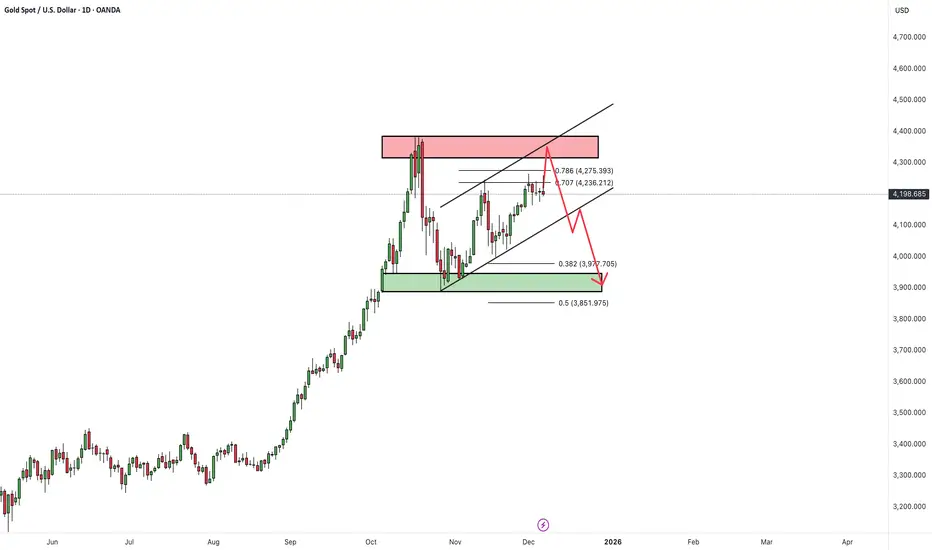
Gold Poised for Next Bullish WaveThe XAU/USD chart shows price holding above a strong support zone, with repeated retests indicating buyers are still active in this area. The market is respecting the upward trend structure, and each dip into the highlighted support region has triggered renewed bullish momentum. Price is also staying above the Ichimoku cloud, reinforcing the continuation of the upward bias. The recent candles suggest steady accumulation, and the drawn projection arrow highlights expectations for another push to the upside. As long as price remains above the support band, gold is likely to aim for higher levels. The next upside targets are 4255 as the first objective and 4290 as the extended move.
If you found this XAUUSD analysis helpful, don’t forget to LIKE 👍 and COMMENT 💬!
Trade ideas

GOLD → Positive fundamental background. Focus on 4200 FX:XAUUSD is testing the $4,250 level amid news momentum related to interest rate cuts. The fundamental backdrop is improving, with the dollar entering a downward trend...
The Fed cut rates by 25 basis points to 3.75%, as expected. Powell's tone was cautious rather than hawkish, which weakened the dollar and Treasury yields. The market expects two rate cuts next year, compared to one in the Fed's forecasts
- Focus has shifted to US employment data (jobless claims). The next key risk will be next week's NFP data.
The Fed's decision provided support for gold, but for growth above $4250, confirmation of a weakening labor market in upcoming reports will be needed. Technically, the focus is on the 4200-4220 zone.
Resistance levels: 4220, 4250, 4260
Support levels: 4200, 4180, 4175
Consolidation above 4200 will confirm the bullish sentiment, while a breakout and consolidation above 4220 will open up a new chance for growth towards the resistance of the range.
I do not rule out the possibility of a retest the support of the range at 4181 before moving up (the price is still in a sideways trend).
Best regards, R. Linda!

All you need to know: WHEN and WHERE (short giude)Most traders lose money not because they’re wrong about direction… but because they’re wrong about WHEN and WHERE direction actually matters.
This is the missing piece in 99% of trading strategies.
Let’s break it down simply and clearly.
1. WHERE Matters First: Price Location Defines the Entire Trade
The market is not equally important at all prices.
There are only a few places where decisions actually have consequences:
🔹 1. Major Higher-Timeframe Levels
- Daily, Weekly and even monthly support, resistance, supply, demand.
- This is where big players care.
- Most BIG moves begin here.
🔹 2. Volatility Compression Zones
- Tight ranges, triangles, squeezes, etc
- When volatility compresses, potential energy builds.
- Breakouts here actually matter.
🔹 3. Break-and-Retest Structures
- The retest is where confirmation happens.
- It’s where weak hands exit and smart money enters.
🔹 4. Trend Extremes / Overextensions
- Parabolic rallies, vertical drops, stretched momentum.
- These locations create the most powerful reversals.
🔹 5. Liquidity Pools
- Above swing highs, below swing lows, around obvious trendlines.
- Institutions hunt these levels before moving the market.
If you’re not trading at one of these five locations, you are trading noise.
2. WHEN Matters Even More: Timing Is the Difference Between Chop and Trend
Even the best location is useless if the moment isn’t right.
Here are the only timing conditions that give your trade real probability:
🔸 1. Volatility Expansion After Compression
- Wait for candles to elongate, volume to increase, and the range to open up.
- Before expansion: fakeouts.
- After expansion: real moves.
🔸 2. Liquidity Sweeps
- The market clears stops → fills institutional orders → reveals true direction.
- You don’t act before the sweep; you act after it confirms.
🔸 3. Structural Confirmation
- Higher low in an uptrend.
- Lower high in a downtrend.
- Break → Retest → Continuation.
- Without structure, timing is random.
🔸 4. Active Market Sessions
- London open, NY open, session overlaps, major news events.
- The same setup at 03:00 means nothing — the same setup at NY open is a trade.
🔸 5. Multi-Timeframe Momentum Alignment
- HTF gives the bias
- MTF gives the setup
- LTF gives the entry
- When timeframes align, timing becomes obvious.
3. WHERE + WHEN = Non-Random Trades
This is what professional trading really is:
- WHERE = the place price must react
- WHEN = the moment price has conviction
Combine both and you no longer predict — you simply respond to high-probability situations.
- This is how you avoid chop.
- This is how you avoid forcing trades.
- This is how you become consistent.
4. The Psychological Shift
Retail traders think:
“I must forecast the next move.”
Professionals think:
“I only act at key locations, when timing conditions align.”
This removes:
- FOMO
- guessing
- impulsive entries
- emotional trading
You no longer chase the market.
You wait for the market to come to your WHERE and your WHEN.
That’s the edge.
5. Final Thoughts
You don’t need to predict the market.
You don’t even need to know what happens next.
You only need to know:
- WHERE the market becomes important
- WHEN a move becomes meaningful
Master these two, and everything else falls into place.
P.S.
I know this is easier said than done. Even after many years in the market, with a solid sense of direction and plenty of sniper-level entries, my WHEN is not always perfect either. That’s the part none of us ever truly “master” — we only learn to manage it better.
So take all of this as a blueprint, not a declaration that I execute flawlessly. I’m a professional, yes — but I’m also in a continuous process of adapting, refining, and learning from every new shift the market throws at us.
Experience helps, but the market keeps evolving, and so do I. Just like anyone else should.

GOLD - Distribution phase. Target - ATH (4380), 4400...FX:XAUUSD is rallying after breaking through consolidation resistance. The fundamental background is positive, with the train heading for an all-time high.
Expectations of a soft Fed policy remain, with the market pricing in two rate cuts in 2026. India's pension fund regulator has allowed investments in gold and silver ETFs. An increase in US unemployment claims (+44,000) has heightened fears of a slowdown in the labor market.
A reversal in the Bank of Japan's policy (rate hike) and a pause by the ECB are boosting the appeal of gold.
Any correction is likely to be short-term and will be met with support from buyers. The baseline scenario remains bullish amid soft monetary policy and a weakening dollar.
Technically, it is dangerous to sell in the current market; it is worth looking for buying opportunities after corrections or pullbacks...
Resistance levels: 4325, 4335, 4380
Support levels: 4300, 4285, 4265
The rally phase is quite aggressive due to the long period of consolidation that the market has been in. All possible factors are supporting growth. In such a market, one can only buy on pullbacks. I expect a pullback from the indicated zone, within which growth to ATH can be considered.
Sincerely, R. Linda!

Gold - Bullish Structure Still Intact… Eyes on the Next Higher!!📈Gold remains overall bullish, consistently forming higher lows along its rising trendline. Every time price tapped the lower boundary of the structure, buyers stepped in aggressively, and we may be approaching that point again.
⚔️Price is currently hovering near a blue support zone, which aligns perfectly with the rising trendline. As long as this confluence holds, we will be looking for trend-following longs, targeting the upper resistance zone highlighted in beige.
🏹If buyers defend this area once again, Gold could be preparing its next impulsive leg upward.
Do you expect Gold to print another higher low here? Share your thoughts below 👇
⚠️ Disclaimer: This is not financial advice. Always do your own research and manage risk properly.
📚 Stick to your trading plan regarding entries, risk, and management.
Good luck! 🍀
All Strategies Are Good; If Managed Properly!
~Richard Nasr

Gold buy TARGET Gold (XAU/USD) shows consolidation above strong support at 4,170 with bullish momentum forming. A breakout is expected toward the 4,258 target zone.

GOLD 1H CHART ROUTE MAP UPDATE & TRADING PLAN FOR THE WEEKHey Everyone,
Please see our 1h chart levels and targets for the coming week.
We are seeing price play between two weighted levels with a gap above at 4306 and a gap below at 4270, as support. We will need to see ema5 cross and lock on either weighted level to determine the next range.
We will see levels tested side by side until one of the weighted levels break and lock to confirm direction for the next range.
We will keep the above in mind when taking buys from dips. Our updated levels and weighted levels will allow us to track the movement down and then catch bounces up.
We will continue to buy dips using our support levels taking 20 to 40 pips. As stated before each of our level structures give 20 to 40 pip bounces, which is enough for a nice entry and exit. If you back test the levels we shared every week for the past 24 months, you can see how effectively they were used to trade with or against short/mid term swings and trends.
The swing range give bigger bounces then our weighted levels that's the difference between weighted levels and swing ranges.
BULLISH TARGET
4306
EMA5 CROSS AND LOCK ABOVE 4306 WILL OPEN THE FOLLOWING BULLISH TARGETS
4334
EMA5 CROSS AND LOCK ABOVE 4334 WILL OPEN THE FOLLOWING BULLISH TARGETS
4362
EMA5 CROSS AND LOCK ABOVE 4362 WILL OPEN THE FOLLOWING BULLISH TARGETS
4395
EMA5 CROSS AND LOCK ABOVE 4395 WILL OPEN THE FOLLOWING BULLISH TARGETS
4430
BEARISH TARGETS
4270
EMA5 CROSS AND LOCK BELOW 4270 WILL OPEN THE FOLLOWING BEARISH TARGET
4231
EMA5 CROSS AND LOCK BELOW 4231 WILL OPEN THE FOLLOWING BEARISH TARGET
4184
EMA5 CROSS AND LOCK BELOW 4184 WILL OPEN THE SWING RANGE
4150
4102
As always, we will keep you all updated with regular updates throughout the week and how we manage the active ideas and setups. Thank you all for your likes, comments and follows, we really appreciate it!
Mr Gold
GoldViewFX

GOLD → Retest of upward trend support. Focus on 4200FX:XAUUSD is trading near $4,200, remaining cautious at the start of the week ahead of the Fed's decision. The trend is bullish, with the dollar stagnating. A long squeeze of support could trigger a rebound...
The Fed is expected to cut rates by 25 bps (probability ≈90%). Weak US data supports dovish expectations
Attention is shifting to the Fed meeting and its forecasts for 2026. The lack of important US data today shifts the focus to geopolitics and general market sentiment.
There is not much news this week, but from a geopolitical point of view, attention is focused on Japan-China and Russia-Ukraine-US relations.
Gold is awaiting signals from the Fed. The decision on rates and geopolitical news will determine the direction of the breakout from the current range.
Resistance levels: 4220, 4256
Support levels: 4200, 4195, 4180
The dollar previously broke through the support of the uptrend, but has been stagnating for the past few days. A break below 99.0 could trigger a decline in the index, which could support the price of gold.
Gold is testing the support of the trading range within the uptrend. Focus on the 4200-4195 zone. A long squeeze could trigger growth amid a weak dollar...
Best regards, R. Linda!

Clear Break & Retest: Gold Now Eyes a Push Toward $4,405Hello everyone, Helene here!
Right now, XAUUSD is a textbook example of a market trading inside a well-defined ascending channel, with price consistently respecting both the upper and lower boundaries of the structure.
We’ve just seen price break above a clear resistance zone and successfully retest it. This area also aligns with the “golden pocket” from the recent bullish leg, which makes it a highly critical zone to monitor. If this level continues to hold as support, it will act as a strong bullish structural confirmation, increasing the probability that price will extend toward 4,405, which is the upper boundary of the channel.
As long as price maintains above this support zone, the bullish setup remains valid. If not, then the short-term bullish outlook may be interrupted, potentially leading to a deeper corrective move.
Always remember to apply proper risk management.
Good luck, and trade safely.

XAUUSDHello Traders! 👋
What are your thoughts on GOLD?
Gold continues to trade within a short-term ascending channel and is now approaching the upper boundary, which aligns with a major resistance zone formed by the previous swing high. This creates a strong confluence area where sellers may become active.
As price enters this resistance cluster, we expect selling pressure and a potential rejection. Based on the current momentum, a clean breakout above this zone does not seem likely in the short term.
Most Probable Scenarios
1-A final upward push toward the upper boundary of the channel
2-A rejection from the resistance zone
3- A move back toward the lower boundary of the ascending channel
4- If the channel breaks to the downside, an extended decline toward the next key support level becomes likely
This week includes several high-impact events—most importantly:
The U.S. Federal Reserve interest rate decision,
which may significantly increase volatility in gold.
For now, it is recommended to stay patient and wait for price to reach clearer, low-risk zones before entering any trades.
Don’t forget to like and share your thoughts in the comments! ❤️
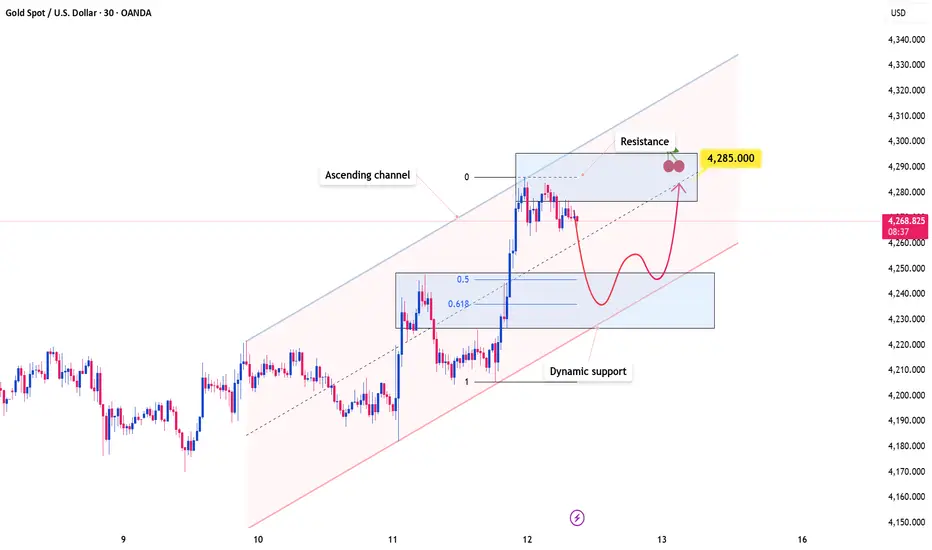
Gold Holds a High Ground While the Market Reprices RiskOANDA:XAUUSD continues to trade within a well-defined ascending channel, with price action consistently respecting both the upper and lower boundaries. This structure highlights strong bullish control, suggesting that buyers remain firmly in charge and that upside continuation is still favored.
Price has recently broken above a key resistance zone and may return to retest this level. If it holds as support, it would further validate the bullish structure and significantly increase the probability of a move toward the 4,285 target. This level aligns closely with the midline of the ascending channel as well as a previous resistance area, reinforcing its technical importance.
As long as price remains above this support zone, the bullish outlook stays intact. However, a failure to hold this level could weaken the current structure and open the door for a deeper pullback toward the lower boundary of the channel.
On the fundamental side, gold’s recent surge has been driven by an unexpected shift from the U.S. Federal Reserve toward monetary easing, including a return to bond purchases. This move pressured the U.S. dollar and effectively removed prior concerns over a prolonged hawkish policy stance, prompting renewed inflows into gold.
While short-term pullbacks remain possible due to overbought conditions, the broader trend continues to look constructive, supported by ongoing central bank buying and sustained demand for safe-haven assets.
XAUUSD Bullish Trend in Play — Path Open Toward 4,300 TargetHello traders! Here’s my technical outlook on XAU/USD (Gold) based on the current market structure. Gold remains in a broader bullish trend, supported by a clearly defined rising Trend Line that has guided price action since the beginning of the impulsive move. After the initial breakout from the Support Level, the market formed a well-structured range, followed by a corrective pullback and another consolidation phase, confirming healthy bullish rotation. Price is currently trading above the key Support Level near 4,140, while attempting to stabilize above the rising Support Line, which keeps buyers in control of the short-term structure. The recent breakout from the second range indicates renewed bullish momentum, with price now approaching the major Resistance Level around 4,260–4,270. As long as Gold holds above the support zone and respects the ascending trendline, the bullish scenario remains valid. The structure suggests continued pressure toward the upside, with TP1 positioned near 4,300, which aligns with the next key resistance area. A clean breakout above this level could open the door for further trend continuation and higher upside targets. However, a failure to hold the Support Line could lead to a deeper pullback toward the lower support zone. For now, the technical structure favors the buyers, with bulls aiming for a retest and breakout of the 4,260–4,300 resistance zone. Please share this idea with your friends and click Boost 🚀

THE KOG REPORTTHE KOG REPORT:
In last week’s KOG Report we said we would look for the price to tap into the lower level where we wanted a bounce to then target the red box above. We managed to get that long into the defence level for it to give us a nice tap and bounce again giving the short and following the path into the lower defence box. It’s here that we faced the range but as you can see we failed to breach the box, hence giving us that opportunity to target that long into the active defence above again.
We then mentioned we would protect and manage and see if there is another reaction or breach at that box, leading to price rejecting again following the range and completing all our targets as well as the hot spots for the week.
A successful week in Camelot not only on Gold but also the other pairs we trade and analyse.
So, what can we expect in the week ahead?
For the start of the trading week we have two key levels to keep an eye on, 4175 support and 4210 resistance. These are the levels that need to be broken either side in order to make the next move, and could be the range we play for Monday as there is no economical catalyst to bring the extra volume into the market.
For that reason, we’ll stick with the plan from last week, apart from looking for price to create that higher high before attempting the lower defence level.
There is strong support here on the close so if we can get an undercut low here we can bounce into that 4210 level and above that 4220 which is the level that will need to hold! As long as we can stay below, we should see price attempt the lower levels initially starting with our target level 4180 and below that 4155.
As you can see on our chart, our ideal long opportunity comes from the lower level which is also our potential target and a region we would like to see a RIP!
The levels are on the chart as our the red boxes which have proven to be effective for swing and intra-day trading.
RED BOXES:
Break above 4210 for 4220, 4230, 4235 and 4240 in extension of the move
Break below 4190 for 4180, 4173, 4165, 4155 and 4147 in extension of the move
Please do support us by hitting the like button, leaving a comment, and giving us a follow. We’ve been doing this for a long time now providing traders with in-depth free analysis on Gold, so your likes and comments are very much appreciated.
As always, trade safe.
KOG

Gold Holds Its Bullish StructureGold Holds Its Bullish Structure as Support Zone Proves Its Strength
From the analysis shared earlier this week, GOLD moved from 4194 to 4247 after retesting the support zone once again.
The chart clearly shows that this support area remains extremely strong, even during the volatility of the FOMC meeting.
Gold was rejected multiple times near the 4180 region, reinforcing the probability of a continued bullish wave.
As mentioned before, Gold has lost its traditional correlation with DXY and USD for quite some time. The market is driven heavily by speculation and manipulation, making GOLD a risky instrument.
However, as long as the price holds above the support zone and maintains its bullish structure, further upside remains possible.
You may find more details in the chart!
Thank you and Good Luck!
❤️PS: Please support with a like or comment if you find this analysis useful for your trading day❤️
✅ Previous analysis:

Gold 1H – Will 4232 Liquidity Trigger Reversal or 4188 Hold Flow🟡 XAUUSD – Intraday Smart Money Plan | by Ryan_TitanTrader (10/12)
📈 Market Context
Gold trades inside a politically-driven liquidity landscape after former U.S. President Donald Trump signaled that rate-cut willingness will be his litmus test for selecting a new Fed Chair.
This comment injects uncertainty into interest-rate expectations, making markets sensitive to any shifts in forward guidance.
Higher-for-longer fears remain intact intraday, keeping gold capped below premium zones while liquidity builds on both edges.
On H1, price is compressing around mid-range with clean liquidity resting at 4232 above and 4188–4190 below—ideal sweep conditions before institutions commit to direction.
🔎 Technical Framework – Smart Money Structure (1H)
Current Phase: Sideways compression after BOS + CHoCH sequence
Key Idea: Expect a sweep above 4230–4232 or below 4190–4188 before true displacement
Liquidity Zones & Triggers:
• 🔴 SELL GOLD 4230 – 4232 | SL 4240
• 🟢 BUY GOLD 4190 – 4188 | SL 4180
Institutional Flow Expectation:
sweep → MSS/CHoCH → BOS → displacement → FVG/OB retest → expansion
🎯 Execution Rules (matching your exact zones)
🔴 SELL GOLD 4230 – 4232 | SL 4240
Rules:
✔ Price sweeps the liquidity cluster above 4230
✔ Bearish MSS/CHoCH on M5–M15
✔ Downside BOS + clean bearish displacement
✔ Entry via FVG refill or refined OB retest
Targets:
1. 4212
2. 4200
3. 4190
🟢 BUY GOLD 4190 – 4188 | SL 4180
Rules:
✔ Liquidity grab under 4190–4188
✔ Bullish MSS/CHoCH confirms demand takeover
✔ Upside BOS + impulsive displacement from discount
✔ Entry via bullish FVG fill or demand OB retest
Targets:
1. 4205
2. 4220
3. 4230–4232
⚠️ Risk Notes
• Trump’s remarks may spark abrupt shifts in expectations → avoid entries without BOS + displacement
• Don’t chase candles inside the compression channel
• SL placement must respect structural invalidation
• Reduce exposure if volatility spikes during Fed-related headlines
📍 Summary
Today’s play revolves around two liquidity-driven scenarios:
• A 4232 sweep triggers bearish structure, delivering into 4200 → 4190
or
• A 4188 liquidity grab forms bullish MSS, expanding toward 4220 → 4232
Let structure confirm—SMC is reaction, not prediction. ⚡️
📌 Follow @Ryan_TitanTrader for more Smart Money breakdowns.

If you don’t know this pattern, you’ll miss out the main profits🌀 Complete Guide to Rounded Bottom and Rounded Top Patterns for Traders
The rounded bottom and rounded top patterns are among the most reliable reversal patterns in technical analysis. They form gradually and usually indicate a major trend reversal in the market.
🔵 Rounded Bottom Pattern
📌 Definition
A rounded bottom forms when the price gradually declines and then slowly starts to rise.
This pattern looks like a large U-shape or semicircle.
📌 Nature of the Pattern
Downtrend → exhausted
Sellers → weakening
Buyers → gradually entering
📌 Key Features
1️⃣ Gradual Formation
Unlike double bottoms or twin peaks that form quickly, this pattern takes time.
2️⃣ Gradual Volume Decrease
Volume decreases at first
Lowest volume occurs in the middle
Volume rises again as the price recovers
⚠️ In low-volume markets (e.g., some crypto assets), be cautious.
3️⃣ No Sharp Candlestick Shadows
Candles usually have smooth and steady movement.
4️⃣ Curved Path
The price moves along a curved trajectory.
🔍 How to Identify a Rounded Bottom
The prior trend must be downward. Without a preceding downtrend, the pattern is meaningless.
Candles should start from a point and move with low volatility, indicating a “tired” market.
The middle of the pattern has lowest price fluctuation and volume, like the bottom of a bowl.
After the midpoint, candles gradually become larger and buyers gain strength.
If a curved line is drawn, the price should not break it; otherwise, the pattern is invalid.
🔵 Rounded Top Pattern
Same as the rounded bottom, but in reverse.
Prior trend: uptrend
Buyer enthusiasm decreases
Price gradually reverses
Price begins to decline
🎯 Best Timeframes
H1, H4, D1
Smaller timeframes (1m, 5m, 15m) are noisy and can produce false breakouts.
🧠 Entry Points (Trading Setup)
1️⃣ Entry after Breakout (Safer)
Rounded Bottom: draw a resistance line at the highest peak on the right → enter when candle closes above it.
Rounded Top: draw a support line → enter short after a confirmed breakout.
2️⃣ Entry on Pullback (Lower Risk + Higher Reward)
Wait for the price to pull back after the breakout
Enter after confirmation of the reversal
🛑 Stop Loss
Rounded Bottom: below the center or lowest point on the right
Rounded Top: above the center or highest peak on the right
🎯 Take Profit
Set the target equal to the height of the pattern from the breakout point.
Subsequent targets can be set at next support/resistance levels.
✔️ Psychological Aspect on Chart
Rounded Bottom: 🟢 from despair to hope
Rounded Top: 🔴 from euphoria to selling pressure
🎯 Professional Confirmation Filters
Positive divergence in rounded bottom
Negative divergence in rounded top
Volume increase after breakout
Strong breakout candle
⚠️ Common Mistakes
Using very small timeframes → fractal patterns look like rounded but are false
Entering before breakout → most common cause of losses
Drawing wrong curve → sharp spikes or shadows invalidate the pattern
Ignoring volume → shallow markets (e.g., small altcoins) can distort the pattern
📌 Golden Rule for Traders
Rounded Bottom → signals the start of a long-term uptrend
Rounded Top → signals a correction or temporary decline
✅ Best practice: enter at the breakout point and ride the main trend

XAUUSD: Bulls Hold Structure - Targeting 4,300 Resistance RetestHello everyone, here is my analysis of the current XAUUSD setup.
Market Analysis
XAUUSD is trading within a broader ascending structure, supported by a well-defined trend line that continues to drive the market upward. Recent price action shows several successful breakouts from previous consolidation zones, confirming sustained bullish pressure. After an extended period of ranging, buyers regained control and pushed the market higher, respecting the overall upward trajectory.
Currently, price is moving within a narrowing formation defined by an upper resistance line and a lower support line. This developing wedge formation suggests that bullish momentum remains intact, but the market is consolidating before its next significant move. The 4,170 support zone continues to serve as a key demand area, where buyers previously stepped in and defended the bullish trend. On the other hand, the 4,300 resistance zone limits the upside and remains the primary barrier for buyers. Overall, the structure indicates that the market maintains a bullish bias as long as price stays above the support line and holds above the 4,170 support level.
My Scenario & Strategy
My scenario remains bullish as long as XAUUSD trades above the 4,170 support zone and continues to respect the rising support line within the current formation. I expect the price to attempt another move toward the 4,300 resistance zone, which aligns with the upper boundary of the wedge structure. A strong breakout above 4,300 would confirm bullish continuation and could open the path for further upward expansion.
However, if the price fails to hold the support line and breaks below the 4,170 level with clear momentum, the bullish scenario would be invalidated, potentially signaling the start of a deeper corrective phase. For now, the market structure favors a long bias, with focus on a potential movement toward the 4,300 resistance area.
That is the setup I am currently monitoring. Thank you for your attention, and as always — manage your risk!

GOLD 4H CHART ROUTE MAP UPDATE & TRADING PLAN FOR THE WEEKHey Everyone,
Please see our 4h chart remaining levels and targets for the coming week with one updated Goldturn.
We are now seeing price play between two weighted levels with a gap above at 4222 and a gap below at 4124. We will need to see ema5 cross and lock on either weighted level to determine the next range.
We will see levels tested side by side until one of the weighted levels break and lock to confirm direction for the next range.
We will keep the above in mind when taking buys from dips. Our updated levels and weighted levels will allow us to track the movement down and then catch bounces up.
We will continue to buy dips using our support levels taking 20 to 40 pips. As stated before each of our level structures give 20 to 40 pip bounces, which is enough for a nice entry and exit. If you back test the levels we shared every week for the past 24 months, you can see how effectively they were used to trade with or against short/mid term swings and trends.
The swing range give bigger bounces then our weighted levels that's the difference between weighted levels and swing ranges.
BULLISH TARGET
4222
EMA5 CROSS AND LOCK ABOVE 4222 WILL OPEN THE FOLLOWING BULLISH TARGET
4328
EMA5 CROSS AND LOCK ABOVE 4328 WILL OPEN THE FOLLOWING BULLISH TARGET
4422
EMA5 CROSS AND LOCK ABOVE 4422 WILL OPEN THE FOLLOWING BULLISH TARGET
4494
BEARISH TARGETS
4131
EMA5 CROSS AND LOCK BELOW 4131 WILL OPEN THE FOLLOWING BEARISH TARGET
4042
EMA5 CROSS AND LOCK BELOW 4042 WILL OPEN THE SWING RANGE
3964
3873
As always, we will keep you all updated with regular updates throughout the week and how we manage the active ideas and setups. Thank you all for your likes, comments and follows, we really appreciate it!
Mr Gold
GoldViewFX

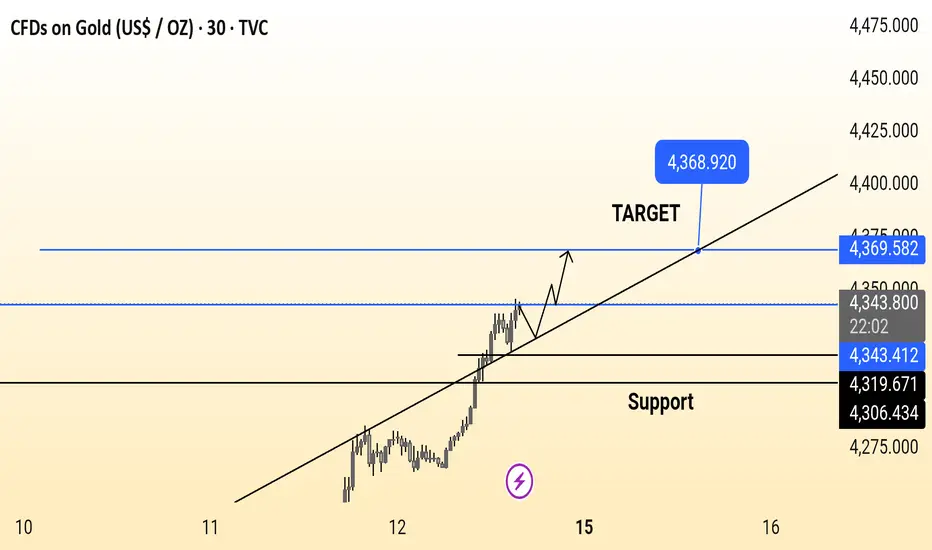
GoldGold is trending upward on the 30-minute chart, holding above support and following an ascending trendline. Price is expected to continue its bullish move toward the target zone around 4,368–4,370, as long as it stays above the key support levels.
THE KOG REPORT - UpdateEnd of day update from us here at KOG:
Not a bad start to the week with price following our path and red boxes to pave it's way into our target levels as well as giving buyers opportunity to get that long trade into the immediate EXC target which is now complete.
Now, with FOMC tomorrow we would expect this to want to hover around here and attempt the lower support levels which stand at 4002 and below the 4195. 4190 is the key level and price needs to stay above that to continue higher. A break below will confirm the move for us.
For us, the plan is working so we'll stick with it.
As always, trade safe.
KOG

XAUUSD: The Uptrend Is Gaining Momentum AgainGold traded cautiously yesterday as investors waited for this week’s FOMC meeting. But this very “quiet phase” is building the foundation for a new upward leg, as the fundamental factors still lean strongly toward the Bulls.
1. The Fed Is Nearing a Policy Shift – A Direct Boost for Gold
Lower interest rates are always a key catalyst for gold because the metal does not generate yield. When yields fall, gold immediately becomes more attractive. The market is now almost fully pricing in a potential rate cut from the Fed in early 2025 – a powerful driver for the medium-term uptrend.
2. Central Banks Continue to Buy – A Strong and Steady Support
Despite short-term pullbacks, central bank demand remains consistently strong. These institutions are long-term players, and their continued accumulation helps gold maintain its bullish tone across the entire market.
3. Geopolitical Tensions Stay Elevated – Gold Remains Well Supported
The unified support from the leaders of France, Germany, and the UK for Ukraine in London shows tensions are far from easing. Rising instability → more reasons for gold to stay strong.
4. Technical Outlook
Price is reacting around the strong resistance at 4250, but there is still no significant selling pressure.
Ichimoku shows Kumo providing solid support, with price staying above the cloud – confirming the dominant uptrend.
Current buy setup remains very reasonable:
SL: around 4173
TP: targeting 4253–4260
If price gives a mild retest and bounces, the probability of breaking above 4250 is very high.
Conclusion: The Trend Remains BULLISH
With supportive macro fundamentals + strong technical structure, XAUUSD continues to hold a clear bullish formation. As long as the Fed does not sound too hawkish, gold could easily break above 4250 and head toward higher levels in the coming days.

Gold 1H – Will 4210 Reject Again or 4166 Ignite the Rally?🟡 XAUUSD – Intraday Smart Money Plan | by Ryan_TitanTrader (09/12)
📈 Market Context
Gold continues to soften under $4,200 as rising US Treasury yields pressure bullion, with markets positioning ahead of the upcoming Federal Reserve rate decision.
According to FXStreet, yields climbing intraday are capping gold’s upside, and sellers remain active below 4200 while participants wait for clarity on the Fed’s forward guidance.
This environment builds a liquidity-sensitive landscape, where institutions may engineer sweeps on both sides before committing to direction.
On H1, price oscillates cleanly between premium supply (4208–4210) and discount demand (4168–4166).
A valid push requires MSS → BOS → displacement from either extreme.
🔎 Technical Framework – Smart Money Structure (1H)
Current Phase: Sideways compression after consecutive CHoCH shifts
Key Idea: Expect liquidity grabs above 4210 or under 4166 before real movement
Liquidity Zones & Triggers
• 🔴 SELL GOLD 4208 – 4210 | SL 4218
• 🟢 BUY GOLD 4168 – 4166 | SL 4158
Institutional Flow Expectation:
sweep → MSS/CHoCH → BOS → displacement → FVG/OB retest → expansion
🎯 Execution Rules (matching your exact zones)
🔴 SELL GOLD 4208 – 4210 | SL 4218
Rules:
✔ Price taps premium zone (4208–4210)
✔ Bearish MSS/CHoCH confirmed on M5–M15
✔ Strong downside BOS + displacement
✔ Enter on FVG fill or refined supply OB retest
Targets:
1. 4185
2. 4175
3. 4168 – 4166
🟢 BUY GOLD 4168 – 4166 | SL 4158
Rules:
✔ Sweep under 4167 to collect sell-side liquidity
✔ Bullish MSS/CHoCH forms from discount
✔ Clean BOS + impulsive displacement upward
✔ Entry via bullish FVG fill or demand OB retest
Targets:
1. 4184
2. 4200
3. 4210
⚠️ Risk Notes
• Rising yields may generate deceptive spikes—avoid entries without BOS + displacement
• Do not chase price inside the compression range
• Keep SLs at structural invalidation, not arbitrary points
• Reduce exposure ahead of Fed-related volatility this week
📍 Summary
Today’s setup revolves around two institutional scenarios:
• A 4210 liquidity sweep triggers bearish structure → downside delivery toward 4166
or
• A 4166 liquidity grab forms bullish MSS → upside expansion back toward 4210
Let structure confirm.
Patience pays the trader—SMC reacts, never predicts. ⚡️
📌 Follow @Ryan_TitanTrader for daily Smart Money breakdowns.

Gold Range: The Longer It Holds, the Harder It BreaksAs you already know, I’m not the type of guy who writes the classic “if it’s not up, it must be down.” But with Gold stuck in this painfully 4180–4240 range, it’s almost impossible to craft a proper swing trading outlook.
The market has been trapped here since December 1st, and the longer the price stays here, the more violent the eventual breakout will be, at least this is sure.
Yesterday was a perfect illustration of indecision: Gold spent the entire session glued to 4200, and even the FED couldn’t shake it loose. As I’m writing this, price has returned right into the middle of the range — the exact place where no trader with longer-term intentions (2-3 days) wants to take a position.
That said, even if I don’t have a preferred scenario , I do have BIAS , and that bias is bearish.
If Gold slips back toward 4190, I’ll look to sell in anticipation of a breakdown.
After two weeks of range trading, the next impulsive move should have distance — and I’m targeting at least 1,000 pips to the downside once the range finally gives way.
Ohhh, yeah, if it breaks 4250 then it's up:)
