Gold prices rose at the beginning of the week: 4366⭐️GOLDEN INFORMATION:
Gold (XAU/USD) pushes to fresh seven-week highs above $4,325 during Asian trading on Monday, extending its bullish momentum amid growing conviction that the US Federal Reserve will pivot toward rate cuts next year. Expectations of a lower interest-rate environment continue to compress the opportunity cost of holding non-yielding assets, providing a solid fundamental tailwind for the yellow metal. In addition, elevated uncertainty and risk-off dynamics are underpinning safe-haven demand, further reinforcing gold’s upside bias.
That said, recently hawkish commentary from Fed officials poses a near-term headwind, as it could offer renewed support to the US Dollar (USD) and cap gains in USD-denominated commodities. Market participants will look for additional direction from upcoming remarks by Fed Governor Stephen Miran and New York Fed President John Williams later on Monday.
⭐️Personal comments NOVA:
The market remains very positive - price increase above 4300. The upside target is 4366.
⭐️SET UP GOLD PRICE:
🔥SELL GOLD zone: 4366 - 4368 SL 4373
TP1: $4350
TP2: $4335
TP3: $4320
🔥BUY GOLD zone: 4267 - 4265 SL 4260
TP1: $4280
TP2: $4295
TP3: $4310
⭐️Technical analysis:
Based on technical indicators EMA 34, EMA89 and support resistance areas to set up a reasonable BUY order.
⭐️NOTE:
Note: Nova wishes traders to manage their capital well
- take the number of lots that match your capital
- Takeprofit equal to 4-6% of capital account
- Stoplose equal to 2-3% of capital account
Market insights

XAUUSD: Bearish Drop to 3885?OANDA:XAUUSD is eyeing a bearish reversal on the daily chart , with price testing resistance near ATH levels after recent rebounds from support, converging with cumulative sell liquidation and a potential entry zone that could spark downside momentum if sellers defend the highs. This setup suggests a pullback opportunity amid the ongoing uptrend, targeting lower support levels with strong risk-reward exceeding 1:3.
Entry between 4280–4340 for a short position (entry from current levels with proper risk management is recommended if price reaches the zone). Target at 3885 . Set a stop loss at a close above 4400 , yielding a risk-reward ratio of more than 1:3 . Monitor for confirmation via a bearish candle close below entry with rising volume, leveraging gold's volatility near peaks.🌟
Fundamentally , gold prices are hovering around $4,207–$4,222 per ounce as of December 3, 2025, after a 0.5% daily gain and a 7.37% rise over the past month, driven by safe-haven demand amid geopolitical tensions and expectations of Fed rate cuts. However, forecasts for 2025 suggest potential volatility with upside to new highs like $4,000+ in the longer term, though short-term corrections could emerge due to overbought conditions, central bank policies, and inflation dynamics. 💡
📝 Trade Setup
🎯 Entry (Short):
4280 – 4340
(Entry from current levels is valid if price reaches the zone with strict risk management.)
🎯 Target:
• 3885
❌ Stop Loss:
• Daily close above 4400
⚖️ Risk-to-Reward:
• >1:3 overall
💡 Your view?
Will gold reject this ATH resistance zone for a deeper correction — or break higher into new territory?
👇 Share your thoughts below! 👇

GOLD will Bounce Back - and Break new HighsGOLD will act as SILVER and break New Highs.
Watch it bounce back and test the ATH again.
ISA It will break it

XAUUSD 10Dec 2025 🔥 Gold (XAUUSD) Trade Plans | 30M Chart
- Pullback Short (Scalp):
Sell 4,212-4,219 | SL: 4,220 | TP: 4,190
- Main Long (Distribution): Buy 4,181-4,172 | SL: 4,163 | TP: 4,260
Smart Money Concepts: Targeting pullback into demand zone, then bullish distribution! 🚀
_Not financial advice._
#Gold #SMC #Trading"

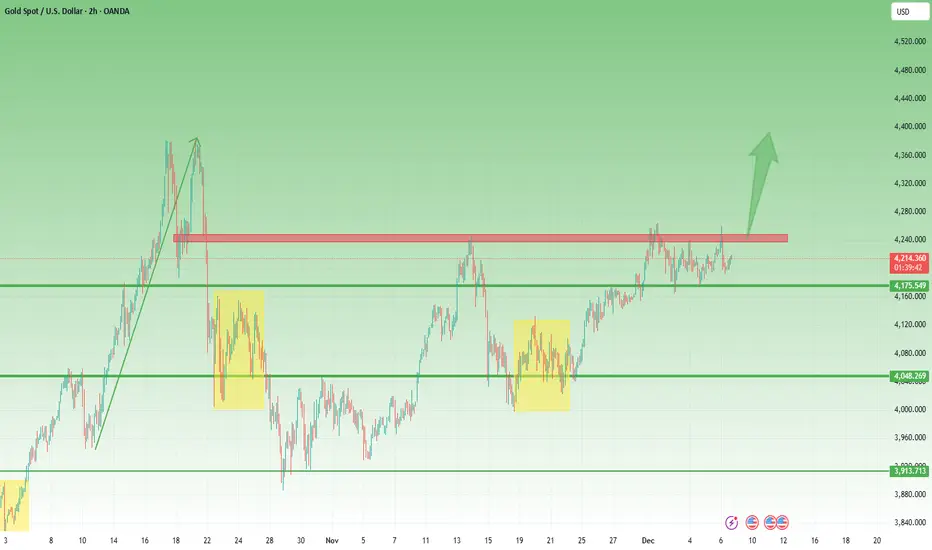
4250–4180: The Box Controlling GoldDespite a week filled with major fundamental releases, gold spent the entire period trapped inside a 4250–4180 range.
Even Friday’s strong early rally into 4250 failed to hold, with the daily close producing a sharp sell-off that left traders without a clear directional bias.
Today’s Asian session opened with renewed buying interest, lifting price back toward 4220, the midpoint of the range. But without a decisive breakout, the medium-term direction remains unclear.
Technically, both the medium-term and long-term trends are still bullish. However, as long as price remains locked inside this range, taking trades carries elevated risk.
What I want to see next:
Bullish scenario:
A fresh attempt to break above resistance, followed by either a clean breakout or a tight consolidation right below it — a classic pressure-building structure.
Bearish scenario:
A breakdown below 4175–4180, which could open the door for a move back toward 4100 or even lower.
Until we get clarity, I remain on the sidelines.
GOLD at cut n reverse Level? What's next??GOLD - perfect move as per our last idea regarding Xauusd and now market have single supporting area that is around 4305-06
keep close it because that is our key level now n holding of that area can create a further bounce.
stay sharp
NOTE: we will go for cut n reverse below 4305.
good luck
trade wisely

The upward momentum is strong. Buy on a slight pullback.The number of Americans filing for unemployment benefits recorded its largest weekly increase, suggesting that the job market may be facing new pressures. In addition, the Federal Reserve announced the reappointment of all 11 regional Fed presidents, a move that helped alleviate market concerns about uncertainty surrounding senior personnel appointments.
Influenced by this news, the precious metals market strengthened in tandem, with international gold prices reaching a high of $4286, a 1.22% increase on the day; silver prices reached a high of $64.3, a 2.79% increase.
Gold closed strongly in the US session, especially with a significant surge in the final moments, which typically suggests that the upward momentum is likely to continue in the last trading session of the week.
Currently, a move above $4300 for gold prices seems highly probable, and it may even challenge the previous high near $4381. Quaid recommends a buy-on-dips strategy for the short term. After breaking out of the previous trading range, the short-term technical structure of gold remains strong. The key focus should be on whether a slight pullback will lead to a challenge of the previous high. If buying momentum continues to strengthen, the upside potential remains considerable.
Gold prices have broken strongly out of their trading range, and the previous resistance level of 4260 has now become a key support. As long as the price remains above 4260, it can be considered a strong bullish trend, and this level can be used as a reference for short-term entry points. I will update more trading information in the channel.

GOLD Strong Bullish Bias! Buy!
Hello,Traders!
GOLD is trading in a strong uptrend and the players are now accumulating volume in a range structure, so we are waiting for a breakout which will be a sign of a further bullish continuation. Time Frame 12H.
Buy!
Comment and subscribe to help us grow!
Check out other forecasts below too!
Disclosure: I am part of Trade Nation's Influencer program and receive a monthly fee for using their TradingView charts in my analysis.

XAUUSD 📊 GOLD UPDATE — Key Levels in Focus! 🔥
Gold is reacting from a significant zone, and current structure suggests a possible move toward the upside if price holds above support. Market reaction near these levels will define the next direction.
📌 Trade Levels:
• 🔓 Entry: 4277
• ❌ Stop Loss: 4244
• 🎯 Target: 4301
Price behavior near resistance will be important — confirmation and risk management matter.
💬 What’s your bias from here — continuation or pullback?
👍 Like & comment to support the idea and share your perspective.
⚠️ Disclaimer: This analysis reflects personal market observation and is shared for informational purposes only.

XAUUSD Update GOLD RETEST ATHLast week, we could see that the gold price had retested the ATH area and was rejected at the 4350 level.
What will the price movement do at the end of this year?
It's most likely that the gold price will retest its support area before resuming its upward movement.
Below area...we have 4200 support, 4180 support and also 4170 support ( Weekly Support ).
Let see, which area will be retest.
Becareful and have a blessing week ahead !

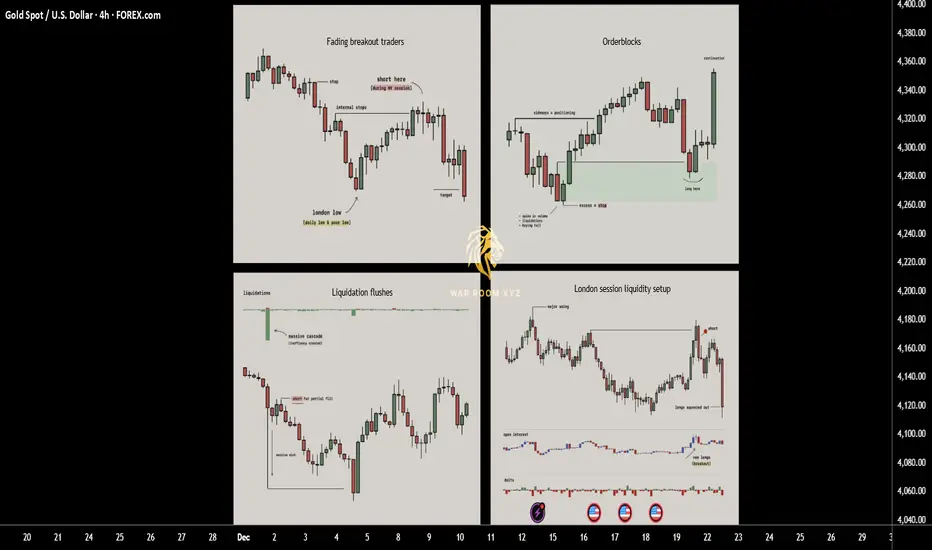
How Price Really Moves: 4 Entry Triggers Driven by LiquidityThis breakdown explains four recurring entry triggers that appear consistently across real market structure.
These are not indicators and not prediction tools. They are observable behaviors driven by liquidity, positioning, and trader psychology.
Each trigger is rooted in why price moves, not what price might do next.
1. Fading breakout traders (Failed Momentum / Trap Model)
When price breaks a key level and open interest jumps, breakout traders rush in expecting continuation. If price quickly snaps back, those new traders become trapped and their exits fuel a move in the opposite direction. This creates one of the cleanest reversal triggers since you are trading directly against failed momentum.
► What usually happens
Markets frequently approach obvious highs, lows, or range boundaries where:
•Retail breakout traders anticipate continuation
•Algorithms and short-term momentum systems enter aggressively
•Open interest or volume often expands rapidly
At this moment, new positions are created late , directly into resistance or support.
► The key failure
If price:
•Breaks a key level
•Fails to hold acceptance beyond it
•Quickly closes back inside the prior range
Then the breakout has failed structurally.
This means:
•Buyers who entered above resistance are now trapped
•Sellers who entered below support are trapped
•Their exits (stops + panic closes) become fuel for the opposite move
► Why this works
Markets move efficiently when traders are positioned correctly.
They move violently when traders are positioned incorrectly.
A failed breakout converts hope-based positions into forced exits.
► Educational takeaway
You are not trading the level,
you are trading the failure of belief at the level.
This is why failed breakouts often produce:
•Fast reversals
•Clean directional candles
•Strong continuation after rejection
2. Liquidation flushes (Forced Exit & Rebalance Model)
Sharp liquidation events create long wicks and temporary price inefficiencies. Markets tend to rebalance after these shocks as liquidity returns, which is why these wicks often get filled quickly. This setup works well in volatile phases and near exhaustion points where forced selling or buying pushes price too far.
► What a liquidation flush is
A liquidation flush occurs when:
•Price moves aggressively in one direction
•Overleveraged positions are forcibly closed
•Stops and liquidations cascade simultaneously
This often creates:
•Long wicks
•One-sided impulsive candles
•Temporary price inefficiencies
Importantly, this move is not driven by new conviction, but by forced exits.
► What happens after
Once forced liquidations are complete:
•Selling or buying pressure rapidly decreases
•Liquidity returns to the market
•Price frequently retraces part or all of the wick
This retracement is not random
it is the market rebalancing after stress.
► Where flushes matter most
Liquidation flushes are most meaningful when they occur:
•Near prior highs/lows
•At range extremes
•After extended directional moves
•During high-volatility sessions
► Educational takeaway
A liquidation wick does not mean “strong trend”.
It often means the move is temporarily exhausted.
You are not trading momentum,
you are trading the absence of remaining pressure.
3. Orderblocks
Orderblocks are zones where previous heavy participation occurred, usually during sideways movements before a strong move away. When price revisits these levels, the same participants often defend the area, creating reliable reaction points. Clean pivots with no messy wicks are the strongest since they signal clear institutional activity.
► What an orderblock represents
Orderblocks are areas where:
•Large participants accumulated or distributed positions
•Price moved sideways briefly
•A strong directional move followed immediately after
This sideways phase exists because large players cannot enter all at once without moving price against themselves.
► Why orderblocks matter
•When price returns to these zones:
•Previous participants may still be active
•Unfilled orders may remain
•Defensive reactions are more likely than random continuation
Clean orderblocks typically show:
•Tight consolidation
•Minimal wicks
•Strong departure afterward
Messy structures often indicate mixed participation and weaker reactions.
► How orderblocks are used
Orderblocks are reaction zones , not signals.
They provide:
•Logical areas to expect interest
•Defined risk zones
•Context for entry triggers like wicks or failed breaks
► Educational takeaway
Orderblocks work because institutions remember their prices , even if retail traders forget them.
You are trading where participation previously mattered, not arbitrary support or resistance.
4. London session liquidity setup
London frequently sets the daily low or high early in the session. Later in the day price often returns to sweep internal liquidity around that level before continuing the trend. This repeatable behavior offers structured entries based on predictable liquidity grabs tied to session mechanics.
► Why London matters
The London session is:
•One of the highest liquidity windows globally
•Often responsible for setting the initial daily structure
•Heavily watched by institutions and algorithms
In many markets, London establishes:
•The daily high
•The daily low
Or a key internal liquidity level early in the session
► The repeatable behavior
Later in the day (often London continuation or New York):
•Price returns to that London high or low
•Sweeps internal liquidity around it
•Rejects after stops are collected
•Continues in the higher-timeframe direction
This is not coincidence,
it is session-based liquidity engineering.
► Why it works
Institutions prefer:
•Liquidity-rich entries
•Known pools of resting stops
•Session transitions for execution
London levels provide exactly that.
► Educational takeaway
Sessions are not just time zones,
they are liquidity cycles.
Understanding when liquidity is created is just as important as where.
How These Triggers Fit Together
These models are not standalone strategies.
They are contextual tools.
Very often:
•A London sweep causes a liquidation wick
•A failed breakout forms at an orderblock
•A liquidation flush completes a failed momentum move
The strongest setups occur when multiple triggers overlap , but each can stand alone as a learning framework.
Why These Triggers Work Long-Term
They work because they are based on:
• Trader positioning
• Forced behavior (stops, liquidations)
• Institutional execution constraints
• Repeating session mechanics
They do not rely on:
•Indicator crossovers
•Lagging calculations
•Pattern prediction
Price moves because someone is forced to act.
These triggers show where and why that happens.
These 4 triggers work because they exploit trapped traders, forced liquidations and consistent liquidity patterns rather than relying on indicators. Keep them simple, wait for clean context and let the setups come to you.
Note
These concepts are:
•Descriptive, not predictive
•Contextual, not mechanical
•Dependent on execution skill and risk management
The goal is not to trade more,
it is to wait for situations where the market gives you an advantage.
I have made a script which might help identify all 4 triggers.
Disclaimer
The script is provided for educational and informational purposes only.
It does not constitute financial advice, investment advice, or a recommendation to buy or sell any instrument.
The script does not execute trades, manage risk, or replace the need for trader discretion. Market behavior can change quickly, and past behavior detected by the script does not ensure similar future outcomes.
Users should test the script on demo or simulation environments before applying it to live markets and must maintain full responsibility for their own risk management, position sizing, and trade execution.
Trading involves risk, and losses can exceed deposits. By using the script, you acknowledge that you understand and accept all associated risks.
XAUUSD – Buyers Remain in ControlHello everyone, it’s great to see you again.
Today, the gold market continues to test the new support area around USD 4,300 per ounce and is attracting mild bullish momentum as the U.S. labor market remains relatively stable but shows early signs of slowing. Bearish sentiment toward the U.S. dollar, driven by the Federal Reserve’s accommodative monetary policy, combined with ongoing risk-off sentiment, is providing positive support for the precious metal.
At the time of writing, gold is up around USD 20 from the session low. In the short term, OANDA:XAUUSD maintains a mild bullish trend, with key support levels located at USD 4,270 and USD 4,300.
I remain optimistic in this analysis, with the first upside target at the USD 4,350 resistance level, followed by a potential push toward the record zone around USD 4,375.
And you - what’s your view on gold at this stage?

Gold Is Loading the Final Break — $4,500 Is No Longer a StretchMARKET BRIEFING – XAU/USD (4H)
Market State:
– Gold remains in a strong bullish structure on H4, trading well above key EMAs and holding higher highs. Momentum is intact; the recent pause is consolidation, not distribution.
Key Levels:
– Primary Support: 4,250 – 4,260 (EMA cluster / structure base)
– Immediate Resistance: 4,370 – 4,380
– Expansion Zone: 4,420 – 4,450
– Upside Objective: 4,500 (New ATH zone)
Price Action Read:
– Pullbacks are shallow and quickly absorbed, indicating active dip buying.
– Structure shows a stair-step advance with brief pauses before continuation — typical of a trend-strength phase.
Next Move:
– Holding above 4,260 keeps the bullish roadmap intact. Acceptance above 4,380 opens room for range expansion toward 4,450–4,500. Any dip into support is a continuation opportunity, not a reversal signal.

XAU/USD) bullish trend analysis Read The captionSMC Trading Point
Technical analysis of Gold (XAUUSD) 1-hour chart shows a bullish "SMC" (Smart Money Concept) analysis with these key points:
1. Structure: Price breaks out of an ascending channel and forms a consolidation zone (blue shaded area). The breakout suggests potential continuation upward.
2. EMAs
- EMA(200) is at 4,222.79.
- EMA(50) is at 4,270.71.
- Price (4,299.91) is above both EMAs, indicating bullish momentum.
3. Fibonacci levels:
- 0.62, 0.705, and 0.79
retracement zones are marked for potential support.
4. Entry: Long position considered after breakout above the consolidation, with price aiming for the "target point" around 4,355.40.
Mr SMC Trading Point
5. Target: Upside target set at ~4,355.40, offering roughly a 1.3% move from current price.
6. Stop Loss: Place below the support zone (near 4,270 or EMA 50) to manage risk.
7. Confirmation: Look for strong bullish candles or volume spike post-breakout to validate the move.
Please support boost this analysis

Gold: Momentum Has Shifted - But Is This the Real Move?Gold has transitioned into a strong expansion phase after an extended period of consolidation, with price now showing clear directional intent. The recent structure suggests momentum is building rather than fading, often seen when the market begins to reprice expectations rather than react to short-term headlines.
This kind of price behavior typically reflects underlying strength, but pauses and minor rotations along the way remain part of a healthy sequence. The coming sessions will be key in determining whether this move develops into sustained continuation or evolves into a broader rebalancing phase.
**Disclosure:** We are part of Trade Nation's Influencer program and receive a monthly fee for using their TradingView charts in our analysis.

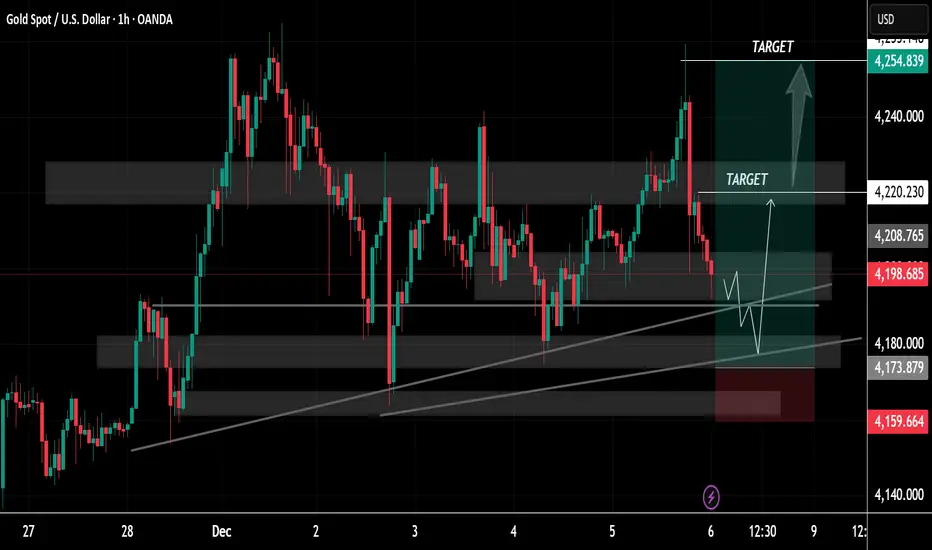
Gold Price Update – Clean & Clear Explanation✅ Gold where the market has been moving inside repeated zones of support and resistance. You can clearly see that price has been bouncing between these grey areas, which act like barriers that stop the market from moving too far in one direction without a reaction.
🤙At the right side of the chart, the price is currently pulling back from a recent high and dropping toward an important support region near 4,180 – 4,173, which has been tested several times in the past. This zone sits right above two rising trendlines, showing that buyers have been stepping in every time price moves down to these upward-sloping lines. Because of this, the chart suggests that the market may give a bullish reaction once again when it reaches this lower area.
⭕The drawing on the chart shows that price might first dip slightly below its current level, touch the trendline support, and then bounce upward with strength. If the market follows this path, the first target for the move is the mid grey zone around 4,220, which has acted as a key supply and demand level. If buyers manage to break through this zone, the next larger target lies higher around 4,254, which is marked as the final take-profit area for the potential bullish swing.
⭕The overall idea shown in the chart is that the market is still respecting an upward structure. As long as price stays above the trendlines and the support levels below, the suggested trade setup is a buy from the lower zone, aiming for the mid-range resistance and finally the upper target. The plan also hints that a deeper drop below 4,159 would invalidate the bullish expectation and act as a stop-loss area.
⭕If you find it helpful please and comments for this post and share thanks.
XAUUSD Holds Bullish Structure - Resistance at $4,380 in FocusHello traders! Here’s my technical outlook on XAUUSD (Gold) based on the current chart structure. After a corrective phase, Gold established a solid base and transitioned into a bullish recovery, forming higher lows and respecting the rising Support Line. The price previously moved through a consolidation Range, where accumulation took place before a clear breakout confirmed renewed buying momentum. Following this breakout, XAUUSD continued to trade within an ascending channel, showing a well-structured bullish trend. Recently, price pulled back into the Buyer Zone around 4,280, which aligns with the horizontal Support Level and the lower boundary of the rising structure. Buyers successfully defended this area, keeping the bullish structure intact. From this support, Gold has started to rebound and is now pressing higher toward the Seller Zone / Resistance Level near 4,380 (TP1) — a key supply area where sellers may attempt to slow the move. As long as XAUUSD holds above the 4,280 Support, the bullish scenario remains valid. I expect continued upside pressure toward the 4,380 Resistance (TP1). A clean breakout and acceptance above this seller zone would open the path for further bullish continuation. However, rejection from resistance could lead to a short-term consolidation or a healthy pullback back toward support. For now, the structure favors buyers, with 4,280 as key support and 4,380 as the main upside target. Always manage your risk and trade with confirmation. Please share this idea with your friends and click Boost 🚀

XAUUSD Update - 4H TimeframeGold XAUUSD) has firmly broken and closed above the key horizontal resistance line around 4295-4300 on the 4H chart. This level, previously acting as strong overhead supply, has now flipped into potential support.As per the structure: If gold holds and stays above this horizontal line, the bias turns totally bullish – confirming higher highs and higher lows in the ongoing uptrend. We're seeing renewed momentum with price pushing toward recent highs near 4340+, supported by the ascending trendline and increasing volume on bullish bars.Potential targets on continuation: 4350 – 4380 zone.Watch for any retest of the breakout level for better entries.#XAUUSD #Gold #Bullish #Breakout #Forex #TechnicalAnalysis #Trading This is not financial advice. Trading involves significant risk of loss. Always conduct your own research and manage risk appropriately. Past performance is no guarantee of future results.

XAUUSD How to become successful in forex and stock trading: 1.Master fundamentals and technical analysis. 2,Build and follow a solid trading plan. 3.Apply strict risk management (1–2% rule). 4.Stay disciplined—control fear and greed. 5.Record and analyze every trade. 6.Focus on high-quality setups only. 7.Diversify across assets and markets. 8.Keep evolving—study, adapt, and grow daily.

GOLD Elliott Wave – Daily: Possible Expanding Flat ScenarioThis is a speculative Elliott Wave possibility being monitored on the daily XAUUSD chart. While the structure could develop as a complex expanding flat correction (Wave IV), this scenario requires significant fundamental confirmation and price action validation before it becomes the primary count.
Daily Structure (Speculative):
Wave (i)–(ii)–(iii): Completed impulse sequence
Wave (IV): Potential expanding flat if structure develops (currently not confirmed)
Wave C downside: If this unfolds, targets would align with 1.618 extension (~3,630.262) and base channel support (~2,920.49)
Important caveats:
This is an extremely bearish scenario and remains highly speculative
Fundamental backdrop would need to support a sustained breakdown
Current intraday ABC structures and bounces remain the primary near-term focus
Price action and momentum must validate this pattern; structure alone is insufficient
Fundamentals to monitor for activation:
Watch for shifts in:
USD strength: Sustained dollar rally weakens gold demand
Fed policy: Rate cuts or dovish pivot reduces real yields
Geopolitical safe-haven demand: Reduced flight-to-safety buying
Real interest rates: Lower real rates typically support gold; rising rates are bearish
Central bank positioning: Any shift away from gold accumulation
If these fundamentals don't shift in the bearish direction, the expanding flat scenario loses conviction and intraday bounces become the primary focus.
Bottom line: This expanding flat is a possibility to monitor, not a confirmed roadmap. Trade the intraday structure and bounces; watch for both technical and fundamental confirmations before committing to this deeper bearish scenario.

GOLD MARKET UPDATEHey Everyone,
As we close out the week, price action on the 1 hour chart continues to consolidate within the defined Goldturn range between 4193 and 4233. The 4193 weighted Goldturn has held as a structural support level, generating the rebound that carried price back into 4233.
Earlier in the week, we observed a cross and lock above 4233, which leaves the 4275 gap unfilled. This upside inefficiency will remain on our radar as long as price holds above the mid range structure.
We will return Sunday with a full multi-timeframe breakdown and detailed trade tracking plan for the upcoming week.
Mr Gold

Gold next move (weekly forecast) (8th Dec - 12th Dec-2025)Go through the analysis carefully, and do trade accordingly.
Anup 'BIAS for the week (8th Dec - 12th Dec-2025)
Current price- 4210
1st scenario
"if Price stays below 4235, then next target is 4190, 4170, 4150 and 4110"
2nd scenario
if price stays above 4235 on 4H- TF, then the next target is 4260, 4300,4340.
Best of luck
Never risk more than 1% of principal to follow any position.
Support us by liking and sharing the post.
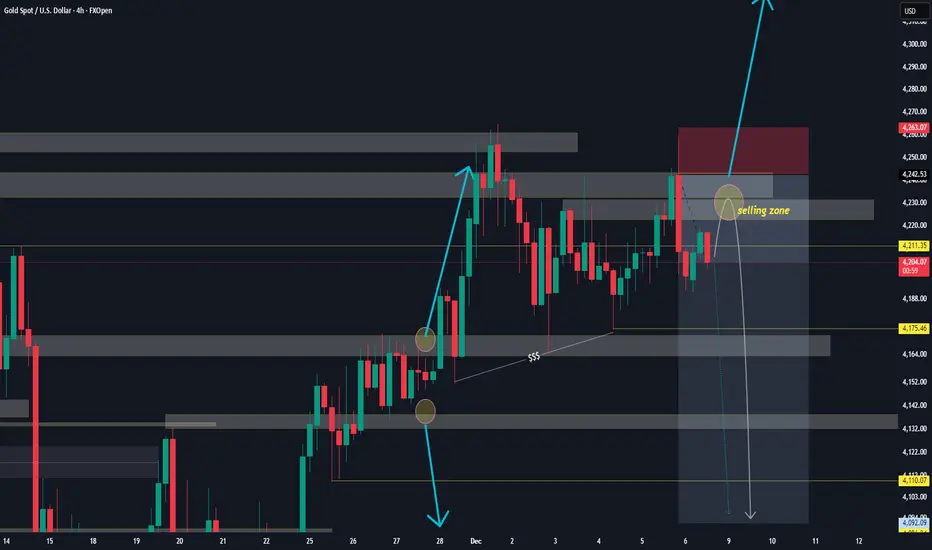
GOLD XAUUSD DIFFERENT CHART ON PRICE ACTION.
We are watching 4280-4285 demand floor ,if we have any 3hr/4hr close below this level, then the next floor will be a retest of 4265-4255 zone and the break and close of this zone will be 4174-4178 zone as possible demand floor based on price movement and structure.
my goal is to see the demand floor of the bullish channel updated at 4150-4155 just like we updated the supply roof of the bullish channel this week in the zone 4360-4350 zone and sold off respectively .
GOODLUCK.
