MANAGE THE TRADE
if you can hold this sell without closing at 4166 please do or close some position and leave some if its more than 1 but it's good to close at 4166-60 too because we will still get another entry if it moves below or any direction it moves
Trade ideas

GOLD (XAUUSD): Sticking to The Plan
Gold stuck on a key daily resistance this week.
To buy, we continue waiting for its breakout.
A daily candle close above 4266 will confirm a violation.
A bullish continuation will be expected to 4355 then.
❤️Please, support my work with like, thank you!❤️
I am part of Trade Nation's Influencer program and receive a monthly fee for using their TradingView charts in my analysis.

Gold (XAUUSD) – Possible Triangle Into Final Push HigherPrice action is developing a contracting ABCDE triangle after completing the previous corrective leg. As long as the Invalidation Level holds, the structure favors a bullish continuation.
📌 Key Elliott Wave Notes
Wave A–B–C completed
Wave D expected to retest resistance
Wave E pullback forms the final leg of the triangle
Breakout above triangle should launch Wave (v) / (5) higher
🎯 Bullish Target Zone
4,350 – 4,380 area remains the next major resistance & profit-taking zone.
❗ Invalidation
Break below the STRUCTURE LOW (marked “Invalidation Level”) negates the triangle and suggests deeper downside.
📈 RSI
Bullish divergence forming on the lows supports triangle exhaustion.
Idea Summary
While price stays above support, look for a breakout after completion of wave E targeting the higher supply zone. If support fails, reassess the wave count.

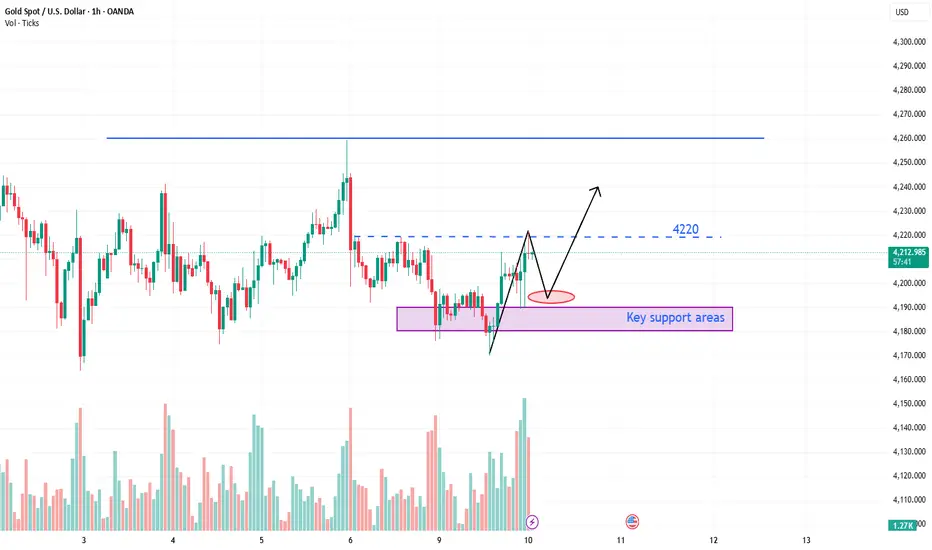
THE KOG REPORT - UpdateEnd of day update from us here at KOG:
As we said yesterday we would stick with the plan from Sundays report which has worked well so far. We managed to get the move up and down, then another red box trade for a long and some traders even went in for the short from our given level of 4328,
Now, we may experience some ranging with the key level at the hot spot 4220and support at the hot spot 4187. We would like to see this go a little higher but that resistance is important for the break!
As always, trade safe.
KOG

XAUUSDHello Traders! 👋
What are your thoughts on GOLD?
Gold remains in a strong long-term bullish trend. After establishing a new All-Time High (ATH), the price has entered a corrective phase and is currently trading below a key resistance zone. This justifies the selling pressure in the short term.
We anticipate the correction to extend further until the price reaches the optimal support area. This zone represents a significant Confluence of two technical factors:
* The long-term ascending trendline.
* The 0.5 (50%) Fibonacci retracement level.
The marked area (Green Box) serves as the ideal pivot point for the correction to end and the next bullish Impulse Wave to begin. Upon reaching this level, we expect renewed demand to drive the price toward new record highs.
This analysis is based on the Weekly Timeframe. Therefore, the realization of this scenario requires patience and time; it is not intended for short-term intraday trading.
Don’t forget to like and share your thoughts in the comments! ❤️

Today's market trend analysis and exclusive trading strategy.Gold continued its rollercoaster ride today, with market sentiment clearly shifting ahead of the interest rate decision, resulting in very limited overall volatility. On one hand, the market has largely priced in the rate cut expectations, with a consensus now widely believing there's an over 80% probability of a 25 basis point cut by the Fed. This "expectation fulfilled" market sentiment is unlikely to generate significant volatility unless the outcome surprises us. What truly warrants attention is not the rate cut itself, but rather the post-decision guidance on the interest rate path, including the latest dot plot, economic projections, and Powell's remarks at the press conference. These signals will directly influence the market's assessment of the future pace of rate cuts, especially the policy path in 2026, which will be crucial in shaping the next gold price trend. In this market environment, everyone must maintain a steady pace and avoid greed. With unclear direction and limited volatility, caution with funds is crucial. This type of market is most prone to losses from emotional trading. In the current situation, pay close attention to the bottom and avoid making trades you're not confident in, or taking unnecessary risks. If a clear structure and direction emerge later, I will notify everyone immediately so you can follow the trend. Market opportunities can wait, but risks never wait. Staying calm, seeing clearly, and then acting is the true path to profit.

The Discipline of Doing Nothing“A trader’s strength is not measured by how often they enter…
but by how long they can wait.”
Most traders believe progress happens when they trade.
But in reality, progress often happens in the moments when
you choose not to trade.
Waiting is not passive.
It is an active decision to protect capital.
It is choosing patience over impulse.
It is the discipline that separates a gambler from a trader.
Why Doing Nothing Is Hard
Your brain seeks stimulation, not discipline.
Silence creates discomfort.
Watching price move without you creates doubt.
So you justify a trade:
“It might run…”
“It looks like a breakout…”
“It could work…”
But price doesn’t reward “could.”
Price rewards confirmation and alignment.
What Doing Nothing Actually Means
• You skip trades that don’t fit your plan
• You conserve emotional energy
• You let the market come to your level
• You wait for structure to speak clearly
Every skipped bad trade increases your edge.
Every patient decision sharpens your mindset.
Doing nothing gives you the chance to do something right.
The Invisible Skill
Nobody sees the trades you avoid.
Nobody congratulates you for sitting on your hands.
But those unseen decisions prevent the biggest losses.
The most profitable trades
often start with stillness.
📘 Shared by @ChartIsMirror
Do you respect the moments between setups…
or do you rush to fill them? Comment below.

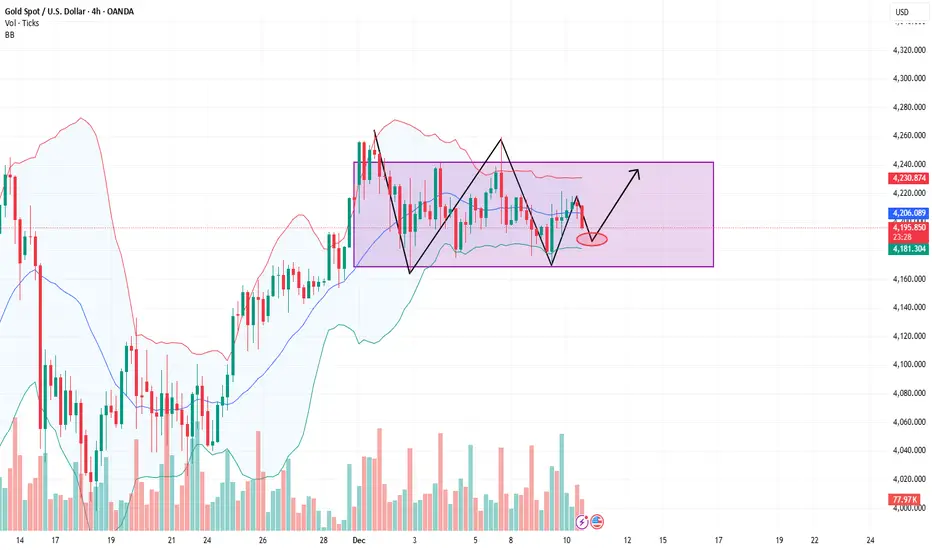
GOLD 4H CHART ROUTE MAP UPDATE & TRADING PLAN FOR THE WEEKHey Everyone,
Please see our 4h chart remaining levels and targets for the coming week with one updated Goldturn.
We are now seeing price play between two weighted levels with a gap above at 4224 and a gap below at 4124. We will need to see ema5 cross and lock on either weighted level to determine the next range.
We will see levels tested side by side until one of the weighted levels break and lock to confirm direction for the next range.
We will keep the above in mind when taking buys from dips. Our updated levels and weighted levels will allow us to track the movement down and then catch bounces up.
We will continue to buy dips using our support levels taking 20 to 40 pips. As stated before each of our level structures give 20 to 40 pip bounces, which is enough for a nice entry and exit. If you back test the levels we shared every week for the past 24 months, you can see how effectively they were used to trade with or against short/mid term swings and trends.
The swing range give bigger bounces then our weighted levels that's the difference between weighted levels and swing ranges.
BULLISH TARGET
4224
EMA5 CROSS AND LOCK ABOVE 4224 WILL OPEN THE FOLLOWING BULLISH TARGET
4328
EMA5 CROSS AND LOCK ABOVE 4328 WILL OPEN THE FOLLOWING BULLISH TARGET
4422
EMA5 CROSS AND LOCK ABOVE 4422 WILL OPEN THE FOLLOWING BULLISH TARGET
4494
BEARISH TARGETS
4124
EMA5 CROSS AND LOCK BELOW 4124 WILL OPEN THE FOLLOWING BEARISH TARGET
4042
EMA5 CROSS AND LOCK BELOW 4042 WILL OPEN THE SWING RANGE
3964
3873
As always, we will keep you all updated with regular updates throughout the week and how we manage the active ideas and setups. Thank you all for your likes, comments and follows, we really appreciate it!
Mr Gold
GoldViewFX

XAUUSD – The 4.221 Zone Determines Direction Ahead of Fed ...XAUUSD – The 4.221 Zone Determines Direction Ahead of Fed
From my perspective, gold on 10/12 is in a "waiting to choose direction" phase:
The price is caught between the resistance zone of 4.221–4.239 and strong support at 4.166.
On the 45m chart, the current structure is a sideways top, following the previous upward move.
In the context of the Fed about to announce interest rates, I won't guess but will closely follow these two zones to make decisions.
🎯 Important Technical Zones
Main Resistance:
4.221 – 4.225: Fibo zone 0.236–0.382 and thick volume cluster.
4.239: extended resistance peak – if broken, the target is the 4.25x zone.
Strong Support:
4.166: "Strong support" zone on the chart – current range bottom.
Below 4.166, the 4.12x zone is the extended Fibo 1.618, where liquidity might be attracted if the market sells off deeply.
📌 Scenario 1 – Continued Uptrend (preferred if holding above 4.200)
If the price:
Holds firmly above 4.200,
Clearly breaks the 4.221–4.225 zone and closes a 45m candle above,
I will consider this a confirmation signal that buyers are regaining control.
Trading reference:
Buy when the price breaks & retests 4.221–4.225.
Temporary SL set below 4.210.
TP: 4.245 – 4.258 – 4.270.
As long as gold stands above 4.200, I prioritize the scenario of maintaining a bullish bias, viewing any pullback to 4.20x as a buying opportunity.
📌 Scenario 2 – Short-term Sell within the Range
If the price fails to break 4.221–4.239, leaving a cluster of pin candles with small bodies, I consider this a signal of exhaustion at the resistance zone:
Sell around 4.221–4.225 (up to 4.239 if there's a spike).
SL above 4.239.
TP: 4.190 – 4.176 – 4.166, deeper to 4.130 if selling pressure increases strongly.
This scenario is for short-term scalping/swing, going against the medium-term bullish bias, so volume must be tightly controlled.
1️⃣ Basic Context: Everyone Awaits the Fed
USD/CHF is trading steadily around 0.8060, reflecting the FX market's wait-and-see stance ahead of the Fed's decision.
Investors don't want to bet too heavily in one direction before the news, so gold tends to fluctuate within the range rather than breaking out immediately.
When the Fed announces interest rates and guidance, gold's volatility range can expand very quickly, sweeping through both resistance and support zones.
Therefore, I don't recommend entering large volume orders right before the Fed. The priority is to read price reactions at the 4.221 and 4.166 zones, then decide whether to increase or decrease positions.
2️⃣ My Plan
Above 4.221, holding price well: prioritize buying scenario on break, targeting 4.25x.
Failing to break 4.221, weak candles: consider short selling to 4.19x – 4.166.
If the price falls straight below 4.166, I will temporarily stay out, waiting for the market to create a new balance zone before planning further.
Each trade risks a maximum of 1–2% of the account, no widening SL during strong news phases.
If you find this perspective useful, follow the TradingView channel and leave a comment on whether you lean towards breaking above 4.221 or turning back from resistance – let's update after the Fed news.

Gold 30-Min — Volume Buy Reversal Triggered⚡Base : Hanzo Trading Alpha Algorithm
The algorithm calculates volatility displacement vs liquidity recovery, identifying where probability meets imbalance.
It trades only where precision, volume, and manipulation intersect —only logic.
✈️ Technical Reasons
/ Direction — LONG / Reversal 4205 Area
☄️Bullish momentum confirmed through strong candle body.
☄️Structure shifted with higher-low near key demand base.
☄️Volume expanding confirms order-flow alignment upward.
☄️Buyers reclaimed imbalance with sustained clean break.
☄️Algorithm detects rising momentum under low liquidity.
⚙️ Hanzo Alpha Trading Protocol
The Alpha Candle defines the day’s real control zone — the first battle of momentum.
From this origin, the Volume Window reveals where the next precision strike begins.
⚙️ Hanzo Volume Window / Map
Window tracked from 10:30 — mapping true market behavior.
POC alignment exposes institutional bias and breakout potential zones.
⚙️ Hanzo Delta Window / Pulse
Delta window monitors real buying vs. selling power behind each move.
Tracks volume aggression to expose who controls the candle — buyers or sellers.
When Delta aligns with Volume Map, momentum becomes undeniable.

GOLD 4H Chart AnalysisDear Traders – 8 Dec 2025
Please review the updated 4H chart.
Since the start of December 2025, GOLD has been repeatedly testing key levels, with an upside gap near 4262 and a downside gap near 4164. Price is likely to continue testing both sides until one of these levels breaks, confirming the next directional move and range.
On the 4H timeframe, the double bullish symmetrical triangle has broken to the upside, which is a clear bullish signal. However, there is still a possibility of one more retest toward the lower level around 4135 – 4165 zone and potentially to the retracement zone.
If a candle closes and holds below the ifvg zone around at 4135, we could see a deeper retracement toward the 4000 – 4044 area.
IMPORTANT:
This week's news calendar is packed with high impact events. Please be cautious with your trades and positions, as the market are expected to be volatile across the board.
Keep this in mind when looking for buy entries from dips. The updated chart will help you monitor any downward move and catch the potential bullish bounce.
Bullish Targets: 4244, 4278, 4328
Bearish Targets: 4135, 4044

XAUUSD: Inverse H&S Points Toward 4270 TargetHi!
Gold has formed a clear Inverse Head & Shoulders structure, signaling a potential bullish reversal. The support zone around the head held strongly, forming the left shoulder, head, and right shoulder in sequence. Price has now broken above the neckline, confirming the pattern and showing renewed bullish momentum.
If price retests the neckline successfully, it can provide a higher-probability long entry. A sustained hold above this level keeps the bullish structure intact, with the measured target projected near 4265–4270 USD.
However, if price dips deeper, the right scenario remains a potential bullish retest, as long as the structure stays above the neckline zone. Only a drop back below the head invalidates the pattern.
Overall, as long as buyers defend the neckline, the market maintains a bullish outlook toward the target zone.
Disclaimer: As part of ThinkMarkets’ Influencer Program, I am sponsored to share and publish their charts in my analysis.

xauusd buyGold is pulling back after breaking the downtrend line... Expecting an upward move after consolidation

GOLD multi time frame analysisGold is at an important 2025 level,will try to give here graphics of multi timeframe patterns of gold also will try to give important gold levels below

Precise Strategy AnalysisThe daily chart shows the bullish trend remains intact, while the 4-hour chart maintains a range-bound pattern. Currently, the Bollinger Bands are narrowing within the 4170-4230 range, suggesting a potential range-bound trading strategy of buying low and selling high within this area. However, two points need attention: firstly, after Tuesday's rise, the support level may have moved up to around 4200, not necessarily reaching 4180; secondly, a strong break above the upper Bollinger Band at 4230 would open up further upside potential, with a target of 4260 or higher. Therefore, intraday trading should consider placing long orders in the 4190-4180 range, while short positions can be initiated with small positions at the 4230 resistance level. The focus is on the Fed's decision at midnight, with the market widely expecting interest rates to remain unchanged. Attention should be paid to Powell's tone. If his comments are dovish, it could trigger a sharp rise followed by a fall in gold prices; please exercise strict risk management.
Today's gold trading recommendations:
Short positions can be initiated around 4220-4215, with a stop loss at 4230 and a target of 4190.
Long positions can be initiated around 4190-4185, with a stop loss at 4170 and a target of 4210.
How to set % risk per trade based on your statistical dataHey whats up traders today it will be a short one in the bullet points but I believe a valuable points to think about. The setup matters, but the real foundation is how much you risk per trade. If you don’t control this, nothing else works. Your edge collapses. Your psychology collapses. And your results become completely random.
If you are not gambler you most likely risk between 0.5 -2% risk per trade. Good, but why?
Many traders use this risk because it's kind of well known and recommended value risk per trade. Ok, it's relatively safe, but if you don't have it build based on your statistical data. You can be also risking to low while you could make more. So In this post is not about why we should use risk management and calculate if for each position based on SL distance. I already did this post below 👇Click the picture to learn more In this post I will try to give advice how you can calculate best risk per trade for you based on your strategy and risk.
I always recommend backtest at least 300 examples of strategy. When you do that, you know your average win rate on average target. From the tab bellow you can see how many % of trades you need to win with the specific risk reward. Here is also important to consider your ability to hold in the trade. Its amazing to catch 1:5 risk reward trades, but it mostly comes with low win ratio in other words, you will get stopped out few times until you get big trade. Also 1:5 risk reward usually has a pullback during the move. Can you face it without emotions being affected?
Most importantly, you finally understand something every professional lives by: you don’t know the distribution of the trades.
You may have a 65% percent win rate. It still means that you can have 35 losses out of 100 traders. Remember distribution of wins and losses is random , you never know outcome of next trade.
It could be win win loss win. Or loss loss loss win win. Or a brutal streak of seven losses before the market pays you back.
✅✅❌✅❌❌✅✅✅✅❌✅
When wins and losses are evenly distributed it's quite comfortable to continue in opening new trades. You still believe your strategy and it's simply normal to have loss time to time.
✅❌❌❌✅❌❌❌❌❌✅✅
But what you gonna do when such a streak comes? Are you gonna doubt your strategy? Are you gonna look for different strategy? Remember 65% success rate means 35 possible losses out of 100. If 20 losses comes in a row your long term statistics still was not broken.
Dont think this cant happen to you. If this didnt happen to you yet, you are not trading for long enough. It will come and its better to be prepared.
📌 Lets look at the Monte Carlo simulation with our 65% win ratio and 2RR
As we can see on the picture below if you start with 10K and follow your strategy in a short period of one month we can face drawdown and end unprofitable even when we did everything right. Why? We did everything right and we have positive winning ratio and Risk reward
📌 Random distribution of the trades
I don't win every trade, you don't win every trade. No one does. Trading is longterm game and short term result can be a bit random. Because you are might trend trader and market can stay in the range during some months or you are a reversal trader and its still trading against you. So how to beat it - Time.
📌 Lets have a look at the same setup 65% Win rate and 2 RR
But now let's have look at the long-term results. As we can see on chart below. after some time even the worst case distribution is getting in to the profit. However there still was 3 months around break even - Frustrating but its the reality 📌 Lets improve Risk reward to 2.3
You will be getting slightly bigger wins so every loosing streak will be recovered faster.
And you should not stay in the prolonged drawdowns for long periods
📌 Lets improve win ration to 70%
And its even better less often you got loss and 2.3 RR recover slightly better.
📌 So what should be my risk per trade
First done look on how much you want to make, trading is mainly about protecting capital. After you got your statistical data. Run Monte Carlo simulations and try to model the worst case distribution of the trades.
For example if you got 70% win rate - means you can lose 30 trades out of 100. Be ready that it can happen, even its unlikely and if that really happens it means something is wrong with your strategy or you made too much mistakes. But count with it that it can happen.. Setup your risk per trade in such % that you would be comfortable if that happens.
📍 0.25% Risk - 30x Loss = - 7.5%
📍0.5% Risk - 30 x Loss = - 15%
📍1% Risk - 30 x Loss = -30%
📍2% Risk - 30x Loss = - 60%
📍3% Risk - 30x Loss = - 90%
Define what would you be able to accept and be comfortable even during a loosing streak.
📌 Have more accounts
This will give you flexibility. Im running 3x personal accounts. Each with different risk. with copy trading system to distribute my positions. 🎯 Account 1: Here Im opening all trades which I has well defined risk and its A+Setups. If I open a trade on this account they goes automatically to the other 2 accounts. So I got proportionaly this positions on whole capital with 1% risk.
🎯 Account 2: Here are running copied trades from Account 1 + Im opening another positions when I want to add or increase the risk also used for short terms setups. Its 3% risk only form this one specific account and its not copied to other accounts.
🎯 Account 3: Here are running trades from account 1 + This account is also used mainly for the crypto trades and news trading. Trades are also isolated just for this account and not copied to the whole portfolio.
🎯 Prop Firm Trading
For the prop trading where more strict rules Im using completely different approach which I described in this post below 👇Click the picture to learn more Final tip: Try to have strategy with win rate between 65 - 70% and 2 - 2.5 RR.
If you got anything lower than that you can go thru some dark periods, but you will survive if stick to your plan based on the statistics. If you don't have statistical data of your strategy, stop trading for while , step back and do a bit of backtesting Tradingview has great backtesting features.
David Perk aka Dave FX Hunter

XAUUSD: Analysis and Strategy for December 12Gold Technical Analysis:
Daily Resistance: 4382, Support: 4175
4-Hour Resistance: 4382, Support: 4265
1-Hour Resistance: 4343, Support: 4285
Technically, after the European session opened, the price surged upwards, breaking through the 4300 level in the short term. Moving average support has moved upwards, and technical indicators have completed their correction, strengthening confidence in a continued bullish outlook for gold in the medium to long term.
On the daily chart, gold is showing strong performance, exhibiting a continuous upward trend. Moving averages are crossing upwards, support levels are gradually moving higher, and Bollinger Bands are expanding upwards. After this breakout, a new round of upward movement is inevitable. The price is rising. Today's support level to watch is around 4265, the area where the top and bottom have reversed.
On the 1-hour chart, the price is rising in a step-like pattern, breaking through multiple resistance levels in the short term and continuing yesterday's upward trend. The Bollinger Bands are trending upwards, the moving averages are crossing upwards, and the MACD/KDJ indicators suggest that the upward trend will continue. Short-term support is around 4285/4280, and short-term resistance is at the previous historical high. Today is Friday, so be aware of the systemic risks brought by the time window.
Cautious trading strategy:
BUY: 4280near
BUY: 4265near
Selling requires waiting for a bearish pattern to form on the chart.
More analysis →

XAUUSD NEWEST TODAY 11, DEC 🔹 MARKET BRIEFING – XAU/USD
Market State:
– Price has bounced strongly from the demand zone and is now holding above the support zone, showing clear bullish momentum.
Key Levels:
– Support Zone: 4218
– Target 1: 4236
– Target 2: 4247
– Target 3: 4259
Next Move:
– Bullish bias remains dominant; a retest of the 4218 support zone could trigger the next upward leg toward 4236 → 4247 → 4259.

Gold Just Flipped Structure.....The market just transitioned from a bearish sequence into early bullish structure. Most traders will miss this shift but if you understand BOS, ChoCH, and liquidity behaviour, this is where smart money prepares for the next leg up.
1. Market Structure Overview
Your chart shows a full bearish sequence (LH–LL) that has recently transitioned:
-Multiple Lower Highs (LH) and Lower Lows (LL) → clear bearish structure.
-A Change of Character (ChoCH) occurs at the key zone → first signal of reversal.
-A clean Break of Structure (BOS) to the upside confirms buyers stepping in.
-Price then creates a Higher Low (HL) followed by Higher Highs (HH) → early bullish trend established.
This is a textbook reversal from bearish → bullish.
2. Key Zones Identified
Support Zone (Demand)
Located around 4195 – 4174
→ This is where the ChoCH and HL formed, confirming buyer strength.
Resistance Zone (Supply)
Located around 4219 – 4229
→ Price is currently approaching this zone. If it breaks, bullish continuation is expected.
3. Price Behaviour & Expectation
Your yellow projection is correct:
- Price may pull back into the minor support (near current level).
- After that, a bullish leg toward 4219 zone is expected.
- If BOS occurs above 4229, price has room to expand toward new highs around 4238–4244.
This aligns perfectly with the HH → HL structure forming now.
4. Trading Logic
Why bullish?
- Clear BOS on bullish side
- Higher Low forming above support
- Liquidity taken from previous LL
- Price respecting the new bullish structure
Invalidation
If price breaks below 4174, bullish structure is invalidated.
5. Trade Signal
This follows your trading style — structure-based, clean, and logical.
📌 BUY ENTRY: 4203 – 4207
(Retesting minor support + inside new bullish structure)
📌 STOP LOSS: 4178
(Below HL and below ChoCH zone — strong invalidation)
📌 TAKE PROFIT 1: 4219
(Retest of resistance zone)
📌 TAKE PROFIT 2 (Main Target): 4229 – 4233
📌 TAKE PROFIT 3 (Extended Target): 4242 – 4244
Risk–Reward:
1 : 2.5 up to 1 : 4 depending on TP

LONG on XAUUSD (Gold) at 4198.80Entered LONG on XAUUSD (Gold) at 4198.80
Targets: 4220 | 4238 |
Stop Loss: 4185
Leverage: 20x Clean higher-timeframe structure + bullish order block holding perfectly. Expecting continuation to the upside NOT financial advice
DYOR | Trade at your own risk | Protect your capital!#XAUUSD #Gold #GoldTrading #Forex #TradingSignals #PriceAction #DayTrading #SwingTrading #Commodities #Metals #TradingWho’s riding gold with me?

XAUUSD weekly closing below 4245H1 TIMEFRAME SETUP
XAUUSD still moving in rising wedge pattern and we have supply at 4243-4246 zone.
XAUUSD is still bullish rall pattern overall 4245 is supply zone.
If H1 &H4 candle closes below 4245 then readyfor the implusive drop towards 4208 then 4200 milestone.
If it's H1-H4 closes above 4250 then don't sell ,Market will test 4280 .
Keep in mind 4245

GOLD IDEA TIME RATE 4H🔹 MARKET BRIEFING – XAU/USD (4H)
Market State:
– Price is compressing inside a symmetrical triangle, respecting both the rising support line and the descending upper boundary, showing balanced but tightening momentum.
Key Levels:
– Triangle Support: ~4185–4195
– Triangle Resistance: ~4250–4260
– Liquidity Zone Below: 4128 – 4135
Next Move:
– A breakout above the triangle resistance could trigger a bullish continuation leg toward higher highs.
– If price rejects at the upper boundary and breaks below the rising trendline, liquidity at 4128–4135 becomes the next downside magnet.

Gold traded within a rangeIn the short term, gold remains range-bound. It's not advisable to chase higher prices before a valid breakout. The recommended strategy is to buy on dips. Consider entering long positions near 4195. If the price breaks through the 4230 resistance level, add to long positions, targeting the 4245-4255 area. This area represents a resistance zone formed by connecting the previous downtrend highs; a break above this level would signal the start of a daily-level rebound in gold.
In the short term, the market will likely continue to trade within a range; the strategy should be to buy on dips.