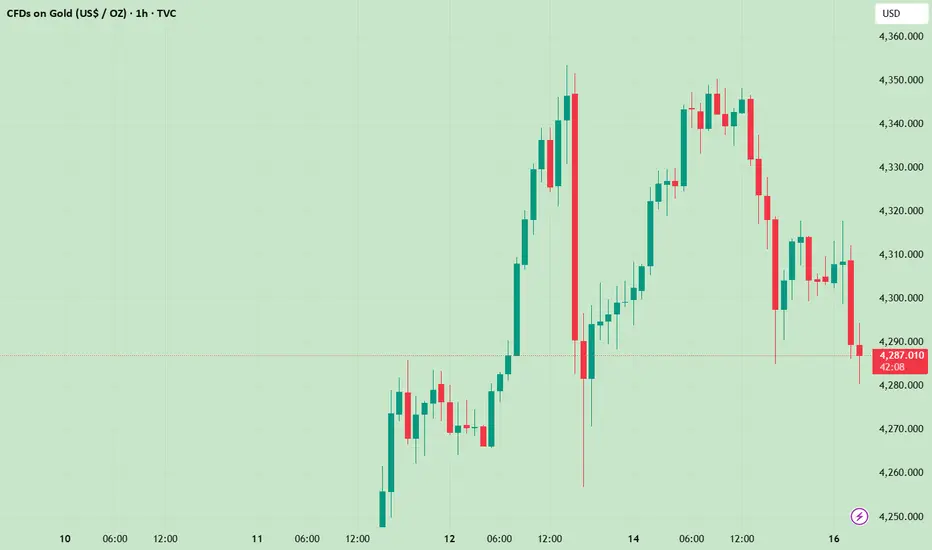
Gold Enters Controlled Consolidation Within a Bullish StructureGold is no longer advancing in an accelerated manner, but is instead entering a phase of controlled consolidation . This is a natural response following a clear impulsive move, as the market needs time to rebalance supply and demand. Despite a cautious overall sentiment amid mixed macro conditions, capital flows continue to maintain exposure to gold.
On the H1 timeframe , the technical structure continues to support the bullish bias. Price is rotating within a narrow range, with higher lows being preserved , indicating that selling pressure is not aggressive and is largely driven by short-term profit-taking. This suggests that buyers remain in control of the primary move .
Current price action reflects a supply absorption phase . If the upper resistance zone is absorbed and price achieves a clear and decisive close above it , the bullish trend will be reaffirmed, opening the path toward the 4,385 area . Conversely, further sideways movement should not be viewed as a negative signal; a well-formed consolidation base often precedes a more sustainable advance. Only a decisive break below support would require reassessing the bullish scenario.
Market insights

XAUUSD Bullish Trend in Play — Path Open Toward 4,300 TargetHello traders! Here’s my technical outlook on XAU/USD (Gold) based on the current market structure. Gold remains in a broader bullish trend, supported by a clearly defined rising Trend Line that has guided price action since the beginning of the impulsive move. After the initial breakout from the Support Level, the market formed a well-structured range, followed by a corrective pullback and another consolidation phase, confirming healthy bullish rotation. Price is currently trading above the key Support Level near 4,140, while attempting to stabilize above the rising Support Line, which keeps buyers in control of the short-term structure. The recent breakout from the second range indicates renewed bullish momentum, with price now approaching the major Resistance Level around 4,260–4,270. As long as Gold holds above the support zone and respects the ascending trendline, the bullish scenario remains valid. The structure suggests continued pressure toward the upside, with TP1 positioned near 4,300, which aligns with the next key resistance area. A clean breakout above this level could open the door for further trend continuation and higher upside targets. However, a failure to hold the Support Line could lead to a deeper pullback toward the lower support zone. For now, the technical structure favors the buyers, with bulls aiming for a retest and breakout of the 4,260–4,300 resistance zone. Please share this idea with your friends and click Boost 🚀

Lingrid | GOLD Contraction Phase Before Trend ContinuationOANDA:XAUUSD is sliding back into the mid-range support after printing a new higher high, where price briefly tapped the upper resistance band. The current decline resembles a multi-leg corrective pullback rather than trend exhaustion, especially with the structure still respecting the rising trendline. Buyers have repeatedly reacted from this dynamic support, keeping the broader bullish sequence intact.
If the market stabilizes around 4,150, the next upward extension could aim once more toward 4,270, where liquidity remains untested above prior highs. A deeper dip into the trendline would still maintain bullish bias as long as the channel holds.
➡️ Primary scenario: accumulation above 4,150 → continuation toward 4,270.
⚠️ Risk scenario: a decisive break beneath 4,120 exposes 4,050 and delays bullish continuation.
If this idea resonates with you or you have your own opinion, traders, hit the comments. I’m excited to read your thoughts!

Gold price around 4200 - market waiting⭐️GOLDEN INFORMATION:
Gold Price (XAU/USD) trades in negative territory around $4,195 during the early Asian session on Tuesday. The precious metal edges lower amid concerns that the US Federal Reserve (Fed) will adopt a hawkish tone in its rhetoric, despite delivering a rate cut on Wednesday.
Markets widely expect a 25 basis points (bps) rate cut at the Fed’s December meeting, with traders seeing a 90% probability, up from about 66% in November, according to the CME FedWatch tool. Traders will closely monitor the press conference and a Summary of Economic Projections, or ‘dot-plot,’ for fresh impetus. If the US central bank delivers a "hawkish cut," this could support the US Dollar (USD) and weigh on the USD-denominated commodity price.
⭐️Personal comments NOVA:
Gold price adjusted down around 4200, market mainly sideways before December interest rate
⭐️SET UP GOLD PRICE:
🔥SELL GOLD zone: 4258 - 4260 SL 4265
TP1: $4245
TP2: $4230
TP3: $4215
🔥BUY GOLD zone: 4162 - 4160 SL 4155
TP1: $4175
TP2: $4190
TP3: $4200
⭐️Technical analysis:
Based on technical indicators EMA 34, EMA89 and support resistance areas to set up a reasonable BUY order.
⭐️NOTE:
Note: Nova wishes traders to manage their capital well
- take the number of lots that match your capital
- Takeprofit equal to 4-6% of capital account
- Stoplose equal to 2-3% of capital account

XAUUSDHello Traders! 👋
What are your thoughts on GOLD?
Gold continues to trade within a short-term ascending channel and is now approaching the upper boundary of this structure. This region also aligns with a major resistance zone formed by the previous swing high, creating a strong confluence area.
As price enters this resistance cluster, we expect selling pressure and a potential rejection. Based on the current momentum, it does not appear likely that gold will easily break above this zone in the short term.
Therefore, the more probable scenario is:
1-A pullback toward the lower boundary of the ascending channel
2- If the channel breaks to the downside, an extended decline toward the next key support level becomes likely
Don’t forget to like and share your thoughts in the comments! ❤️

Gold Alternative RoutesGold updated routes, elliot wave is not one constant but it is variety of possibilities and as we go along we update and eliminate some of the wrong tracks at the end what we get is the right entry and right exit.
So now for our search of next entry there is a buy trade with small stop loss here but the real wave we wanna catch is the big impulse correction so i will be looking into sell when it goes up.
short term targets 3280-3310-3330 mid term targets are down at 4080-3920-3850 and long ter target is at 4700+ i expect it to go above 4700 in next 6-9 months time.

Gold Forming a Double Top Pattern?Last week, Gold( OANDA:XAUUSD ) exhibited sharp movements, both upward and downward, making trading quite challenging.
The key question is whether gold will continue its bullish trend.
Currently, gold is positioned near a resistance zone($4,231 – $4,215) and is moving close to significant support lines. Last week, gold created a bull trap above the resistance zone($4,231 – $4,215).
From an Elliott Wave perspective, it appears that gold has completed wave 5 with an expanding ending diagonal and is now undergoing a pullback towards the lower line of this pattern.
Looking at the classic technical analysis on the 4-hour chart, there’s a potential double top formation, and the momentum from the second top is quite strong, suggesting that gold may break through the support lines and confirm the double top pattern.
On the other hand, factors like the DXY Index ( TVC:DXY ) and the US 10-Year Government Bond Yield ( TVC:US10 ), which are currently bullish, could exert downward pressure on gold.
Considering all these points, I expect that gold will break through the support lines and potentially move down to $4,167.
Note: If gold breaks through the support zone($4,185 – $4,133), we can expect further declines.
First Target: $4,167
Second Target: $4,127
Stop Loss(SL): $4,247(Worst)
Points may shift as the market evolves
------------------------------------------------
We should also keep in mind that several important US economic indicators will be released this week, which could significantly impact market direction. So be extra cautious with your positions, especially during data releases:
JOLTS Job Openings➡️09 December
Federal Funds Rate➡️10 December
FOMC Statement➡️10 December
FOMC Press Conference➡️10 December
Unemployment Claims➡️11 December
------------------------------------------------
💡 Please respect each other's opinions and express agreement or disagreement politely.
📌 Gold Analyze (XAUUSD), 4-hour time frame.
🛑 Always set a Stop Loss(SL) for every position you open.
✅ This is just my idea; I’d love to see your thoughts too!
🔥 If you find it helpful, please BOOST this post and share it with your friends.

GOLD vs SP500 Bullish!Gold is outperforming the S&P 500 by 38%+
It is currently in the process of what seems to be a nice and bullish old-fashioned cup and handle.
More data is needed, but keep an eye on it.
Ask yourself, why is so much money pouring into gold over the SP500??
Let's get to 6,000 followers. ))

XAUUSD: Analysis and Strategy for December 12Gold Technical Analysis:
Daily Resistance: 4382, Support: 4175
4-Hour Resistance: 4382, Support: 4265
1-Hour Resistance: 4343, Support: 4285
Technically, after the European session opened, the price surged upwards, breaking through the 4300 level in the short term. Moving average support has moved upwards, and technical indicators have completed their correction, strengthening confidence in a continued bullish outlook for gold in the medium to long term.
On the daily chart, gold is showing strong performance, exhibiting a continuous upward trend. Moving averages are crossing upwards, support levels are gradually moving higher, and Bollinger Bands are expanding upwards. After this breakout, a new round of upward movement is inevitable. The price is rising. Today's support level to watch is around 4265, the area where the top and bottom have reversed.
On the 1-hour chart, the price is rising in a step-like pattern, breaking through multiple resistance levels in the short term and continuing yesterday's upward trend. The Bollinger Bands are trending upwards, the moving averages are crossing upwards, and the MACD/KDJ indicators suggest that the upward trend will continue. Short-term support is around 4285/4280, and short-term resistance is at the previous historical high. Today is Friday, so be aware of the systemic risks brought by the time window.
Cautious trading strategy:
BUY: 4280near
BUY: 4265near
Selling requires waiting for a bearish pattern to form on the chart.
More analysis →

Gold Analysis
Gold is in bullish channel and close to resistance area.
Daily candles closes are good although they have shadow from top but weekly candle is gonna close with a good body.
Check for confirmation in 15 min timeframe to join buyers.
Stay tuned for our next updates.

Gold AMT: Intraday Buyers vs. Weekly Distribution (4300 Zone)The market has shifted from the markup phase (Dec 6-13) into a distribution phase. The key takeaway is that value is migrating lower, and prior support is now acting as resistance.
* Structure::Distribution below Value.
* Composite PoC: 4,346 (The clear line in the sand).
* Net Liquidity: Negative slope with Conviction 2 (Institutions distributing).
* Upside Rejection: The market rejected the 4,360 area (Friday's tail), leaving immediate supply overhead.
* Volume Shift: 95% of volume is now transacting below the 4,346 PoC.
The Structural Barrier:
The critical zone to watch is 4,313 – 4,318. This represents the Weekly Breakdown cluster (Previous Support turned Resistance). As long as we are below 4,346, the medium-term path remains tilted downward.
Intraday Snapshot : The Recovery: Bullish/Trend-Up
Despite the heavy weekly chart, today’s auction at 4,303 reveals strong short-term conviction from buyers absorbing the selling pressure.
Synthesis: The Battle Map
We are currently seeing a Short-Term Long opportunity initiating a recovery toward a Medium-Term Short wall.
Key Levels to watch
* Major Resistance (Weekly): 4,346 (Composite PoC)
* Intermediate Resistance: 4,313 (Weekly Breakdown Level) & 4,323 (Session High)
* Immediate Support: 4,302 (Today's PoC) & 4,299 (LVN)
* Major Support: 4,277 (Weekly Low)
Scenarios & Forecast
📈 Bullish Case (Intraday Continuation):
With Net Liquidity rising +7.6k, buyers are currently driving the auction.
* Condition: Price must hold above 4,302 (PoC).
* Expectation: A slow grind upward to test the area above Session High at 4,323.
* Note: The zone at 4,313-4,318 is a heavy "take profit" zone for intraday longs due to the weekly structural resistance.
📉 Bearish Case (Weekly Resumption):
If the intraday rally exhausts, the weekly distribution trend takes over.
* Condition: A 15-min close back below 4,299 cancels the intraday positive flow.
* Trigger: Losing 4,313 (if reclaimed) confirms the weekly downside.
* Targets: Opens the path to the Weekly Low at 4,277.
Verdict:
Short-term Bullish bias as long as 4,302 holds, targeting a retest of the breakdown zone (4,313/4,323-4326). Traders should watch for exhaustion signals near 4,315 as the weekly bearish context may limit upside potential.

XAUUSD – Tuesday OutlookPrice is reacting into a key supply / order block zone.
As long as this area holds, the move looks corrective and favors bearish continuation toward lower liquidity.
A clean acceptance above this zone would shift focus toward a bullish expansion.

Gold (XAU/USD) at a CrossroadsGold has been consolidating within a well-defined ascending channel on the 4H timeframe, following a strong rally from late October. Recent price action has formed a clear range between the previous weekly high and low, with intraday swings narrowing, a classic sign of compression before expansion.
As the market awaits today’s Federal Reserve interest rate decision, the technical and macro setups appear to be converging.
On the 4-hour chart, gold continues to respect a broad upward channel, with a midline that has acted as a pivot zone. Current price action is hovering just above the channel midline and near the previous day high (PDH) and previous week low (PWL) levels, suggesting indecision.
Key Zones to Watch:
Support:
4,164–4,170 – Confluence of prior lows, minor Fibonacci zones
4,134 – Structural swing low; loss of this level could signal a deeper correction
4,040–4,050 – Historical demand zone and previous reaction area
Resistance:
4,246–4,265 – PDH / PWH zone; the top of current range
4,381 – Channel upper bound and extended target if bullish continuation resumes
Price has been trapped between ~4,170 and 4,265, forming a sideways structure or distribution phase. This type of price action often precedes large moves, the question is: which direction?
Macro Context – Fed Expected to Cut, But Tone May Be Hawkish
Today’s FOMC meeting is widely expected to deliver a 25 basis point rate cut, marking a potential shift from the high-rate regime of the past 18 months. However, market attention is squarely focused on the tone of the Fed’s forward guidance.
Several Fed officials have recently pushed back on aggressive easing expectations, signaling that even if a cut comes now, the path ahead may not be as dovish as markets hope. This sets the stage for what analysts call a “hawkish cut”, a rate reduction delivered with caution, and paired with messaging that suggests further cuts will be gradual or data-dependent.
Implications for gold:
-A hawkish tone may push U.S. yields and the dollar higher, applying pressure on gold
-A dovish surprise (or less hawkish tone) could boost gold, as it benefits from lower yields and a weaker USD
-The outcome could trigger significant short-term volatility, especially as gold is sitting near key technical levels
Bullish Scenario:
Fed cuts + dovish or neutral tone → yields fall, USD weakens
Gold breaks above 4,265 and
Upside targets: 4,320, 4,381, and possibly 4,400+ into early Q1 2026
Bearish Scenario:
Fed cuts, but tone is hawkish → yields rise, USD strengthens
Gold breaks below 4,164, then 4,134

XAUUSD | ATHs Aren’t Resistances. They’re Liquidity**This is a long one, if you’re looking for price direction/prediction, skip. If you want to understand market movement, read on**
Hello traders,
- Gold at ATH: Why This Level?
When price revisits an ATH, most traders immediately ask:
“Is this the top or the breakout?”
I used to ask the same question. And that question itself got me no where. Actually a lot of losses.
Let us break down how markets actually behave around obvious levels, using gold as a clean, real example.
-----------------------------------------------------------------------------------
- ATHs Are Not Resistance — They’re Liquidity
ATH range is the most noticeable levels on any chart. That clarity creates these behaviors
1. Breakout traders place buy stops above the ATH
2. Shorts place stop losses above the ATH
Different ideas. Same location
That end up with is a large pool of liquidity around ATH.
Markets don’t move because a level is “strong”. They move because orders stacked in this zone.
-----------------------------------------------------------------------------------
- Why Price Is Attracted to ATHs?
Market makers (brokers, banks, exchanges) don't enter positions like we do. They need: Liquidity & Speed
The 2 behaviors we mentioned creates exactly that.
That’s why we see price usually react violently around these levels.
-----------------------------------------------------------------------------------
- The Common Mistake
Dumb money treats ATHs as automatic resistance or automatic breakout levels. What you should know that what happens after liquidity is taken matters far more.
-----------------------------------------------------------------------------------
- What You Should Look For at an ATH?
1. Has liquidity been taken?
2. What does price do after? Does it accept and hold above? Or does it reject and displace away?
-----------------------------------------------------------------------------------
- How Institutions Use These Levels
Institutions don’t chase breakouts, enter at obvious levels, place tight stops. Instead they usually follow this process:
1. Pushes price into liquidity
2. Absorb stop orders
3. Set positions after sweeping long and short orders
4. Price expands (up or down)
That’s why reversals feel sudden & a move start from candles that look “unfair”
-----------------------------------------------------------------------------------
- A Rule That Changed How I Read a Chart
If price hasn’t taken liquidity, the move isn’t ready
When we wait for liquidity to be taken, we stay out of premature entries & out of obvious traps.
-----------------------------------------------------------------------------------
- Final thought
There will be one way or the other that you will learn that markets don’t trade based on what looks logical to you. They trade where pain is maximized and orders are concentrated.
ATHs aren’t lines to fight or chase. Observe, wait and read.
We don't predict direction with a wand. Your edge is understanding the process behind the curtains.
-----------------------------------------------------------------------------------
Education only. Not financial advice.
If you find this useful, please support me with a like and comment

Data Week: Can Gold Reach New Highs? Strategy UpdateData Week: Can Gold Reach New Highs? Strategy Update
On Monday, gold experienced a rise followed by a fall, a surge and subsequent pullback. We repeatedly warned of resistance around 4350, advising against chasing the price higher and guarding against a pullback. Gold's movement aligned with our expectations, and long positions entered in batches at support levels during the US session yielded substantial profits.
Today brings the crucial non-farm payroll data. Gold is likely to maintain a high-level range-bound trading pattern before the data release. Continue to be cautious of a potential pullback after a surge, and avoid chasing the price higher. Current price action suggests limited upside potential, with significant resistance remaining. Aggressive traders can consider shorting at the 4320-30 resistance level during the Asian and European sessions, while more conservative traders can watch the 4338-48 level.
Support is seen at 4275-85, where long positions can be entered in batches, with strong support around 4265.
Market conditions change rapidly, and it's crucial to follow the market's rhythm. Currently, the market is experiencing wide-range fluctuations, but without breaking new highs, the situation becomes precarious.
True high-level trading isn't about sifting through vast amounts of information, but about extracting the essence, focusing on the most effective signals, repeatedly applying them, and continuously optimizing them. The simpler the strategy, the more stable the results. The more focused the execution, the more profitable you'll be amidst market volatility. Our consistent returns are the best proof of this.

Brainiak | Gold wave analysisAfter Friday (12 Dec), we analyzed that the price could continue to move higher, due to a structural conflict that occurred (a strong drop but unable to break lower, plus the presence of a rejection candle). I mentioned that if the price was able to build a base, it would have the potential to move up .. which it has now done.
At this point, we need to watch whether the price can break above the high of the range I marked (4353). If it can break above this level, it should break out immediately without pulling back and move straight to test the ATH.
However, if the price is still unable to break higher, it would likely need to pull back first, with my target zone around 4279. Overall, based on the broader picture, I still see a strong chance for continuation to the upside. The fact that price cannot break below the low and has already rallied significantly suggests that it could be forming a new impulsive move, or it may consolidate sideways before continuing higher.
That’s all for the current outlook.

XAUUSD NEWEST TODAY 11, DEC 🔹 MARKET BRIEFING – XAU/USD
Market State:
– Price has bounced strongly from the demand zone and is now holding above the support zone, showing clear bullish momentum.
Key Levels:
– Support Zone: 4218
– Target 1: 4236
– Target 2: 4247
– Target 3: 4259
Next Move:
– Bullish bias remains dominant; a retest of the 4218 support zone could trigger the next upward leg toward 4236 → 4247 → 4259.

XAUUSD – Rejection at Resistance, Bearish ContinuationGold price has rallied into a well-defined resistance zone, where multiple rejections signal strong selling pressure. After a clear change of character (CHoCH), momentum shifts bearish, suggesting a potential downside continuation.
Price may attempt a brief pullback toward resistance before moving lower, with bearish targets marked at Target 1 and Target 2. Overall structure favors sell-the-rallies while below resistance.

GOLD IDEA TIME RATE 4H🔹 MARKET BRIEFING – XAU/USD (4H)
Market State:
– Price is compressing inside a symmetrical triangle, respecting both the rising support line and the descending upper boundary, showing balanced but tightening momentum.
Key Levels:
– Triangle Support: ~4185–4195
– Triangle Resistance: ~4250–4260
– Liquidity Zone Below: 4128 – 4135
Next Move:
– A breakout above the triangle resistance could trigger a bullish continuation leg toward higher highs.
– If price rejects at the upper boundary and breaks below the rising trendline, liquidity at 4128–4135 becomes the next downside magnet.

LONG on XAUUSD (Gold) at 4198.80Entered LONG on XAUUSD (Gold) at 4198.80
Targets: 4220 | 4238 |
Stop Loss: 4185
Leverage: 20x Clean higher-timeframe structure + bullish order block holding perfectly. Expecting continuation to the upside NOT financial advice
DYOR | Trade at your own risk | Protect your capital!#XAUUSD #Gold #GoldTrading #Forex #TradingSignals #PriceAction #DayTrading #SwingTrading #Commodities #Metals #TradingWho’s riding gold with me?

Gold's double top pattern is under pressure as expected!Gold Price Trend Analysis: Gold rose to a high of around 4318 before weakening and falling. Currently, it is temporarily maintaining a high-level range-bound consolidation on the daily chart. The consecutive long upper shadows on the candlestick chart indicate insufficient upward momentum in the short term, and the price is temporarily under pressure around 4320.
Gold Technical Analysis: On the hourly chart, short-term moving averages are starting to turn downwards and diverge. The candlestick pattern continues to be pressured by short-term moving averages, maintaining a slightly weak trend. In the short term, pay attention to the support zone around 4270-4260. After a bottoming-out rebound, the hourly chart is currently maintaining a narrow range of fluctuation at low levels. The technical pattern shows signs of gradually completing its repair, and there may be some room for a small rebound in the short term. Pay attention to the short-term adjustment and repair situation. Currently, near the European session, gold has fallen to a low of around 4270, which is also close to the double bottom of the previous low of 4255. The current European session suggests a continued downward trend, with the 4300-4320 level acting as a secondary resistance point. On the hourly chart, a pullback to the 4270-4255 area could present an opportunity to enter long positions. Overall, the recommended trading strategy for gold is to primarily sell on rallies and secondarily buy on dips. The key resistance level to watch in the short term is around 4300-4320, while the key support level is around 4270-4250. Please stay on track.

Gold Analysis: Bullish Structure and Demand in FocusGold is trading in a strong bullish market structure. After a clear Break of Structure (BOS) price impulsively moved higher and formed a new range high. The move is supported by strong displacement indicating institutional participation. Price is currently consolidating above the premium discount equilibrium suggesting continuation rather than reversal. The recent high is marked as a weak high which increases the probability of a short-term pullback before the next leg up.
The key area to watch is the retracement zone between 4279–4261 which aligns with prior structure BOS level and demand zone. As long as price holds above this zone the bullish bias remains intact. Below this 4250–4245 is the last intraday defense a clean break below it would invalidate the current bullish setup and open room for deeper correction toward 4200–4185 where a strong higher-timeframe demand and equal lows are resting.
On the upside acceptance above 4353 will confirm continuation toward 4409 followed by 4445. These levels align with projected measured moves and premium liquidity zones.
Note
Please risk management in trading is a Key so use your money accordingly. If you like the idea then please like and boost. Thank you and Good Luck!
