Gold Forecast - Trade Zones & Setup Before FOMCGold is still trading weak under the descending trendline and the price continues to reject the 4220–4230 resistance zone. As long as it stays below this area the chart suggests bearish pressure toward 4170 and possibly 4145–4130 where strong liquidity sits.
With the Fed rate decision tomorrow volatility is expected to increase so price may remain choppy within this range until the announcement. A clear bullish shift only comes if gold breaks and holds above 4225 which could reopen the path toward 4250–4260. For now structure remains bearish with lower-high formations and clean downside targets visible.
🔵 Buy Zone
- 4165–4175 → This is the main demand zone.
- Buy Trigger: A strong bullish candle / rejection wick from 4165–4170 confirms buyers stepping in.
- Upside Target: 4200 → 4220 → 4230.
🔴 Sell Zone
- 4220–4230 → Major supply + trendline resistance.
- Sell Trigger: If price retests 4220–4230 and gives rejection or bearish engulfing, downside resumes.
- Downside Target: 4170 → 4145 → 4130.
⚠️ Important Note (Fed Rates Tomorrow):
Before the announcement, gold may stay inside 4200–4170 range, so triggers will be cleaner after the news when volatility expands.
Note
Please risk management in trading is a Key so use your money accordingly. If you like the idea then please like and boost. Thank you and Good Luck!
Trade ideas

XAU/USD 12 December 2025 Intraday AnalysisH4 Analysis:
-> Swing: Bullish.
-> Internal: Bullish.
Analysis and bias remains the same as analysis dated 20 October 2025.
Price has printed as per previous intraday expectation by printing a bearish CHoCH which indicates, but not confirms, bullish pullback phase initiation.
Price is currently trading within an established internal range, however, I will continue to monitor price with regards to depth of pullback.
Intraday expectation:
Price to continue bearish, react at either discount of 50% internal EQ, or H4 supply zone before targeting weak internal high priced at 4,380.990.
Note:
The Federal Reserve’s sustained dovish stance, coupled with ongoing geopolitical uncertainties, is likely to prolong heightened volatility in the gold market. Given this elevated risk environment, traders should exercise caution and recalibrate risk management strategies to navigate potential price fluctuations effectively.
Additionally, gold pricing remains sensitive to broader macroeconomic developments, including policy decisions under President Trump. Shifts in geopolitical strategy and economic directives could further amplify uncertainty, contributing to market repricing dynamics.
H4 Chart:
M15 Analysis:
-> Swing: Bullish.
-> Internal: Bullish.
Price has printed as per analysis dated 02 December 2025 where I mentioned price to trade down to either discount of 50% internal EQ, or M15 demand zone before targeting weak internal high, priced at 4,264.700. This is how price printed.
Price has now tapped into a previous H4 demand zone and is continuing it's bullish trajectory, therefore, I am unable to confirm fractal high.
Current CHoCH positioning is denoted with a blue horizontal dotted line.
Intraday expectation:
Allow price to continue with its bullish trajectory as there has been no pause to confirm fractal high.
Note:
Gold remains highly volatile amid the Federal Reserve's continued dovish stance, persistent and escalating geopolitical uncertainties. Traders should implement robust risk management strategies and remain vigilant, as price swings may become more pronounced in this elevated volatility environment.
Additionally, President Trump’s tariff announcements, particularly against China, are expected to further amplify market turbulence, potentially triggering sharp price fluctuations and whipsaws.
M15 Chart:

Gold Extends Limited Gains as Markets Await USD Data📉 Technical Analysis
🔥 Key Resistance
1. ~4,280 – 4,285 USD/oz — recent testing zone
2. ~4,300 USD/oz — major psychological and technical barrier
🟢 Key Support Levels
1. ~4,240 USD/oz — short-term support
2. ~4,200 USD/oz — psychological & technical support area
📊 EMA & Trend
• EMA09: Price is hovering around the EMA09, showing a neutral / sideways structure with no clear breakout.
📉 Candlestick / Volume / Momentum
• Short-term charts show narrow ranges and divergence in buying/selling pressure — momentum remains weak as gold consolidates ahead of major data.
________________________________________
📌 Outlook
Gold may continue to move within a tight range or see a light pullback if it fails to break above the ~4,280 level. A strong breakout and sustained move above 4,300 USD/oz would signal a clearer short-term bullish trend.
________________________________________
💡 Trade Ideas
🔻 SELL XAU/USD: 4,282 – 4,285
🎯 TP: 40 / 80 / 200 pips
❌ SL: ~4,288.5
🔼 BUY XAU/USD: 4,242 – 4,245
🎯 TP: 40 / 80 / 200 pips
❌ SL: ~4,238.5

Gold Intraday Trading Plan 12/12/2025Gold rose as expected from 4205 yesterday and reached 4285, breaking 4250 resistance. I am expecting it to retest 4250 again and rise from there. My first target is 4307, send target 4336, final target 4367

12.11 Gold (Euro-US Session) - Bearish Trading PlanHello traders,
Core Logic: Fed's hawkish rate cut suppresses gold; bearish sentiment dominates.
I. Bearish Drivers
Key factors for gold weakness:
• Dovish Hopes Crushed: Fed signals only 1 more 2025 cut, dashing easing cycle expectations.
• Policy Uncertainty: Powell's "patient" tone + 3 dissents (most since 2019) boost caution.
• Profit-Taking: "Buy rumor, sell fact" triggered Asian session pullback, extending bearishness.
II. Key Levels
Type Level Rationale
Short Entry 4215-4220 1H EMA13 + rebound resistance
Key Resistance 4227 Asian session pre-dive peak
TP1 4172 Short-term core support
TP2 4153 Medium-term support
TP3 4143 Recent range low support
Stop-Loss 4242 Above intraday high
III. Trading Strategies
1. Primary: Short on Rebound
Enter short at 4218-4220 (4215-4220 range with bearish candles: engulfing/long upper wicks).
• TP Plan: 4172 (cut 40%) → 4153 (cut 40%) → 4143 (close 20%)
• SL: 4242
2. Secondary: Short on Breakdown
Enter short at 4198-4200 if gold breaks 4200 (with 30%+ volume surge).
• TP: Same as primary (4172→4153→4143)
• SL: 4215
IV. Core Risk Rules
• Max position per trade: ≤5%; no averaging down
• Trigger SL → exit immediately; no SL adjustments
• If gold closes above 4242 for 15 mins: close all shorts, no new trades
• Avoid positions during US data/Fed speeches
V. Key Notes
1. Follow Fed-driven trend; use tech levels for entry/exit.
2. Close positions early if price spikes through TPs.
3. Valid for Dec 11 Euro-US session; adjust for market structure changes.
Good Luck!
LESS IS MORE!

GOLD (XAUUSD) – Major Breakdown Setup FormingGOLD (XAUUSD) – Major Breakdown Setup Forming
Bias: Strong Bearish (Medium to Long Term)
Structure: Multi-Quarter Symmetrical Triangle → Bearish Resolution Expected
Potential Downside Target: 3400 – 3420
1. Pattern Overview
Chart shows a large symmetrical triangle forming at the top:
Lower highs from the all-time high → indicating declining momentum.
Higher lows, but weaker than demand normally seen in strong trends.
A compressing structure, which usually leads to a violent breakout.
This specific triangle structure—after a massive parabolic rise—is statistically more likely to break downward.
The market is:
Losing momentum at every new high
Creating sharp rejection wicks
Failing to sustain impulses above resistance
All of this supports expectation of a massive fall.
2. Why a Fall Toward 3400 Is Logical
Downside target of 3400 aligns with multiple technical factors:
A. Height of Triangle Projection
Measure of triangle height ≈ 500–550 USD.
If breakdown occurs near 3900–3950,
then the projected target becomes:
3950 – 550 = 3400 approx.
3. Price Action Confirmations (Already Visible)
Massive rejection candle near triangle top
Repeated long-wick failures
Momentum divergence on higher timeframes
Volatility compression before breakout
Compression → Expansion.
The expansion here is highly likely to be downward.
Final View
Gold is preparing for a very large bearish move.
The symmetrical triangle at the top suggests the market is exhausted, and the next major impulse is downward.
Target of 3400 levels is:
Technically correct
Mathematically projected
Liquidity-confirmed
Perfectly aligned with triangle breakdown rules
Supported by price action weakness
This is a high-probability medium-term bearish setup.
Disclaimer
This analysis is for educational purposes and not investment advice. Please manage risk carefully.

FOMC WILL DEFINITELY CLEAR LIQUIDITY BOTH WAYS a buy at 4199-95, sl at 4185 and tp at 4140 but that will be holding till FOMC and we could see a sell again to clear liquidity below to 4165 area after a push up to clear liquidity first

OUTLOOK XAUUSD 1H Analysis (10th December 2025)Hey Guys, This is just a trade idea and not a financial advise
BUY/SELL SCENARIOS:
BUYS:
1) Body Candle Close above the 4216.13 level.
2) Retest the 1H Bullish CHOCH at the 4216.13 level.
3)Create a 3/5m Bullish Engulfing Candle to capitalise on BUYS towards the 4264.50 level.
SELLS:
1) Body candle close below the 4201.12 level.
2) Retest the 1H Bearish CHOCH at the 4201.12 level.
3) Create a 3/5m Bearish Engulfing Candle to capitalize on SELLS towards the 4163.50 level.
Trade Smart, Trade according to trading plan.

The latest trading signals have been released.Yesterday our signal slipped and hit the SL.
Today we’re still looking to short, aiming around 4150.
The 4220 area is the best zone to load up on shorts—just wait for the market to chop a bit, and the payoff should be solid.

Gold Is Setting a Trap — The Real Move Comes After the LiquidityMarket Analysis — XAUUSD (H1)
1. Current Price Structure
- The market previously created a series of Higher Highs (HH) and Higher Lows (HL) → bullish order flow.
- After the last HH, the price showed multiple CHoCH events → early signs of a shift from bullish to bearish structure.
- Current consolidation is forming around 4,207 – 4,210, with price struggling to regain bullish conviction.
- A rising dotted trendline represents the last support of short-term buyers — once broken, bearish momentum strengthens.
2. Liquidity Zones
- Upper liquidity zone: 4,225 – 4,230 → where you expect price to sweep before reversal.
- Key support: 4,181 – 4,183 → first downside liquidity zone.
- Major target liquidity zone: 4,163 – 4,165 → final liquidity cluster before deeper bearish continuation.
3. Today’s Primary Scenario
This matches the green projection drawn on your chart:
🔹 Main Scenario (Bearish Continuation After Liquidity Sweep)
Price is likely to:
- Push upward to retest the 4,225 zone → sweep liquidity and create a final LH.
- Reject strongly → break the rising trendline.
- Drop into 4,181 → first liquidity target.
- Minor pullback → forming a reactionary LH.
- Continue down toward 4,163 → completing the corrective leg.
This aligns perfectly with the market structure + liquidity logic in your chart.
4. Market Psychology
- Buyers are weakening: repeated CHoCH + BOS bearish signals.
- Liquidity is building above and below → ideal for manipulation before expansion.
- Narrow movement before news = accumulation phase.
- Smart money likely pushes up first, then aggressively sells into trapped buyers.
5. Intraday Strategy Guidance
📌 SELL Setup (High Probability)
Sell Zone: 4,225 – 4,228
TP1: 4,181
TP2: 4,165
SL: 4,232
This aligns perfectly with your chart projection.
📌 BUY Setup (Low Probability – Countertrend)
Buy Zone: 4,163 – 4,166
TP: 4,178 – 4,185
SL: 4,158
⚠️ Notes
• Recent BOS patterns favor continuation to the downside.
• Avoid chasing trades in the middle of liquidity zones
Stay patient — the market always pays those who wait for the right setup, not the fast setup.

XAU/USD H1 Plan: SELL at OB, BUY at Liquidity1. Market Structure (H1)
Gold is in a corrective phase after breaking the previous upward structure. From the nearest peak, the price continuously creates downward BoS waves, confirming that selling pressure is in control in the short term.
Currently, the price is moving within a descending channel and retesting the trendline multiple times but has not been able to breakout. This supports the scenario of the price continuing to complete a deeper decline to gather liquidity before forming a major recovery wave.
2. Important technical zones on the chart
🔹 OB – Sell Zone: 4,190 – 4,197
Confluence of Fibonacci 0.5 – 0.618 of the most recent decline.
This is the H1 supply zone where the price previously broke the downward structure → prioritize observing SELL when the price retraces.
🔹 Liquidity Buy Zone: 4,154 – 4,163
Liquidity cluster located just below the nearest bottom.
This is the area where the market is likely to create a liquidity sweep before reversing upwards.
🔹 Deep Liquidity Zone: 4,115 – 4,12x
Deep liquidity zone, confirmed by multiple old bottoms formed since the beginning of the month.
If the price is pushed down here, this will be a very strong BUY zone for the next major recovery wave.
3. Trading scenarios according to structure – clear & easy to follow
🔸 Scenario 1 – SELL from OB 4,19x (main scenario)
Activation conditions:
Price retraces to OB Sell zone 4,19x
Appearance of reversal signals M15–H1: strong rejection candles, ChoCH down, engulfing
Targets:
TP1: 4,163 (Liquidity)
TP2: 4,154
TP3 extended: 4,12x – 4,115
Note: This OB zone is a beautiful confluence – if the price reacts strongly, there is a high chance the market will complete the decline according to the model.
🔸 Scenario 2 – BUY according to Liquidity Sweep (priority after SELL)
After completing the decline to liquidity zones:
BUY Zone 1: 4,154 – 4,163
Wait for bottom sweep & ChoCH up → BUY according to recovery wave
BUY Zone 2: 4,115 – 4,12x (strongest Buy)
If the price breaks through the Liquidity zone 4,15x
This is the zone where the largest buying force may appear → expect to create a new H1 bottom
Targets for both BUY zones:
TP1: 4,195 (OB Sell retest)
TP2: 4,210
TP3 extended: 4,23x – 4,24x
Further: 4,25x – 4,27x (Fibo 1.272 – 1.618)
4. Important notes & risk management
Do not BUY when the price is standing in the descending channel – wait for sweep & confirmation.
SELL is only valid when the price hits exactly OB 4,19x, avoid FOMO selling in the middle of the zone.
BUY is invalid if H1 breaks deeply below 4,110.
Strong upward scenario only activates when H1 closes above 4,200.

Brainiak | Gold forming short term Pull-Back?After price managed to break above 4240 yesterday, which had been acting as a cap for a while, it still failed to break 4264. That leaves price stuck within the 4163–4264 range, and this type of behavior is basically sideway in nature.
From a wave-theory perspective, this kind of structure is usually a formation phase that prepares the market to continue its previous trend (unless it turns into a Late Confirmation, which I’m honestly tired of because it takes forever to verify the ending).
If on Monday price reacts around 4194 and holds (forms a HL), the upside is still valid. Whether it can break 4264 is something we’ll need to judge again from the structure. But one thing is clear: if it holds, we can trade it. I’ll be waiting for setups around this zone as well.
If price drops below the area I’m watching, it should ideally find support near 4164 and not much lower, to maintain a clean continuation setup.

Elliott Wave Analysis XAUUSD – Week 3 of December 2025
1. Momentum
Weekly (W1):
Weekly momentum is approaching the overbought zone. There is a high probability that in the coming week, W1 momentum will enter the overbought area and start showing signs of a bearish reversal.
Daily (D1):
D1 momentum is currently in the overbought zone and preparing to turn down. We need confirmation from a clear bearish D1 candle. Once confirmed, the market is likely to enter a corrective move lasting approximately 4–5 days.
H4:
H4 momentum has already turned bearish. However, it still needs around 2–3 more H4 candles to reach the oversold zone, indicating that short-term downside momentum remains intact.
2. Elliott Wave Structure
Weekly Timeframe (W1)
On the weekly chart, wave X (purple) appears to be in its final phase. Price is currently trading near the base of wave W, suggesting a high probability that this structure is forming a flat correction.
Key characteristics of a flat pattern:
- Price can retrace back to the origin of wave W.
- It may even exceed the W low/high and create a marginal new extreme.
- However, this breakout is typically limited before price reverses to complete wave Y.
In the current context, weekly momentum has not yet confirmed a bearish reversal. Therefore, the possibility of one final upward push in wave X cannot be ruled out before a larger decline begins.
Daily Timeframe (D1)
On the daily chart, wave X (purple) is developing as an ABC structure. At present:
- The red wave C has already completed a 5-wave internal structure.
- Price is now trading within the green wave 5 of wave C.
With D1 momentum already in the overbought zone, there is a high probability that green wave 5 is nearing completion. Once this wave ends, price is expected to decline to form wave Y.
However, an important caution remains:
- D1 momentum has not yet confirmed a bearish reversal.
- Therefore, attempting to catch the exact top of wave X carries risk.
- As discussed on the weekly timeframe, flat corrections can allow price to equal or slightly exceed the wave W level before reversing.
H4 Timeframe
Looking more closely at the H4 structure:
- The 5-wave sequence (1–2–3–4–5 in green) within the red wave C has completed.
- Wave 5 reached its projected target near 4334, after which price started to decline sharply.
H4 momentum still requires 2–3 candles to reach oversold conditions, suggesting:
- The current bearish leg still has room to extend.
- The most probable scenario is a continuation lower toward the POC zone (green line) around 4215 – 4187, followed by a corrective bounce.
If this scenario unfolds:
- The current decline is likely forming wave 1 down of a new 5-wave structure for wave Y.
- The subsequent recovery would be wave 2, typically unfolding as an ABC corrective move.
- This wave 2 rally would provide a high-probability sell opportunity, especially if H4 momentum rebounds into the overbought zone again.
3. Key Notes & Risk Awareness
One critical point to emphasize:
- Weekly momentum is preparing to enter the overbought zone and potentially reverse.
- Daily momentum is already overbought.
- This momentum confluence suggests that the coming decline could be more extended, aiming to push weekly momentum back toward oversold conditions.
In practice, weekly momentum often requires multiple oscillations (commonly around three reversals) to complete a full corrective cycle. Therefore:
- Patience is essential during this phase.
- Avoid prematurely adopting a long-term bullish bias.
- Always wait for price action confirmation.
This analysis represents a directional warning and scenario planning only. All expectations must be confirmed by real-time price behavior.
4. Conclusion
For the upcoming week, the primary bias favors a bearish corrective phase.
Detailed trading plans (entries, stop loss, and targets) will be updated daily as new price data becomes available.

Gold Just Paused at a Strange Level What is Coming Nex🔹 MARKET BRIEFING – XAU/USD (1H)
Market State:
– Price has broken out of the short-term consolidation, followed by a clean retest structure forming right at the breakout zone a classic continuation signal.
Key Levels from Chart:
– Entry Zone: around the retest area just above 4280–4286
– Stop Loss: 4262 – 4264
– Take Profit 1: 4317
– Take Profit 2: 4381
Next Move:
– As long as price holds above the SL zone and respects the breakout retest structure, XAU/USD is positioned for a continuation leg toward 4317, with potential extension toward 4381.

Gold? This week + Recap
Hi,
Hope you had a good run.
I didn't run up all the way. Took profit along the way up.
Still was a good move.
So this week I see as continuation still and may be new high coming this week.
NB: (JUST)
No new bullish setup yet.
Still early of the week.
I will keep in mind.
A> This is a bullish week.
B> Patience
Or small entry first
All the best
Not a guru

XAUUSD POSSIBLE SELL!XAUUSD had a good chance of returning to order block and possibly selling off from that zone. Just in the later hours of New York session on Friday, we saw how price significantly dropped after reaching a high of 4351. From the H1 perspective I’m still looking forward to seeing price drop from 4333

XAU - Potential False Breakout Before Correction in Bearish FlagI expect a move toward the upper boundary of the bearish flag, with a possible false breakout before the market begins a deeper correction.
Upside targets are $4,450–$4,500, while the potential downside correction zone lies around $3,850–$3,800.

Gold (XAUUSD) - 12 Dec | Pullback to Key POIs in Focus🟡 Gold (XAUUSD) Analysis – 12 December
Hello Disciplined Traders,
Welcome to the Chart Is Mirror Community 👋
Market Context
• Gold continues in strong bullish momentum .
• In yesterday’s session, the H4 previous swing high 4264.6 was taken out, along with the M15 previous swing high 4247.8 , confirming bullish continuation on both timeframes.
• After this breakout, a healthy pullback is expected before the next leg upward.
Key Observations
• Our first POI for short-term long setup is the 4244.8–4230 OB zone .
If price pulls back into this zone and we get LTF bullish confirmation , we will plan our long setup accordingly.
• Our second POI is a high-probability, strong demand zone at 4198.7–4182.1 .
This zone is unmitigated and sits just below the recent HL at 4204, making it a key reaction level.
If price reaches this zone with LTF confirmation , we will plan our long setup from here.
Execution Plan
• Observe price reaction at 4244.8–4230 first.
• If invalidated, wait patiently for price to approach the deeper 4198.7–4182.1 demand zone.
• Maintain bullish bias while M15 structure remains intact.
• No confirmation, no entry.
Structure reveals the direction — confirmation reveals the timing.
📘 Shared by @ChartIsMirror
Important Note*
Over the next month, due to Christmas and New Year period, market conditions may become choppy and unpredictable. Price action may not form cleanly, and setups may fail more frequently. Trade cautiously, manage risk strictly, or consider staying on the sidelines until around 15 January 2026 for smoother conditions.


XAU/USD Daily OutlookXAU/USD Daily Outlook – Price Still Favors a Retracement Before Any Bullish Continuation
Gold continues to trade inside a corrective structure on the H1 chart, with price reacting strongly from the demand zone around 4161–4170, which represents a strong low in the current bullish leg. Despite the latest bounce, market structure still leans bearish as long as the short-term lower-high sequence remains intact.
The chart highlights a clear Break of Structure (BOS) to the downside, followed by a liquidity sweep and a weak reaction toward the mid-range. This suggests that the market may test deeper liquidity pools before forming a high-probability long setup.
Key Technical Zones
Resistance Levels
4198 – 4205: Nearest intraday resistance and imbalance fill.
4220 – 4235: Fibonacci 61.8% retracement + previous CHoCH zone.
4250 – 4260: Higher-timeframe supply, weak high still intact.
Support Levels
4170 – 4161: Fresh demand zone and strong low (key structure).
4148 – 4155: Liquidity pocket below equal lows.
4135 – 4140: Final support before a structural shift on H4.
Trendline & EMA Context
Price is currently trading below the EMA20 and EMA50, confirming short-term bearish momentum.
The descending trendline from the recent swing high remains intact, suggesting the market may retest this trendline before continuing downward.
Fibonacci Confluence
Measured from the swing high to the recent low:
38.2% Fib → 4198 area (first reaction point)
61.8% Fib → 4225 zone (major sell interest)
This aligns with prior BOS and CHoCH areas — a strong confluence for possible bearish continuation.
Intraday Bias: Bearish Retracement
Current structure favors a move toward 4198 – 4205 to rebalance inefficiency before the next potential bearish leg toward 4161. If this strong low breaks, deeper liquidity targets become exposed.
Trading Strategies
1. Sell-the-Retracement Strategy
Sell Zone: 4198 – 4205
Stop Loss: Above 4212
Targets:
TP1: 4175
TP2: 4161
TP3: 4150
This setup aligns with EMA resistance, trendline touch, and Fibonacci confluence.
2. Break-and-Retest Long Setup
Trigger only if price protects the strong low at 4161.
Entry Zone: 4165 – 4170
Stop Loss: 4155
Targets:
TP1: 4198
TP2: 4220
TP3: 4235
This only activates if the market confirms bullish intention with a CHoCH on lower timeframes.
Market Outlook
Gold remains in a corrective phase. Liquidity beneath the strong low is key. As long as price trades below the 4220 supply zone, bearish retracement setups offer better risk–reward. Monitor how the market reacts around 4198; this level will define the direction for the rest of the session.

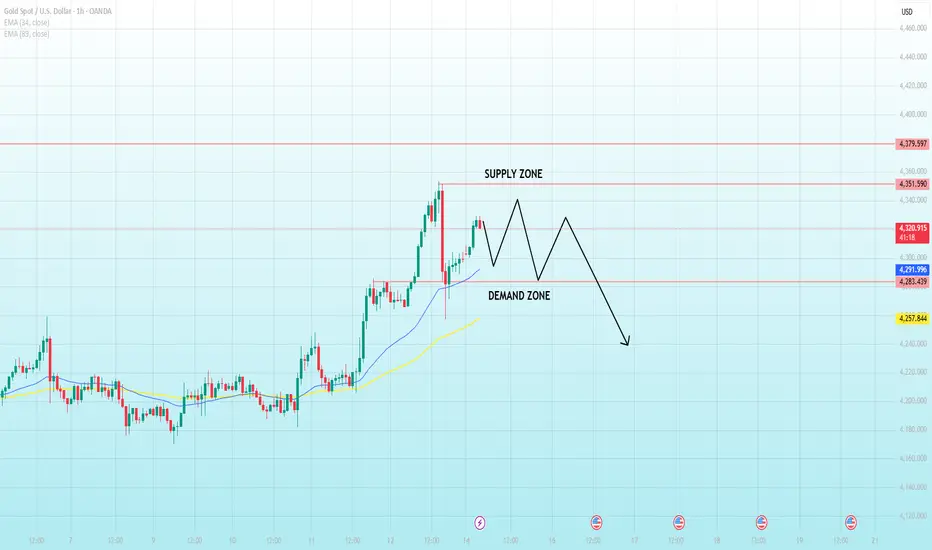
Strong impulse, now hesitation - is gold pausing....Market context
Gold printed a strong impulsive leg from the 4,240–4,260 base, accelerating into the 4,350–4,360 supply area before facing a sharp rejection. Since then, price has transitioned into consolidation, holding above the prior breakout region rather than unwinding the entire move.
This behavior suggests short-term balance after expansion, not immediate trend failure.
Current structure
- Supply zone: ~4,350–4,360, where the impulsive leg was capped
- Range mid / current price: ~4,320–4,330
- Demand zone: ~4,280–4,290, aligned with the last breakout and rising EMA support
Price remains above the rising EMA 34 (~4,292) and EMA 89 (~4,258), keeping the intraday structure constructive despite the loss of momentum. Candles are overlapping, reflecting indecision and rotational flow rather than directional commitment.
Scenarios
➡️ Primary scenario:
If buyers continue to defend the 4,280–4,290 demand area, price may remain rotational before attempting another push toward the 4,350–4,360 supply zone.
⚠️ Risk scenario:
A sustained break below 4,280, followed by acceptance under the EMA structure, would weaken the bullish bias and expose a deeper pullback toward the 4,240–4,250 liquidity area.
XAUMO WEEKLY REPORT🎬 XAUMO WEEKLY REPORT
“The Big Short… but it’s Gold, and Everyone’s Acting Innocent”
Spot Gold: ~4300
Mood: Everyone says “nothing’s wrong”
Reality: Something’s always wrong
Disclaimer: Educational only. This is not a trade signal.
If you lose money, don’t look at me like Steve Carell did.
────────────────────────────────────────
SCENE 1: THE GATES
(Also known as: Where the market pretends price discovery exists)
UPPER GATES – SUPPLY / DISTRIBUTION
U1: 4305–4337
→ This is where price goes to die… repeatedly.
Everyone buys the breakout.
Institutions sell them the breakout.
Everyone is shocked. Again.
U2: 4379–4381
→ The “decision shelf”.
Translation: either we squeeze shorts…
or dump on retail with surgical precision.
U3: 4428–4473
→ If price gets here, CNBC will call it “strong demand”
even though the selling started 20 dollars earlier.
LOWER GATES – DEMAND / RELOAD
D1: 4259–4237
→ The classic “nothing to see here” reload zone.
Looks scary.
Isn’t.
Unless it accepts. Then it really is.
D2: 4194–4154
→ Where long-term money actually wakes up.
Also where Twitter declares the bull market dead.
D3: 4137–4007
→ If we’re here, someone blew up quietly on a Friday.
RULES (No one follows them, but here they are):
- Accept above U1 → continuation possible
- Accept below D1 → liquidity vacuum, fast drops, no apologies
────────────────────────────────────────
SCENE 2: MACRO CALENDAR
December Edition: “Thin Liquidity, Thick Lies”
- US CPI
- Retail Sales
- Central Banks saying a lot without saying anything
December logic:
Less liquidity
More stop runs
Faster reversals
Everyone blames “algorithms”
Holiday effect:
The book is thin.
The wicks are long.
Your stop is food.
────────────────────────────────────────
SCENE 3: CROSS-ASSET CHECK
(The part where correlations pretend to work)
- Equities: down, but not screaming
- VIX: up, but not panicking
- Dollar: firm
- Yields: rising and annoying
Translation:
Gold can spike on fear,
but it won’t trend unless the dollar chills out.
So expect drama without commitment.
────────────────────────────────────────
SCENE 4: FUTURES STRUCTURE
GC1 vs GC2 (Because structure tells the truth, not price)
We’re in mild contango.
That’s normal.
No stress.
No emergency.
If contango compresses or flips?
Someone’s in trouble.
And they’re not tweeting about it.
────────────────────────────────────────
SCENE 5: FIB LEVELS
(The numbers traders swear by and still lose money on)
Key pivot: ~4304
Support ladder: 4295 → 4289 → 4283
Upside supply: 4318 → 4323 → 4337
Meaning:
Price is boxed.
Everyone’s impatient.
Liquidity loves impatience.
────────────────────────────────────────
SCENE 6: MULTI-TIMEFRAME DRAMA
Lower TFs:
“Let’s rally!”
Higher TFs:
“Relax. We’re distributing.”
Daily:
Still selling strength.
Weekly:
Still suspicious.
Conclusion:
Classic stop-hunt week.
Nobody gets paid for being early.
────────────────────────────────────────
SCENE 7: ICHIMOKU (Simplified for sanity)
Forget the cloud.
Treat 4305–4337 as the line of truth.
Above and accepted?
We talk continuation.
Below?
It’s all theatrics.
────────────────────────────────────────
SCENE 8: VWAP
(The only adult in the room)
- Above VWAP + defended → quick longs
- Below VWAP + defended → quick shorts
Key word: QUICK.
December does not reward commitment.
────────────────────────────────────────
SCENE 9: BIAS SCORECARD
(Because confidence should always be uncomfortable)
Weekly bias: Bear-tilted retest
Daily bias: Sell rallies
Intraday: Trying to be bullish, failing politely
Conviction:
~55%
That’s not confidence.
That’s “I know something’s wrong but can’t prove it yet”.
────────────────────────────────────────
SCENE 10: MAGNETS
(Where price goes after the lie is exposed)
If bulls win:
4379 → 4428 → 4473
If bears win:
4237 → 4194 → 4154
Then 4137 → 4007 if liquidity disappears like 2008 promises
────────────────────────────────────────
SCENE 11: SESSIONS
(Because time zones matter more than opinions)
Tokyo:
Mean reversion and fake breaks.
London:
Real liquidity test.
New York:
Where stop hunts go to graduate school.
────────────────────────────────────────
SCENE 12: LIQUIDITY MAP
(Where dreams go to get stopped out)
Buy-side stops:
Above 4337, then above 4380
Sell-side stops:
Below 4295, then 4283, then 4237
Expected behavior:
Sweep one side.
Pause.
Then decide.
────────────────────────────────────────
FINAL SCENE: THE BIG SHORT MONOLOGUE
“Look, I might be early…
but I’m not wrong.
The price is lying.
Liquidity is thin.
And acceptance matters more than direction.”
Translation:
Don’t trade the middle.
Don’t marry a bias.
Wait for acceptance.
Get paid quickly.
Respect the tail risk.
December isn’t about being right.
It’s about surviving the credits.
— End Scene —
Educational commentary.
Market structure & liquidity behavior.
Not financial advice.

Gold (XAUUSD) – 10 Dec | Watching Demand Zone 4194–4189🟡 Gold (XAUUSD) Analysis – 10 December
Hello Disciplined Traders,
Welcome to the Chart Is Mirror Community 👋
Market Context
• Gold continues in strong bullish momentum . After sustaining the 4274.8 HL level , the M15 major market structure remains bullish .
• In yesterday’s session, we also saw internal structure shift + break of structure (BoS) to the upside , confirming bullish continuation.
Key Observations
• For intraday structure, price is currently trading within the range of:
– LL: 4189.505
– HH: 4221.625
• We have a strong M15 demand zone 4194.7–4189.5 . A pullback into this zone is expected before potential continuation upward.
Execution Plan
• If the market retests 4194.7–4189.5 before breaking the HH 4221.625, and the zone is respected with LTF bullish confirmation , we will plan our long setup accordingly.
• Maintain bullish bias as long as M15 structure holds.
• The next upside target for continuation is 4238 .
Let confirmation validate the zone — structure will guide the direction.
📘 Shared by @ChartIsMirror
