XAUUSD How to become successful in forex and stock trading: 1.Master fundamentals and technical analysis. 2,Build and follow a solid trading plan. 3.Apply strict risk management (1–2% rule). 4.Stay disciplined—control fear and greed. 5.Record and analyze every trade. 6.Focus on high-quality setups only. 7.Diversify across assets and markets. 8.Keep evolving—study, adapt, and grow daily.
Trade ideas


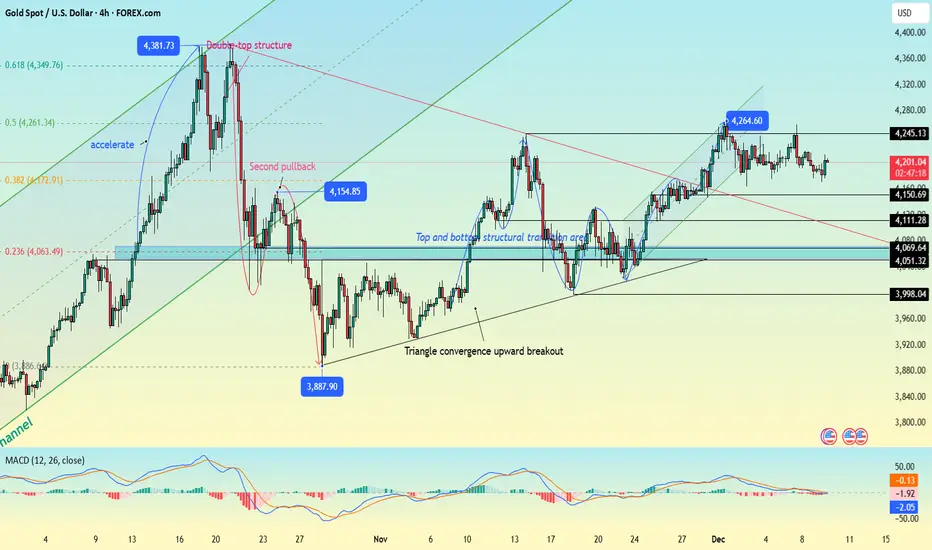
Long XAUUSD"After a pullback and a corrective move into the predefined zones (fibo as Order Blocks, FVGs, or key support levels), the price may regain bullish momentum and continue its upward trend."

GOLD Resistance Ahead!
HI,Traders !
#GOLD keeps growing
In a strong uptrend and
is locally overbought
So after hits the
Horizontal resistance level
Around 4366.94 we will
Be expecting a local
Bearish correction !
Comment and subscribe to help us grow !

GoldXAUUSD
- Fibonacci Level - 361.80%
- Fair Value Gap
- Completed " 123 " Impulsive Waves
- Break of Structure
- Symmetrical Triangle as an corrective pattern in Long Time Frame

XAU-USDFor today, the lower-timeframe gold has a divergence on the 15-minute chart 🕯
To confirm this, the line I marked needs to be broken, which is at the price of 4238 ⭕️
If this level is broken, there will be a sell signal 🚨🔽

XAUUSD: rise to all-time high🛠 Technical Analysis: On the 4-hour timeframe, gold (XAUUSD), after breaking out of accumulation in a wide triangle, continues to show signs of bullish momentum. Analysis suggests a high probability of a final upward push or even a potential "false breakout" (liquidity capture) to the resistance zone around 4,400 to liquidate early short positions. A downward reversal around 4,400 can be considered if appropriate signals are present.
———————————————
❗️ Trade Parameters (BUY)
———————————————
➡️ Entry Point: Buy on the confirmed breakout of the short-term resistance 4,286 (approx. 4294)
🎯 Take Profit: 4,377.47
🔴 Stop Loss: 4,249.74
⚠️ Disclaimer: This is a potential trade idea based on current analysis; market conditions and price direction are subject to change based on news factors and volatility.

Gold Buy around 4247. target 4280 to 4295Gold Market Analysis:
Yesterday's gold price movement perfectly matched our expectations. If you review yesterday's blog post, the candlestick chart perfectly mirrored our analysis. We placed buy orders near 4209, 4210, and 4207, achieving a 10-game winning streak. The 4209 level was publicly announced beforehand. Currently, it seems this level might be a new bottom. The Fed's interest rate cuts provide long-term support for gold. Yesterday's Asian session pullback was merely a technical correction, so we maintained our buy stance. Furthermore, the drone attack on Moscow further boosted gold to 4285. Looking at the daily chart, 4300 presents significant resistance, necessitating a technical pullback. Today, Friday, is also the weekly closing date. Avoid chasing the market today; wait for support before buying. Gold's movement yesterday was quite large, and today's Asian session requires some consolidation. Minor support has reached 4247. The current 5-day moving average on the daily chart is around 4234, and yesterday's top was around 4238. Therefore, in the Asian session, we should focus on buying opportunities at these two levels. If it breaks 4204, the outlook will be bearish; if it breaks 4219, the market will likely change direction, and you shouldn't blindly buy then. That's how the market works: if you're right about the direction, you can make money even if you buy randomly; if you're wrong about the direction, it's hard to make money no matter how well you find the right entry point.
Resistance: 4285 and 4299; Support: 4247 and 4234; 4247 is the key level for market strength/weakness.
Fundamental Analysis:
The Fed's interest rate decision was in line with market expectations. The rate cut didn't bring much surprise to the market, except for the official announcement of further rate cuts in 2026, which was somewhat unexpected. In the long term, this will put downward pressure on the dollar and support gold.
Trading Recommendation:
Gold – Buy around 4247, target 4280-4295

XAUUSD Rocket full ! Quick 19 point Grabafter s strong move Dec 11, XU has dominated the dollar agressivaly.
we all saw that move.
therefore, we are going in and out.
Trading a Dynamic, you must adjust Not to the Move itself but adjust to what everyone thinking after seeing that move.

Gold Stalls Near 4,200 USD Ahead of the Fed MeetingGold is entering a sensitive phase as technical structure signals strong compression, while macro news continues to create a wait-and-see sentiment ahead of the upcoming Fed meeting.
From a technical perspective, the Volume Profile paints a very clear picture: the 4,220 USD area is a major resistance, as this is where heavy volume accumulated — a zone where sellers previously appeared in force and continue to exert pressure. In contrast, the 4,180 and 4,200 USD zones act as key support levels, with trading activity showing that buyers are still fairly active there. At the same time, the Fair Value Gaps around these price levels remain unfilled, providing a technical cushion for potential retests before a new trend forms.
Given the current context, the most realistic short-term scenario is continued consolidation around 4,200 USD, with 4,220 acting as an upper “firewall” and 4,180 serving as a reliable floor. In the broader outlook, if the Fed confirms a rate-cut cycle, the 4,280–4,300 target range is well within reach. Conversely, a more hawkish tone could trigger a pullback before gold resumes its larger bullish trend.

XAUUSD Here are two key areas to watch on XAU today. Please note that this is for reference only. Always trade according to your own analysis.

XAUUSD, Expecting Down from 4228 AreaXAUUSD, I am Expecting Gold Down from 4228 Area with the SL of 4249 with TP 4163.
Good luck

Gold Stalls at 4195, Awaiting BreakoutGold is currently trading around 4195 and moving sideways after the recent decline, showing that the market is still waiting for a clear breakout signal.
Technical Outlook:
The price is stuck between 4188–4202, indicating consolidation. Buyers are defending the lower zone, while sellers are still dominating below 4205. A breakout from this range will likely determine the next directional move.
Market Bias:
Gold is neutral-to-bearish as long as it stays below 4205.
Trading Strategy (Short-Term):
🔻 SELL XAU/USD
Entry: 4198 – 4202
TP: 40 / 80 / 200 pips
SL: 4206
🔺 BUY XAU/USD
Entry: 4188 – 4191
TP: 40 / 80 / 200 pips
SL: 4184

My people who is ready to BuyWe have a support zone on that yellow line I’ve put . It’s a lot of buy orders in that area so get ready to grab some buys. I am not so good at explaining but I hope gerrit 😊

XAUUSD is in sell zone!Daily support is broken with London breakdown on XAUUSD. FOMC could trigger a massive liquidity towards downside to retest the weekly low. There is potential for rate cut, which in turn can cretate increased volume in GOLD. As current lower timeframe market structure shows bearish price action, we may eventually see a bounce off the weekly support level for long term bullish bias.

XAUUSD M15 false brake out? This is a different set of rules from previous set up.!
4215.0 sell limit.
5 points for. 1:1 ratio.
Monitory M15 behaviors movements for the next hour or so.!

XAUUSD Asia volume pump.! 5 Point IdeaContinuing from Yesterday volume,
Opening of Dec 10 strong.
A 1:1 opportunity of 5 points.
This is a Day trade Idea 💡
Note, it has not created a daily low just yet.
Keep an eye on behavior before London opens.

Latest Gold Price Trading Strategies:
Current Market Background
This week, market focus is centered on the upcoming Federal Reserve interest rate decision, which will be the final rate announcement of 2025 and is expected to have a decisive impact on gold trends. Market expectations for the timing of rate cuts have already shifted from March to May, strengthening the correlation between the US dollar and gold prices. Meanwhile, geopolitical tensions such as the Russia-Ukraine conflict and Middle East tensions continue to provide safe-haven support for gold. Additionally, easing global trade sentiment and attention on US economic data are influencing short-term demand for gold.
Technical Analysis
Overall Pattern
The intraday trend shows a slight oscillation with a downward bias, indicating an overall sideways consolidation phase.
Although gold previously broke below the double-bottom support at 4175, it did not continue declining to the prior low of 4163 or the 4150 level. Instead, it rebounded, suggesting underlying buying support.
Key Levels
Upper Resistance: 4220-4230 (short-term), 4245-4255 (trendline resistance)
Lower Support: 4180-4190 (short-term), 4175 (double bottom), 4163 (prior low)
Trend Logic
Historical data indicates that gold prices often rally ahead of Federal Reserve interest rate decisions.
The current decline may represent a bear trap, setting the stage for a pre-decision rally.
Until the consolidation range is decisively broken, chasing highs is not advisable. A buy-on-dips approach is recommended.
Today's Trading Strategy
Operational Approach
Primary Strategy: Buy on pullbacks
Secondary Strategy: Sell on rallies near resistance
Specific Strategies
Long Strategy (Buy)
Entry Zone: Around 4180-4190 (staggered entry)
Stop Loss: 8-10 USD
Target: 4210-4220
Breakout Extension: If gold decisively breaks above the 4230 resistance, consider adding to positions with targets at 4245-4255.
Short Strategy (Sell)
Entry Zone: Around 4220-4230 (staggered entry)
Stop Loss: 8-10 USD
Target: 4210-4200
Breakdown Extension: If support at 4190 is breached, further downside toward 4180 and below is possible.
Key Observation Points
4230 Breakout: A decisive break above this level would confirm short-term strength, allowing for additional long positions.
4245-4255 Zone: This area represents resistance formed by connecting previous downtrend highs. A breakout here would signal the start of a daily-chart rebound.
4180-4190 Support Zone: This is a critical defense line for bullish sentiment. A break below would weaken the short-term outlook.
Risk Warnings
Fed Decision Risk: The Wednesday announcement may trigger significant volatility. Consider light positions or staying sidelined ahead of the decision.
Strict Risk Control: Always use stop losses and avoid holding losing positions against the trend.
Position Management: Adjust position sizes according to individual risk tolerance.
Flexibility: Adjust strategies promptly if key price levels are breached.
Summary and Recommendations
Adopt a sideways-to-bullish bias for today, focusing on entering long positions in the 4180-4190 zone. If gold stabilizes above 4230, the rebound is likely to extend further. Given the cautious market sentiment ahead of the Fed decision, employ a disciplined approach with staggered entries and strict stop-loss management.

Gold unable to break resistance despite silver surgeing to $60 While silver is catching all the attention today after breaking to above $60 for the first time ever, gold has been quite quiet.
The yellow precious metal is biding its time ahead of the FOMC rate decision tomorrow, with traders bracing for a potentially hawkish cut i.e., no major commitments to further cuts in 2026.
Technically speaking, gold remains in a bullish trend, but momentum is certainly fading and that raises some questions about the outlook.
The $4175/90 zone is the immediate area to watch, where the bodies or lows of the last few trading days have been made. A clean break below this area would bring the $4100 level back into focus, a natural round number and the origin of the most recent upswing. A daily close beneath that level would be a decidedly bearish development for gold, opening the door to a retest of $4000.
On the topside, resistance sits around $4220 to $4270 area — the zone from which gold sold off previously and one the market has failed to reclaim on multiple attempts. The bulls will need to clear this area convincingly if the metal is to make another push towards fresh highs.
By Fawad Razaqzada

Reversal SetupThe chart shows XAUUSD price action moving between a clearly defined Resistance Zone (around 4195–4200) and a Support Zone (around 4182–4185).
Price has recently fallen into the Support Zone, where buyers have previously reacted strongly.
The blue curved arrow indicates a potential bullish reversal, expecting the price to bounce from the support area and move back toward the Resistance Zone above.
This setup highlights a range-bound market, where traders look for buying opportunities near support and selling pressure at resistance

Gold Market Analysis: Gold Prices Rise and Fall Ahead of US JOLTGold Market Analysis: Gold Prices Rise and Fall Ahead of US JOLTS Data, Entering a Volatile Pattern
Market Overview 🌍 On Tuesday (December 9th) in late Asian trading, the US dollar index held steady around 99.10, while spot gold prices suddenly fell sharply from their intraday high of nearly $4200/oz📉, currently trading around $4171/oz, exhibiting a typical rise and fall pattern. The market focus for today shifts to the US labor market data to be released later in the day, especially the JOLTS job openings report, which is closely watched by the Federal Reserve. This data will be a key variable influencing short-term gold price movements 🔑
Fundamental Drivers 📈
1️⃣ Key Data Preview ⏳ The US Bureau of Labor Statistics will release the October Job Openings and Labor Turnover Survey (JOLTS). The market expectation is 7.199 million, continuing the moderate downward trend from previous data. Since reaching a record high of 12.18 million in March 2022, JOLTS job openings have mostly trended downwards, reflecting a gradual balancing of the labor market.
📊 Data Impact Analysis:
⬇️ If the actual data is lower than expected, it may strengthen market expectations of an earlier Fed shift, putting downward pressure on the dollar and boosting gold. 🚀
⬆️ If the data is higher than expected, it may support the continued strength of the dollar, putting downward pressure on gold prices. ⚖️
2️⃣ Macroeconomic Policy Background 🏦
💡 Fed Interest Rate Decision Imminent: The Fed's final interest rate decision of 2025 will be held early Thursday morning. The market generally expects interest rates to remain unchanged, but the focus will be on the hints about the future policy path in the post-meeting statement. Current market expectations for the first rate cut have been postponed from March to May, a process that directly affects the dollar's trajectory and gold pricing.
🌐 Geopolitical Support: The ongoing geopolitical tensions, including the Russia-Ukraine conflict and the situation in the Middle East, continue to provide safe-haven support for gold🛡️, limiting its downside potential.
Technical Analysis 📉
📅 Daily Chart Pattern: Gold is currently in a range-bound trading pattern, without a clear breakout direction. Key Price Levels Analysis:
🛑 Resistance Levels:
$4230/oz: Key short-term resistance level; a breakout could trigger a new round of gains 🚪
$4245-$4255/oz: Resistance area formed by connecting previous downtrend highs; significant resistance on the daily chart ⛰️
🛡️ Support Levels:
$4180-$4190/oz: Key short-term support area 🛡️
$4175/oz: Neckline of a double bottom pattern
$4163/oz: Previous low support
$4150/oz: Important psychological level 💭
⚡ Short-Term Trend Analysis: Gold prices rebounded quickly to around $4200 after touching support near $4170, indicating strong buying support below 💪. The current market characteristics are consistent with the typical consolidation pattern before interest rate decisions—the market tends to maintain range-bound trading before major events, and historical data shows that gold prices often rise to some extent before the announcement of the decision. 🔍 Technical Analysis: Gold is currently trading within the 4170-4230 range in the short term. The failure to continue the downward trend after breaking the double bottom at 4175, instead rebounding quickly, suggests insufficient downward momentum. Considering historical price action patterns before the Fed decision, the current pullback may be a false breakout 🎣.
Trading Strategy Recommendations 💼
🎯 Trading Approach
Main Strategy: Primarily buy on dips, secondarily sell on rallies 🔄
Core Logic: Market sentiment is cautious ahead of the interest rate decision, but historical patterns support buying on dips 📜
⚙️ Specific Strategy Layout
🟢 Long Position Strategy:
📍 Entry Area: Enter in batches around $4190-$4195/oz
📊 Position Management: Recommended total position size not to exceed 20%
🚫 Stop-Loss Setting: Below $4180/oz
🎯 Target Price:
First Target: $4210-$4220/oz
Second Target: $4230/oz (Upside potential to $4245-$4255 after a breakout) 🔝
🔴 Short Position Strategy:
📍 Entry Timing: Consider shorting in batches with light positions when the price rebounds to the $4218-$4200/oz range.
🚫 Stop-Loss: Above $4226/oz
🎯 Target Price: $4210-$4200/oz, break above to $4190 ⬇️
👁️ Key Observation Points
🔓 Validity of the $4230 Breakout: If the price breaks through this level effectively, it can be considered a short-term strengthening signal, and you can consider adding to your long positions. 🚀
💪 Support Strength at $4175: If this level is tested again and held, it will strengthen the judgment of a range-bound pattern.
⛰️ Key Resistance at $4255: This area is a crucial watershed for determining whether a daily-level rebound can begin. 🌊
⚠️ Risk Warning and Trading Discipline
📅 Data Risk: JOLTS data tonight may cause significant volatility. It is recommended to reduce positions appropriately before the data release. ⚡
🎭 Event Risk: The Fed's interest rate decision on Thursday is the core event of the week, and the market may make a directional choice before and after the decision. 🏁
💰 Position Management: Strictly control positions within the recommended range and avoid over-leveraging. ⚖️
🛡️ Stop-Loss Discipline: Always set stop-loss orders and never hold losing positions, especially in volatile markets before major events. 🚨
📝 Summary: Gold is currently in a typical consolidation phase before the interest rate decision. Technically, the 4170-4230 range-bound pattern is intact, while fundamentals are influenced by both US economic data and Fed policy expectations. Trading is recommended to be range-bound, focusing on buying opportunities on pullbacks, while also paying attention to trend opportunities arising from breakouts at key price levels. Investors should closely monitor the JOLTS data tonight, as this data may set the tone for market sentiment before the decision. 🎯
XAUUSD H4 | Bullish Bounce Off Overlap SupportMomentum: Bullish
Price is currently above the ichimoku cloud.
Buy entry: 4,163.66
- Overlap support
- 38.2% Fib retracement
- 78.6% Fib projection
Stop Loss: 4,111.85
- Overlap support
- 61.8% Fib retracement
Take Profit: 4,219.19
- Swing high resistance
High Risk Investment Warning
Stratos Markets Limited (tradu.com/uk ), Stratos Europe Ltd (tradu.com/eu ):
CFDs are complex instruments and come with a high risk of losing money rapidly due to leverage. 70% of retail investor accounts lose money when trading CFDs with this provider. You should consider whether you understand how CFDs work and whether you can afford to take the high risk of losing your money.
Stratos Global LLC (tradu.com/en ): Losses can exceed deposits.
Please be advised that the information presented on TradingView is provided to Tradu (‘Company’, ‘we’) by a third-party provider (‘TFA Global Pte Ltd’). Please be reminded that you are solely responsible for the trading decisions on your account. Any information and/or content is intended entirely for research, educational and informational purposes only and does not constitute investment or consultation advice or investment strategy. The information is not tailored to the investment needs of any specific person and therefore does not involve a consideration of any of the investment objectives, financial situation or needs of any viewer that may receive it. Past performance is not a reliable indicator of future results. Actual results may differ materially from those anticipated in forward-looking or past performance statements. We assume no liability as to the accuracy or completeness of any of the information and/or content provided herein and the Company cannot be held responsible for any omission, mistake nor for any loss or damage including without limitation to any loss of profit which may arise from reliance on any information supplied by TFA Global Pte Ltd.

XAUUSD – Strong Intraday Rebound as Price Reclaims Key LevelsGold shows a sharp intraday recovery on both the 15m and 5m charts after reclaiming the $4,200–$4,202 zone, flipping it back into support. Buyers stepped in aggressively, pushing price above short-term EMAs and challenging the 200-EMA on the 15m chart.
🔹 Key Technical Highlights
Strong bullish volume spike confirms a momentum shift.
Price has broken above intraday resistance and is stabilizing above $4,202.
On the 5m chart, price reclaimed VWAP and continues forming higher highs.
As long as Gold stays above $4,198–$4,202, bullish continuation remains favored.
🔸 Levels to Watch
Support: $4,198 / $4,202
Resistance: $4,210 → $4,218
📌 Bias: Bullish Above $4,202
Momentum favors buyers with potential for further upside if the structure holds.
