Selena | XAUUSD 2H — Bullish Continuation SetupFOREXCOM:XAUUSD
Market Overview
Price has built liquidity through multiple sweeps and consolidations, suggesting a possible continuation phase. If price retests the demand zone and holds, buyers may step in to push toward upper structure resistance levels.
Key Scenarios
✅ Bullish Case 🚀
If price holds above 4,157 zone
→ 🎯 Target 1: 4,300
→ 🎯 Target 2: 4,375–4,400 (major resistance / channel top)
❌ Bearish Case 📉
Break and close below 4,052 invalidation zone
→ 🎯 Downside Target: 4,000–3,950 support range
Current Levels to Watch
Resistance 🔴: 4,300 | 4,375–4,400
Support 🟢: 4,157 | 4,122 (demand zone)
Invalidation ⚠️: 4,052
⚠️ Disclaimer: This analysis is for educational purposes only — not financial advice.
Trade ideas

Gold successfully broke above 4245 to 4260-4264 ...but ...Gold Outlook — Monday 08-Dec-2025 & The Week Ahead
GoldRider — Detailed Weekly Update
Last close: $4,197 (week ended with clear fight between bulls & bears).
Note: Price probed above 4220-4230-4245 last Monday and reached $4,264 and did it again last Friday and touched 4260 but failed to secure a clean daily close above that zone — this is the key nuance for next directional bias.
Reminder: Do not trade immediately at open. Let the market settle 30–60 minutes. Holiday gaps and low liquidity create noisy opening swings.
1) Macro & Geopolitical Drivers (what matters this week)
The macro picture is largely similar to last week — this week’s trigger is Fed day (Wednesday).
Wednesday — Fed rate decision & Powell press conference.
The actual rate move is mostly priced in; the market will trade the tone of Powell. Expect fast, high-impact moves (20–30 USD spikes) on the prints and Q&A.
U.S.–Russia/Ukraine talks: ongoing, no realized settlement yet. Any real progress would be strongly bearish for gold (risk-off unwinds).
Venezuela tensions: Trump’s comments + FAA warnings — bullish for gold as geopolitical risk picks up.
U.S. government-shutdown risk: currently paused but remains a tail risk (could re-ignite in January); neutral for now.
Bottom line: Macro mix = large positive + large negative + neutral = market remains balanced — Powell’s words and clean technical breaks will decide the next leg.
2) Technical Readings — Monthly → Weekly → Daily → 4H
Monthly
December week 1 range: 4264 – 4163 (100 USD width).
Current candle body tight: 4221 – 4198; upper wick ~43 USD, lower wick ~35 USD → balance between bulls & bears ahead of Fed.
Key upside cluster: 4220 → 4232 → 4245 → 4260–4265 → then 4300 if broken decisively.
Key downside: 4164 → 4121 → 4086.
Weekly
Recent weekly closes (summary):
10-31: Close 4002 (High 4109 / Low 3886)
11-07: Close 4001 (H 4030 / L 3928)
11-14: Close 4085 (H 4245 / L 4004)
11-21: Close 4065 (H 4132 / L 3997)
11-28: Close 4215 (H 4226 / L 4040)
12-05: Close 4198 (H 4264 / L 4163)
Notes: Price remains above all major weekly EMAs (10/20/50/100/200) — longer-term structure intact bullish.
Weekly MA10 ~ 4037 = first defense.
Weekly MA20 ~ 3850 = deeper support.
Decision band: 4220–4230 = gateway for further upside. Reclaiming 4245 (third-time break in December) would confirm stronger bullish momentum.
Daily
Bulls face a hard resistance at 4210–4212 market failed to close daily above it (three consecutive attempts).
Strong daily supports near 4180, 4144, 4030.
Tactical rules: Buy above 4210; sell below 4190.
4-hour
The 4H shows sellers forcing price under EMA10 (~4211) in the last 3 candles — that’s the technical reason for the “failed close” narrative.
Trade signals: Buy only above 4212; sell only below 4190. Between those levels is “fog” — higher risk for fakeouts.
3) Trade Plan — Monday (preferred: wait 30–60 mins)
Bull Case (Long)
Entry: Above 4206 (risk from 4201). Confirm strength by closing above 4210–4212.
Targets: 4213 → 4218 → 4228 → 4236 → 4244 → 4255 → 4264 → 4274 → 4285 → 4300.
Bear Case (Short)
Entry: Below 4184 (risk from 4188).
Targets: 4176 → 4172 → 4167 → 4160 → 4150 → 4144 → 4136 → 4130 → 4121.
Risk advice: spacing between targets is tight; lock partial profits frequently and respect stop-losses.
4) Final Notes & Conduct
If you find value, a share/comment helps the channel grow.
Disclaimer: This is a personal technical and macro view, not financial advice. Trading carries risk. Decisions are your responsibility.
Wishing everyone a profitable week — GoldRider
#Gold #XAUUSD #GoldRider #GoldAnalysis #TechnicalAnalysis #WeeklyOutlook #Forex #MarketUpdate #GoldTrading

GOLD Is Very Bearish! Sell!
Please, check our technical outlook for GOLD.
Time Frame: 9h
Current Trend: Bearish
Sentiment: Overbought (based on 7-period RSI)
Forecast: Bearish
The market is approaching a key horizontal level 4,198.77.
Considering the today's price action, probabilities will be high to see a movement to 4,117.75.
P.S
Please, note that an oversold/overbought condition can last for a long time, and therefore being oversold/overbought doesn't mean a price rally will come soon, or at all.
Like and subscribe and comment my ideas if you enjoy them!

Gold Trade Plan 02/12/2025Dear Traders,
The price has entered a support zone, and I expect it to rise to the 4260 and 4300 levels this week.
Regards,
Alireza!

Gold Surges on Weak US Data but Momentum FadesHello everyone,
Last night, spot gold on the international market saw a sharp rally of several dozen dollars per ounce after the US released a series of economic reports that came in weaker than expected — particularly labour market data, which strengthened expectations that the Fed may accelerate its rate-cutting path. This is generally positive for gold, as lower interest rates reduce the opportunity cost of holding non-yielding assets.
However, shortly after the breakout, the market witnessed a large wave of profit-taking from institutional investors, causing gold to reverse and drop sharply.
The downside pressure did not come solely from profit-taking; it was also reinforced by a US economic backdrop showing mixed and increasingly unstable signals: weak employment data, slowing growth prospects, and rising expectations of imminent Fed rate cuts. These factors have left capital flows uncertain — torn between holding gold for safety or shifting toward risk assets as US equities recover slightly.
From my perspective, gold is now standing at a critical crossroads:
Weak US data could support another upward leg.
A dovish Fed remains a strong underlying foundation.
But persistent profit-taking may prolong the short-term correction.
Gold’s next move will depend heavily on upcoming US economic releases this week and how the market reacts to shifting expectations around the Fed’s monetary policy.
Wishing everyone a clear-headed and successful trading day ahead!
Gold: Bullish Fundamentals, but Technicals Still Blocking the BOHello everyone, gold continues to gain support from macro data after the ADP report showed a surprise loss of 32,000 private-sector jobs, strengthening expectations of a 0.25% Fed rate cut in the December meeting. This normally benefits gold as USD and yields cool down.
However, the chart still refuses to confirm any breakout. Price remains compressed inside 4,195–4,205 with low volume, sitting right on the Ichimoku cloud. Overhead resistance/FVG 4,215–4,225 and support at 4,180 keep price locked in a tight 4,180–4,225 range.
Ahead of today’s PCE data, gold is likely to stay boxed in until the market receives a stronger catalyst from PCE or the Fed.

XAUUSD H1 | Bullish Bounce Off SupportMomentum: Bullish
Price is currently above the ichimoku cloud.
Buy entry: 4,225.37
- Pullback support
- 38.2% Fib retracement
Stop Loss: 4,215.10
- Swing low support
Take Profit: 4,241
- Multi-swing high resistance
High Risk Investment Warning
Stratos Markets Limited (tradu.com/uk ), Stratos Europe Ltd (tradu.com/eu ):
CFDs are complex instruments and come with a high risk of losing money rapidly due to leverage. 70% of retail investor accounts lose money when trading CFDs with this provider. You should consider whether you understand how CFDs work and whether you can afford to take the high risk of losing your money.
Stratos Global LLC (tradu.com/en ): Losses can exceed deposits.
Please be advised that the information presented on TradingView is provided to Tradu (‘Company’, ‘we’) by a third-party provider (‘TFA Global Pte Ltd’). Please be reminded that you are solely responsible for the trading decisions on your account. Any information and/or content is intended entirely for research, educational and informational purposes only and does not constitute investment or consultation advice or investment strategy. The information is not tailored to the investment needs of any specific person and therefore does not involve a consideration of any of the investment objectives, financial situation or needs of any viewer that may receive it. Past performance is not a reliable indicator of future results. Actual results may differ materially from those anticipated in forward-looking or past performance statements. We assume no liability as to the accuracy or completeness of any of the information and/or content provided herein and the Company cannot be held responsible for any omission, mistake nor for any loss or damage including without limitation to any loss of profit which may arise from reliance on any information supplied by TFA Global Pte Ltd.

Dec 8, 2025 - XAUUSD GOLD Analysis and Potential Opportunity📊 Summary:
The 4260 resistance proved strong, and the daily close fell back below 4200. This pullback appears to be driven by profit-taking.
If price trades above 4200, bulls still have strength.
But if price breaks below 4192, bearish momentum will increase significantly.
🔍 Key Levels to Watch:
• 4260–4265 – Resistance zone
• 4241 – Resistance
• 4230 – Resistance
• 4220 – Resistance
• 4205 – Resistance
• 4192 – Intraday key support
• 4182 – Support
• 4174 – Support
• 4164 – Support
• 4154 – Support
📈 Intraday Strategy:
SELL: If price breaks below 4192 → target 4286, with further downside toward 4182, 4179, 4174
BUY: If price holds above 4208 → target 4211, with further upside toward 4215, 4220, 4224

gold going long!! but not yetmy thoughts on gold is that we are going to continue bullish momentum but first we need a slight pull back . gold already confirmed a change of character when it slightly broke the previous highs last week around 4260 . that is also at a daily supply area and price is once again showing weakness once reaching that area. I see gold pushing back down to 4087 which would create relatively equal highs at that supply area. once price rejects 4087 we can anticipate buys up to 4377 area.

Gold further downside next weekGold price had closed below 5 day moving average for the past 3 days, this would be a sign for further downside. This is also the third time the gold price is unable to break above 4250 area.
There should be further attempts to try to break above, in the mean time, momentary retracement should be on the cards next week.
This retracement might be to gather further strength to break to the upside later.
Trading strategy -> continue to buy on dip, control small lot size.

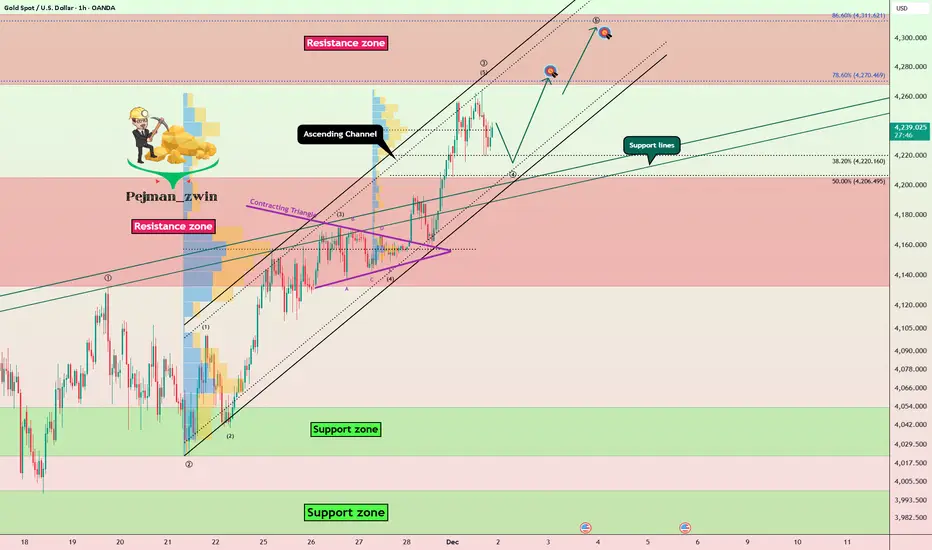
Gold Awakens: Sharp Pullback but Outlook Remains BrightFrom a technical perspective, gold is currently moving within a parallel ascending channel, showing a clear bullish momentum with a rhythm that is hard to ignore. The price recently bounced away from the resistance area, indicating a typical overbought reaction. At the moment, the market is approaching the lower boundary of this projected channel, an area considered important. The convergence of several technical support levels in this zone is likely to attract renewed buying interest.
I expect the price to rebound toward the 4,250 area, which aligns with the mid-channel region. The bullish momentum may not appear immediately. The situation could develop into a consolidation phase, a false decline, or even a sudden acceleration.

Gold Spot Analysis – Strong Sell Zone & High-Probability TargetsThe current price action on Gold Spot (USD) reveals a very strong SELL ZONE between 4257–4287, marked by repeated rejection wicks and heavy resistance. This zone has historically triggered sharp reversals, and the recent bearish candle confirms renewed selling pressure.
📉 Downside Targets – All Within Reach:
Target 1: 4136–4148 – Minor support, likely to break under sustained pressure.
Target 2: 4054–4079 – Intermediate zone, ideal for short-term profit-taking.
Main Target Zone: 3669–3741 – This is the best zone for long-term investment, offering deep value and historically strong accumulation. Price action here often signals macro reversals and long-entry setups.
Given the strength of the sell zone and the momentum shift, all target zones are highly achievable. Traders should monitor volume and confirmation signals closely as price approaches each level.

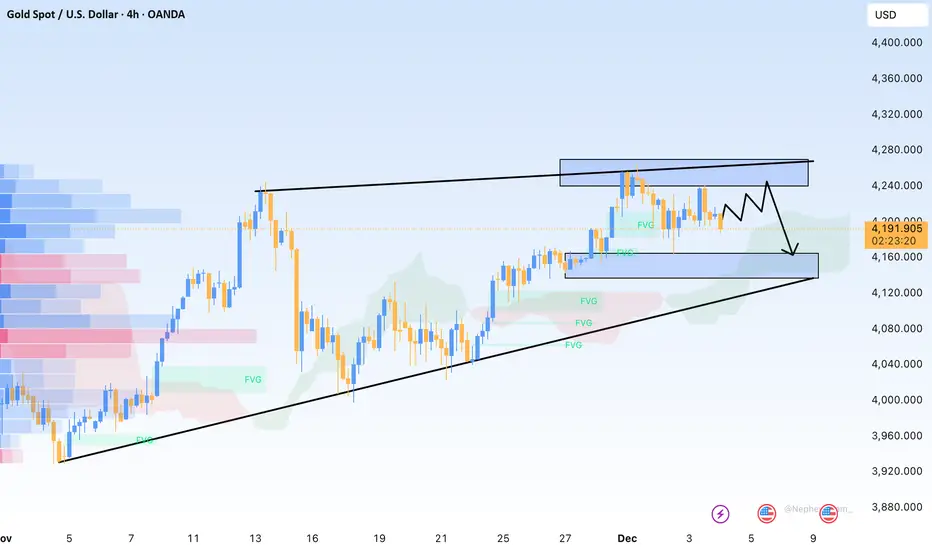
Gold Breakout + Wave Structure = New Targets LoadingGold( OANDA:XAUUSD ) has successfully broken through the Resistance zone($4,205 – $4,133) at the start of this new week, and over the past ten trading days, it seems to have formed an ascending channel.
From an Elliott Wave perspective, it looks like gold has completed wave 3 and is currently in the process of completing wave 4.
I expect that after a pullback toward the Resistance zone($4,205 – $4,133)—aligning with the lower line of the ascending channel and the support lines—gold will resume its upward movement and once again target the Resistance zone($4,316 – $4,261).
First Target: $4,266
Second Target: $4,294
Stop Loss(SL): $4,151
Note: Geopolitical tensions—especially the possibility of a direct confrontation between Venezuela and the U.S.—tend to push investors toward safe-haven assets, and gold historically reacts with strong upward momentum during such uncertainty. If this conflict escalates, increased risk aversion and volatility across global markets could support a bullish continuation in gold as capital shifts away from risk assets
💡 Please respect each other's opinions and express agreement or disagreement politely.
📌 Gold Analyze (XAUUSD), 1-hour time frame.
🛑 Always set a Stop Loss(SL) for every position you open.
✅ This is just my idea; I’d love to see your thoughts too!
🔥 If you find it helpful, please BOOST this post and share it with your friends.
Gold (XAUUSD) forecast for next weekThis is my view of Gold next week. Overall trend is bullish but there are smaller setups (both bearish and bullish if market were to close at the levels indicated by the arrows. Proper risk and trade management is key!!

XAUUSD ON TRENDLINE 4194XAUUSD ON TRENDLINE 4194
H1 timeframe gold running in trendline now gold on trendline support
if gold taking same trendline then our target 4228 4254
if break of trendline then gold will bearish
This is not financial advice , Chart is for Educational analysis only

Elite | XAUUSD 15m – Bullish Continuation SetupOANDA:XAUUSD
After sweeping liquidity beneath major support, the market broke downward structure and initiated a bullish correction phase. The breakout above internal range highs and the descending trendline confirms a bullish shift, supported by strong demand rejections. Price is now trading above reclaimed structure and targeting the upper liquidity zone toward $4,256 – $4,260.
Key Scenarios
✅ Bullish Case 🚀
Hold above the re-test demand zone:
🎯 Target 1: $4,230
🎯 Target 2: $4,256 – $4,260 (final liquidity objective)
❌ Bearish Case 📉
Only active if price breaks and closes below $4,210
🎯 Downside Target: $4,170 (previous accumulation level)
Current Levels to Watch
Resistance 🔴: $4,230 / $4,260
Support 🟢: $4,218 / $4,170 / $4,150
⚠️ Disclaimer: This analysis is for educational purposes only. It is not financial advice.

Gold Eyes 4,207 Rebound as USD Softens & Venezuela Tensions RiseHey Traders, in today’s trading session we are monitoring XAUUSD for a potential buying opportunity around the 4,207 zone. Gold continues to trade within a broader uptrend, and the current pullback is bringing price into a key support–resistance confluence aligned with the ascending trend structure.
Fundamentals:
The US Dollar remains under pressure, with markets increasingly leaning toward a dovish shift from the Federal Reserve, reinforcing gold’s classic negative correlation with the USD. A softer Dollar environment typically boosts demand for metals, and this week’s macro flow continues to point in that direction.
At the same time, geopolitical tensions between the U.S. and Venezuela are escalating, increasing global uncertainty and driving markets toward safe-haven assets. Gold is already reflecting this risk premium, and any further escalation could accelerate flows into XAU.
Next Step:
We’re watching price reaction closely around 4,207 for a potential continuation of the broader bullish structure.
Trade safe,
Joe.

Accumulated price increase - bulls expect rate cut⭐️GOLDEN INFORMATION:
Expectations of further Fed rate cuts and inflation still above target continue to underpin gold and silver, said David Meger, director of metals trading at High Ridge Futures.
However, China’s physical gold demand has weakened at elevated price levels, which could weigh on the metal. According to the Financial Times, major retail chains have scaled back their presence in mainland China this year, while smaller sellers report that soaring prices and higher taxes have severely hurt sales.
⭐️Personal comments NOVA:
Gold price took H1 4193 breakout liquidity and reacted bullishly, still maintaining the uptrend, continuing to expect December rate cut
⭐️SET UP GOLD PRICE:
🔥SELL GOLD zone: 4274 - 4276 SL 4281
TP1: $4260
TP2: $4245
TP3: $4230
🔥BUY GOLD zone: 4145 - 4143 SL 4138
TP1: $4160
TP2: $4175
TP3: $4190
⭐️Technical analysis:
Based on technical indicators EMA 34, EMA89 and support resistance areas to set up a reasonable BUY order.
⭐️NOTE:
Note: Nova wishes traders to manage their capital well
- take the number of lots that match your capital
- Takeprofit equal to 4-6% of capital account
- Stoplose equal to 2-3% of capital account

Gold - Coiling price action = Energy buildup!The Gold remains in a bullish trend, with recent price action showing signs of a breakout within the broader uptrend.
Support Zone: 4193 – a key level from previous consolidation. Price is currently testing or approaching this level.
A bullish rebound from 4193 would confirm ongoing upside momentum, with potential targets at:
4284 – initial resistance
4313 – psychological and structural level
4350 – extended resistance on the longer-term chart
Bearish Scenario:
A confirmed break and daily close below 4193 would weaken the bullish outlook and suggest deeper downside risk toward:
4161 – minor support
4134 – stronger support and potential demand zone
Outlook:
Bullish bias remains intact while the Gold holds above 4193. A sustained break below this level could shift momentum to the downside in the short term.
This communication is for informational purposes only and should not be viewed as any form of recommendation as to a particular course of action or as investment advice. It is not intended as an offer or solicitation for the purchase or sale of any financial instrument or as an official confirmation of any transaction. Opinions, estimates and assumptions expressed herein are made as of the date of this communication and are subject to change without notice. This communication has been prepared based upon information, including market prices, data and other information, believed to be reliable; however, Trade Nation does not warrant its completeness or accuracy. All market prices and market data contained in or attached to this communication are indicative and subject to change without notice.

Is Gold Setting Up a Swing Rally?XAU/USD Accumulation Highlights🏆 XAU/USD "GOLD VS U.S DOLLAR" - Metals Market Opportunity Blueprint 📊
Swing Trade | Bullish Wyckoff Accumulation 💎
📍 MARKET SETUP
Asset: XAU/USD (Gold vs U.S. Dollar)
Timeframe: Swing Trade (4H-Daily)
Pattern: Bullish Wyckoff Accumulation Phase ✅
Market Structure: Accumulation Zone Identified 🎯
🎯 ENTRY STRATEGY - LAYERING METHOD ("THIEF STRATEGY")
Multiple Limit Order Entry Points:
Using the Layering Strategy - Scale in with multiple limit orders at different levels for optimal position management.
Layer 1 Entry: $3,960 (33% Position Size) - First Entry Point 🔵
Layer 2 Entry: $4,000 (33% Position Size) - Second Entry Point 🟢
Layer 3 Entry: $4,040 (34% Position Size) - Third Entry Point 🟡
📌 NOTE: You can increase/adjust layers based on your risk tolerance and capital allocation. Flexibility is key to the Thief Strategy.
⛔ STOP LOSS
Recommended SL Level: $3,880 (Below Accumulation Base)
Risk Per Trade: Adjust based on your personal risk management strategy
⚠️ DISCLAIMER: This is NOT a recommendation. Adjust your stop loss according to YOUR OWN STRATEGY and RISK TOLERANCE. Your capital, your rules. 🛡️
🚀 PROFIT TARGET
Primary Target: $4,360 (Strong Resistance + Overbought Zone)
Key Resistance Levels:
⚡ Strong resistance confluence zone
Overbought signal indicates profit-taking zone
Be cautious of potential reversal traps near target
💰 DISCLAIMER: This is NOT a recommendation for exit points. Secure profits based on YOUR OWN RISK MANAGEMENT. Take gains when you're comfortable. 📈
📊 RELATED PAIRS TO MONITOR (CORRELATION ANALYSIS)
🔴 INVERSE CORRELATION (Move Opposite to Gold)
TVC:DXY (U.S. Dollar Index) 📉
When DXY strengthens → XAU/USD weakens
When DXY weakens → XAU/USD strengthens
KEY POINT: Monitor DXY weakness as bullish trigger for gold rally
FX:EURUSD 💶
Strong negative correlation with gold
Euro weakness = Gold strength (Flight to Safety)
Watch for Euro breakdown below key support levels
🟡 POSITIVE CORRELATION (Move Together)
OANDA:XAGUSD (Silver vs USD) 🔗
Typically moves 70-80% correlated with gold
KEY POINT: Confirms broader precious metals strength
If XAGUSD breaks resistance, XAU/USD usually follows
FX:GBPUSD (British Pound vs USD) 🏴
Weak positive correlation with gold
Weak GBP = Risk-off sentiment = Gold demand rises
Watch for GBP weakness as confluence signal
🔵 MACRO DRIVERS TO WATCH
US Treasury Yields (10Y, 2Y) 📊
Higher yields = Lower gold attractiveness
Lower yields = Higher gold demand
CRITICAL: Monitor Fed announcements & rate expectations
SP:SPX (S&P 500) 📈
Risk-on sentiment weakens gold demand
Risk-off sentiment strengthens gold
Market crashes = Gold surges (Safe Haven)
⚡ CONFLUENCE SIGNALS FOR THIS SETUP
✅ Bullish Confluence When:
DXY shows weakness/breakdown
XAGUSD confirms precious metals strength
Moving Averages align bullishly
Wyckoff accumulation phase completing
⚠️ Invalidation Signals:
Break below $3,880 SL (Accumulation base failure)
Strong DXY rally
Risk-on market rally (Equities surge)
💡 TRADER'S NOTES
🎯 Best Timing: Scale entries during DXY weakness or Fed pivot signals
📍 Sweet Spot: Layer entries $3,960-$4,040 range for optimal averaging
🛑 Risk Control: Never risk more than 2-3% per trade
💰 Profit Taking: Consider partial profits at each moving average resistance
⚖️ FULL DISCLAIMER
🔹 This analysis is for educational purposes only
🔹 Always conduct your own research & due diligence
🔹 Past performance ≠ Future results
🔹 Manage your risk responsibly
🔹 Your capital, your responsibility, your choice 🛡️
📌#XAU/USD #Gold #Swing Trade #Wyckoff #TechnicalAnalysis #FX #Metals #Trading #DayTrader #Accumulation #LayeringStrategy

Accumulation and recovery - resistance 4275⭐️GOLDEN INFORMATION:
Gold (XAU/USD) extends Tuesday’s rebound from the $4,164 zone in Wednesday’s Asian session, gaining fresh momentum and edging back toward Monday’s two-week high. The metal remains supported by expectations of another Fed rate cut next week, while speculation about a dovish successor to Chair Powell keeps the US Dollar subdued near a two-week low, further boosting the non-yielding asset
⭐️Personal comments NOVA:
Buying power remains above 4200, gold price recovers and grows. The market is waiting for today's ADP-NF results to continue increasing in price.
⭐️SET UP GOLD PRICE:
🔥SELL GOLD zone: 4275 - 4277 SL 4282
TP1: $4260
TP2: $4245
TP3: $4230
🔥BUY GOLD zone: 4193 - 4191 SL 4186
TP1: $4208
TP2: $4220
TP3: $4235
⭐️Technical analysis:
Based on technical indicators EMA 34, EMA89 and support resistance areas to set up a reasonable BUY order.
⭐️NOTE:
Note: Nova wishes traders to manage their capital well
- take the number of lots that match your capital
- Takeprofit equal to 4-6% of capital account
- Stoplose equal to 2-3% of capital account

Gold 1H – Can 4265 Breakout or Trap Into 4185?🟡 XAUUSD – Intraday Smart Money Plan | by Ryan_TitanTrader (02/12)
📈 Market Context
Gold continues its impressive rally as markets price in a potential rate cut by the Federal Reserve in December. Spot gold recently surged — reflecting multi-week highs — as the US Dollar Index (DXY) weakened. The backdrop is increasingly dovish: fading USD strength and rate-cut odds have kept gold bid.
From a technical perspective, price sits compressed at the channel top, signaling liquidity plays before the next institutional leg. Macro tone from Powell’s opening remarks on ForexFactory adds volatility fuel.
🔎 Technical Framework – Smart Money Structure (H1)
Current state = Accumulation / Distribution within rising channel
Liquidity zones & key triggers
• Premium liquidity zone (sell-opportunity): ~4265–4267 (upper-edge pool of liquidity)
• Discount liquidity zone (buy-origin / re-entry zone): ~4186–4184 (demand liquidity near prior displacement base)
• Equilibrium / chop zone: mid-channel compression → no blind trading unless structure validates direction
Expected Smart Money sequence
Sweep → CHoCH/MSS → BOS → Displacement → FVG/OB Retest → Expansion
Gold remains primed for a directional move only after structure confirms intent.
🎯 Trade Plans for Today
🔴 SELL GOLD 4265 – 4267 | SL 4275
• Thesis: Liquidity sweep above equal highs at premium edge, followed by engineered bearish BOS confirming institutional selling intent.
• Entry rules (must wait for confirmation):
✔ Price pokes 4266 zone → bearish CHoCH/MSS + BOS down (M5–M15)
✔ Entry on FVG fill or OB retest after BOS validation
• Targets:
1. 4245 – 4240 (first reaction)
2. 4225 – 4215 (channel EQ retest)
3. 4186 – 4184 (full delivery into discount)
🟢 BUY GOLD 4186 – 4184 | SL 4176
• Thesis: Discount liquidity tap at institutional base, buy absorption after sweep + bullish BOS signaling new intraday demand.
• Entry rules (must wait for confirmation):
✔ Price sweeps 4185 → bullish CHoCH/MSS + BOS up (M5–M15)
✔ Entry on rejection wick + FVG fill or OB retest confirmation
• Targets:
4. 4215
5. 4240
6. 4265+
⚠️ Risk Management & Notes
• Avoid trading inside mid-range without CHoCH/BOS validation — sweeps are traps until proven by MSS + BOS.
• Use SL for structure invalidation only — no averaging in compression.
• Reduce lot size during Powell’s delivery window; macro impulses can run both sides of liquidity fast.
📍 Summary
Gold is coiling at highs for liquidity. Either Powell triggers a 4266 sweep → bearish BOS → delivery, or price hunts 4185 discount → bullish BOS → continuation.
Trade the structure, not the narrative — wait for CHoCH & BOS + retest to unlock expansion.
📌 Follow @Ryan_TitanTrader for daily Smart Money updates.

XAU/USD (Gold) Short Signal EntryXAU/USD (Gold) Short SignalEntry: Sell Limit @ 4195.00 – 4197.00
Target 1: 4165
Target 2 (extension): 4140 – 4130 zone
Stop Loss: 4222 (above the recent swing high) Reasoning: Price rejected hard from the 4200–4212 supply zone
Bearish order block formed on the 15M/1H after the strong drop
Clear lower-high structure on the 4H timeframe
Momentum shifting lower with increasing selling volume
Risk: ~27 points | Reward: ~30–65 points (RR 1:1.1 to 1:2.4+)#XAUUSD #Gold #GoldShort #SellGold #ForexSignals #TradingSignal #TechnicalAnalysis Not financial advice. Trade at your own risk. Always use proper risk management.
