XAUUSD 1H – Symmetrical Compression, Breakout LoadingOANDA:XAUUSD
If price retests trendline and holds 4,185–4,200 zone, a bullish continuation toward upper resistance is expected. A clean breakout above 4,244.572 would confirm strength and open a path to further highs. However, a breakdown through 4,185 → 4,158 exposes demand deeper at 4,112 → 3,999.
Key Scenarios
🔵 Bullish Case (Continuation)
Hold trendline + break above 4,244.572
🎯 Target 1 → 4,263 – prior high range
🎯 Target 2 → 4,280 breakout expansion
🚫 Invalidation if price drops below 4,158
🔴 Bearish Case (If support fails)
Break below 4,185 floor and retest rejection
🎯 Target 1 → 4,158
🎯 Target 2 → 4,112 liquidity zone
🎯 Target 3 → 3,999 extreme sweep
Current Levels to Watch
Support: 4,185 / 4,158
Resistance: 4,244.5
Decision zone = triangle breakout
⚠️ All analysis is educational, not financial advice.
Trade ideas

Gold Eyes 4,207 Rebound as USD Softens & Venezuela Tensions RiseHey Traders, in today’s trading session we are monitoring XAUUSD for a potential buying opportunity around the 4,207 zone. Gold continues to trade within a broader uptrend, and the current pullback is bringing price into a key support–resistance confluence aligned with the ascending trend structure.
Fundamentals:
The US Dollar remains under pressure, with markets increasingly leaning toward a dovish shift from the Federal Reserve, reinforcing gold’s classic negative correlation with the USD. A softer Dollar environment typically boosts demand for metals, and this week’s macro flow continues to point in that direction.
At the same time, geopolitical tensions between the U.S. and Venezuela are escalating, increasing global uncertainty and driving markets toward safe-haven assets. Gold is already reflecting this risk premium, and any further escalation could accelerate flows into XAU.
Next Step:
We’re watching price reaction closely around 4,207 for a potential continuation of the broader bullish structure.
Trade safe,
Joe.

Stop trying to be consistent!Hey @TradingView Community,
If you’ve been trying to be consistent in trading, I get it.
I did the same for years.
But here’s the truth, it’s one of the main reasons traders stay stuck.
Let me explain.
Most traders think consistency means winning every trade.
They want a perfect record, no red days, no losses.
But that kind of consistency doesn’t exist.
Even the best traders in the world have losing trades.
The market is not something you can control.
Some days it’s smooth, other days it’s chaos.
When you try to force it, you end up making emotional decisions and breaking your own rules.
What you really want is steady progress, not perfection.
The best traders don’t try to win all the time.
They focus on showing up, following their plan, and protecting their account during the bad days.
That’s how they survive long enough to win big when the opportunity comes.
That’s exactly what our system is built for — survival and growth.
It’s designed to help you trade calmly, stick to your plan, and stop chasing a perfect track record.
You wanna see what our traders were able to achieve? check our website and read the why us page.
And don't forget WTW 4 Golden rules!
1) Do not jump in
2) Do not over risk/trade
3) Do not trade without Stop Loss
4) Never ever add to a losing position!
Take with care,
Alain M(Coach)
WTW Team

XAU/USD – Intraday AnalysisXAU/USD – Intraday Analysis: Sideways Structure and High-Probability Trade Levels
Gold continues to move inside a clear range-bound structure, respecting both the upper supply zone and the lower demand zone on the H1 timeframe. The chart shows repeated swing rejections at the top of the range, suggesting that buyers are losing momentum while liquidity continues to build above the equal highs.
The market is forming a harmonic zig-zag pattern with lower-timeframe exhaustion signals, and price remains below the 9-EMA, indicating short-term bearish pressure. Until price breaks out convincingly, intraday traders should continue focusing on trading the edges of the range.
Key Technical Levels
Resistance Zone (Sell Zone)
4235 – 4242
This zone has been tapped multiple times with strong rejection wicks.
Liquidity rests above the equal highs, making this area ideal for short setups if price sweeps liquidity and fails to break structure.
Support Zone (Buy Zone)
4168 – 4175
Strong reaction area where buyers defended the range low multiple times.
Watch for liquidity sweep followed by bullish reversal confirmation.
Technical Confluence
1. Trendline Reaction
Price is respecting the descending internal trendline, suggesting continuation of the bearish leg if 4205–4210 fails to break.
2. Fibonacci Confluence
The upper resistance aligns with 0.786 – 0.886 Fibonacci retracement of the previous downswing.
The lower support aligns with the 1.0 – 1.272 Fibonacci extension of the corrective leg.
3. EMA Structure
Price is trading below the 9-EMA, confirming the short-term bearish bias.
EMA acts as dynamic resistance inside the range.
4. RSI Behavior
RSI repeatedly rejects the 60–70 zone, indicating a weakening bullish attempt.
Neutral RSI at mid-range supports the sideways scenario.
Intraday Trading Strategy
Scenario 1 – Sell the Range High (High Probability)
Plan:
Wait for liquidity sweep above 4235–4242
Look for bearish engulfing or BOS (Break of Structure) on M15
Enter short targeting:
TP1: 4205
TP2: 4188
TP3: 4170 (range bottom)
This aligns with the projected pattern on the chart.
Scenario 2 – Buy the Range Low
Plan:
Wait for price to sweep 4168–4175
Enter only if bullish confirmation shows (pin bar, BOS, or bullish FVG fill)
Targets:
TP1: 4200
TP2: 4220
Scenario 3 – Bearish Breakout
If price rejects the upper zone and breaks below 4170, momentum may accelerate downward.
Targets below 4170:
4150
4135
Market Outlook
Gold continues to consolidate, and this phase typically leads to an explosive move. Until a breakout occurs, trading inside the range edges provides the best risk-to-reward setups.
If you find this analysis helpful, save it and follow for more daily strategies and updated market structure insights.

XAUUSD KEY LEVELS 04-11Greetings
Hi traders, This is the crucial support zone for XAU-USD at 15 minute,
based on the movement of the day prior and market trends.
Support zone (White line)
Important levels:
4175.09 is the entry
Target: 4185.09
Stop loss: 4165.09
1:1 Risk-Reward Ratio
We are inspired to continue learning and exchanging ideas by your likes and boosts!

I am bullish on GOLD but still need small correction Gold has tested its previous peak but failed to make a higher high, and has now moved back into its mid-term range. I’m planning to wait for a retest of around 4100, which is the lower boundary of the uptrend, before opening a swing long position.
Gold Forex Trading During Major Economic Events & News Releases
I guess you already noticed how impulsively the markets may react to economic events and news.
In this article, I will teach you a simple strategy to follow during important news release s and how to trade news.
1. Sort out the economic calendar
There are a lot of news in the economic calendar.
They are not equal in their impact.
Most of the economic calendars indicate the potential significance of each event: while some news have low importance, some have medium importance and some are considered to be extremely important.
For example, above is the list of coming UK fundamental news.
You can see that these news have different degree of importance.
My recommendation to you is to sort out the economic calendar in a way, so it would display only the most important news.
Among the news that we discussed above, only one release has high importance.
2. Know on what trading instruments does the news have an effect
While some of the news in the economic calendar may impact many financial markets and trading instruments, some news may affect very particular instruments.
For example, a FED Interest Rate decision may have a very broad effect on financial markets.
At the same time, Interest Rate Decision in Australia may affect only Australia - related instruments.
3. Don't trade one hour before the news and one hour after the release
Once you see the important fundamental news coming, don't trade the trading instruments that can be affected by the new s 1 hour before and after the release.
For example, in 5 minutes we are expecting important UK news - CPI data.
I stopped trading GBP pairs 1 hour before the release of the news, and will resume trading them one hour after the release.
4. Protect your trading positions 5 minutes ahead of the news
If you have an active trading position and related important news are expected, move your stop loss to entry 5 minutes ahead of the release of the news.
For example, I have a short trade on GBPAUD. I see that in 5 minutes important UK data is coming. I will move stop loss to entry 5 minutes ahead of the news and make a position risk-free.
I always say to my students, that news trading is very complicated. Due to a high volatility, it is very hard to make wise decision during the news releases.
The approach that I suggest will help you to avoid all that and trade the markets when they are calm.
❤️Please, support my work with like, thank you!❤️
I am part of Trade Nation's Influencer program and receive a monthly fee for using their TradingView charts in my analysis.

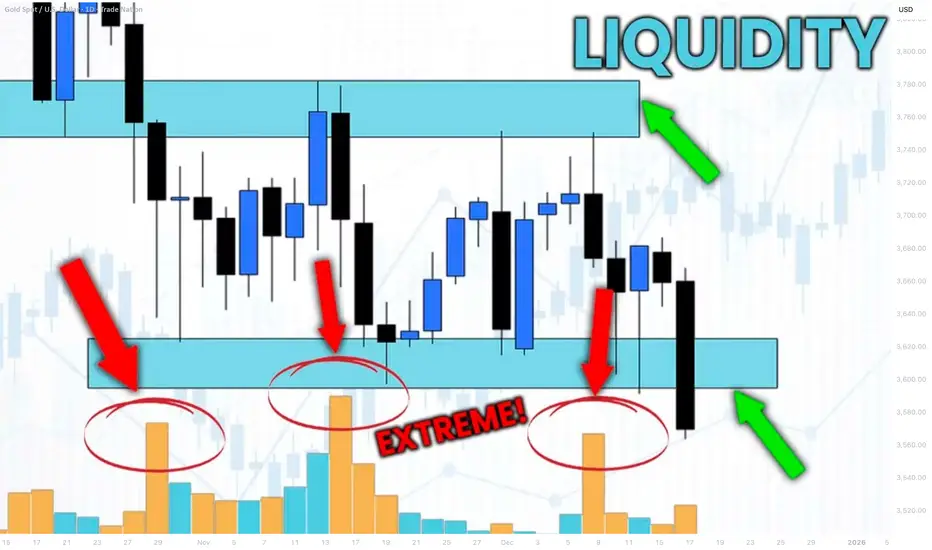
How to Identify Liquidity in Chart with VOLUME Indicator
Smart Money Concept is all about finding the liquidity .
Liquidity analysis is the essential element of profitable trading SMC.
In this article, I will teach you how to use volume indicator to identify liquidity - supply/demand clusters and hidden zones that move the market.
First, let's discuss what exactly we mean by liquidity.
Analysing any forex pair, you should know that orders of the market participants are not equally distributed among all the price levels.
While some levels and the zones will lack the interest of the market players, some will attract huge trading volumes.
We will call such zones - liquidity zones.
To find these zones, you can execute volume analysis.
By using volume indicator, we will look for volume spikes - it will indicate strong buying and selling activity.
Examine NZDUSD chart on a daily time frame with default volume indicator being added.
I highlighted a recent volume spike.
The elevated volume level confirms that there was strong institutional participation in the formation of this candle.
But you can see that this particular candle has quite a wide rage.
So how do we know where exactly and on what levels liquidity concentrates?
We will need to use another indicator to find liquidity zones - a volume profile.
Here is what this indicator does.
Think of the chart as a battlefield. The Volume Profile shows you exactly where the major fighting between buyers and sellers is taking place. It reveals the price levels where the most orders have been executed.
While a classic volume indicator shows when volume occurred, it lights up the specific price levels where the most trading activity is concentrated.
Analyzing Volume Profile on NZDUSD, we can easily find the exact zone where liquidity was concentrated.
We simply take the entire range of a high volume candle and look for a volume profile spike within.
To identify other liquidity zones, continue searching for volume spikes in Volume indicator.
By the way, adding a Simple Moving Average on your Volume indicator will help you find these spikes easier.
Here are 4 significant liquidity zones that I found using this method.
Please, note that there are 3 high volume candles that were formed within the same liquidity zone.
A combination of a classic Volume indicator and Volume Profile will help you to accurately identify the exact moments of volume increase and the price levels where this rise occurred.
That will be a reliable strategy to find important liquidity zones.
❤️Please, support my work with like, thank you!❤️
I am part of Trade Nation's Influencer program and receive a monthly fee for using their TradingView charts in my analysis.
The gold price trend is unstoppable.Pricing Logic: U.S. Treasury Yield Anchor Fails, Central Bank Gold Purchases Become Core Driver
Old Framework Collapses, New Logic Establishes
The traditional pricing anchor of "gold’s negative correlation with U.S. Treasury yields" has collapsed. A rare phenomenon of "synchronized rally in gold prices and 10-year U.S. Treasury yields" has emerged over the past three weeks. The core driver lies in the declining credibility of the global monetary system and the demand for "de-dollarization," which have promoted the restructuring of the pricing framework.
Currently, gold’s trend is more susceptible to the influence of "central bank gold purchase scale, changes in U.S. dollar credit, and the degree of spot shortage." This transformation has reduced gold’s sensitivity to U.S. Treasury yield fluctuations by more than 30%, significantly enhancing its resilience during pullbacks.
Central Bank Gold Purchases Exceed Expectations
Global central bank gold purchases have exceeded 1,000 tons for three consecutive years, reaching 1,045 tons in 2024. The People’s Bank of China (PBoC) has increased its gold reserves for three consecutive months, with holdings rising to 73.45 million ounces by the end of January. The demand for asset diversification among emerging market central banks has formed a rigid support.
The $4,180–$4,200 range is not only a technical support level but also the core cost zone for global central bank gold purchases, establishing a strong bottom logic of "official buying interest emerging once prices fall below this range."
Gold trading strategy for next week
buy:4180-4190
tp:4200-4220-4250
sl:4170

xauusd 1h🔹 Overall Outlook and Potential Price Movements
In the charts above, we have outlined the overall outlook and possible price movement paths.
As shown, each analysis highlights a key support or resistance zone near the current market price. The market’s reaction to these zones — whether a breakout or rejection — will likely determine the next direction of the price toward the specified levels.
⚠️ Important Note:
The purpose of these trading perspectives is to identify key upcoming price levels and assess potential market reactions. The provided analyses are not trading signals in any way.
✅ Recommendation for Use:
To make effective use of these analyses, it is advised to manually draw the marked zones on your chart. Then, on the 5-minute time frame, monitor the candlestick behavior and look for valid entry triggers before making any trading decisions.

XAU/USD LongM & W: Uptrend, respecting the lows
D: Uptrend, price retraced 88.6%
4H: Downtrend, price made a higher low trending long
1H: Uptrend, price hit -61.8 on H1 FIB + RSI showing oversold and bearish divergence.
CURRENTLY: I'm looking for price to go short to retest H1 trendline, @previous resistance, and continue long.

Accumulation and recovery - resistance 4275⭐️GOLDEN INFORMATION:
Gold (XAU/USD) extends Tuesday’s rebound from the $4,164 zone in Wednesday’s Asian session, gaining fresh momentum and edging back toward Monday’s two-week high. The metal remains supported by expectations of another Fed rate cut next week, while speculation about a dovish successor to Chair Powell keeps the US Dollar subdued near a two-week low, further boosting the non-yielding asset
⭐️Personal comments NOVA:
Buying power remains above 4200, gold price recovers and grows. The market is waiting for today's ADP-NF results to continue increasing in price.
⭐️SET UP GOLD PRICE:
🔥SELL GOLD zone: 4275 - 4277 SL 4282
TP1: $4260
TP2: $4245
TP3: $4230
🔥BUY GOLD zone: 4193 - 4191 SL 4186
TP1: $4208
TP2: $4220
TP3: $4235
⭐️Technical analysis:
Based on technical indicators EMA 34, EMA89 and support resistance areas to set up a reasonable BUY order.
⭐️NOTE:
Note: Nova wishes traders to manage their capital well
- take the number of lots that match your capital
- Takeprofit equal to 4-6% of capital account
- Stoplose equal to 2-3% of capital account

XAUUUSD AFTER BIG FALL TAKING SAME SUPPORTXAUUSD after big fall taking same support of weekly candle 4213
Entry on 4213
Stop reference 4192
Upside target point 4260
Running still bullish channel 4040 to 4264 so gold still on near to high point of weekly candle
this is not financial advice , Chart is for educational analysis only

Up and down expected for gold next few days. As usual. We have only 2 options. Up or down direction.
Up expected to follow the green lines
Down expected to follow the red lines.
Down trend is not more likely expected, but this is a market,
Up trend is the most expected but also it is a market
Good luck

GOLD → Correction to support amid a bullish trend FX:XAUUSD retreated from the $4,245 level reached on Monday. A countertrend correction is forming ahead of the news. But buyers are not sleeping...
Weak US economic data has heightened expectations of an imminent Fed rate cut. The PMI index in the US manufacturing sector continued to contract. The market estimates the probability of the Fed easing policy next week at 87%.
However, rising US Treasury yields and fears that the Fed may send cautious signals after its December decision are limiting gold's growth.
Market attention is shifting to ADP employment data and the US services business activity index (ISM Services PMI), which will be released on Wednesday. They will provide new signals about the health of the US economy.
The correction in gold appears to be under control amid continuing macroeconomic uncertainty. The 4200, 4193-4173 level remains an important area of struggle between bulls and bears.
Resistance levels: 4211, 4245
Support levels: 4193, 4173
A false breakdown and the bulls holding the market above the above support zone could trigger growth within the trend.
Best regards, R. Linda!

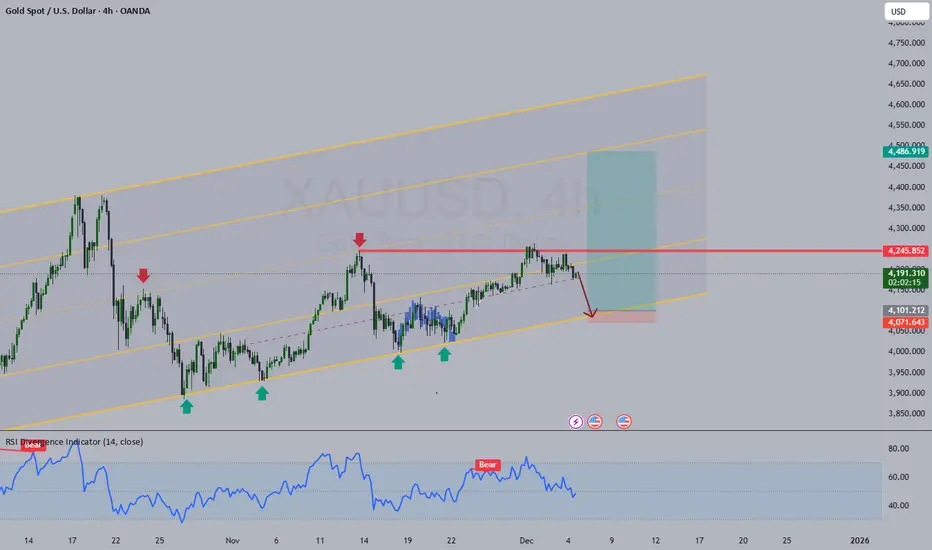
Gold (XAU/USD) Breakout Setup: Demand Zone Retest and Upside TarOverall Structure
The chart shows Gold Spot (XAU/USD) on the 30-minute timeframe, and it highlights:
A descending channel (blue parallel trendlines).
A support zone (yellow box).
A stop-loss zone (red area).
A long (buy) projection toward a high target point around 4,265.
1. Descending Channel
The price has been moving inside a clearly defined downward-sloping channel.
Currently, the price is:
Testing the upper boundary of the channel.
Showing signs of attempting a breakout.
This suggests momentum may be shifting.
2. Strong Support Zone (Yellow Box)
The highlighted yellow zone around 4177 – 4160 acts as:
A demand zone where buyers previously stepped in.
The chart suggests a potential retest of this area before a bullish push.
The projected price action line (blue sketch) shows:
Dip → retest support → breakout → rally.
3. Stop-Loss Zone (Red Area)
Under the yellow support sits a stop-loss / invalidation zone around:
4160.107 (marked explicitly)
This implies that if price drops below this level, the bullish scenario becomes invalid.
4. Bullish Target
The projected target is drawn high above the current price:
4265.369 – 4265.645
This is a large upward move, suggesting:
A breakout from the channel
A continuation to a new high
The vertical grey rectangle indicates the expected profit zone of the trade.
5. Trade Logic Implied by the Chart
Bullish thesis:
Step 1: Price dips back into 4177 → 4160 zone
Step 2: Buyers defend the zone
Step 3: Breakout above descending channel
Step 4: Rally toward 4265 target
This is a classic pullback-to-support before breakout structure.
Risk:
Break below 4160 invalidates the buy idea.
6. What This Chart Suggests
In summary:
Bullish signals:
A descending channel that often breaks upward after weakening momentum.
Strong demand zone highlighted.
Clear projection showing expected reversal and breakout.
Bearish risk:
If support fails, downside continuation is likely
