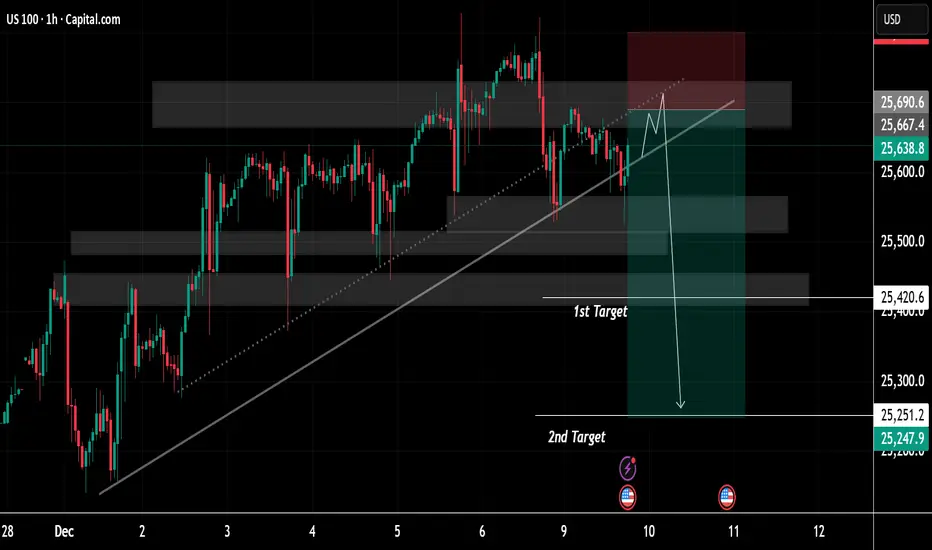
US100 Price Update – Clean & Clear ExplanationUS100 is moving within a broad ascending channel, defined by a long-term diagonal support line that has guided the market’s bullish momentum since late November. Multiple interaction points along this trendline show it has historically acted as a reliable dynamic support zone.
Several shaded horizo
About US Tech 100, Daily
The NASDAQ-100 is an index that is constituted by 100 of the largest companies listed on the NASDAQ stock exchange, which is the second largest in the world only after the New York Stock Exchange by market capitalization. The companies that are listed in this index range from a variety of industries like Technology, Telecommunications, Biotechnology, Media, and Services. The NASDAQ-100 was first calculated in January 31 of 1985 by NASDAQ and it is a modified capitalization-weighted index. This index has been of good reference to investors that want to know how the stock market is performing without financial services companies, this given that the index excludes financial companies.
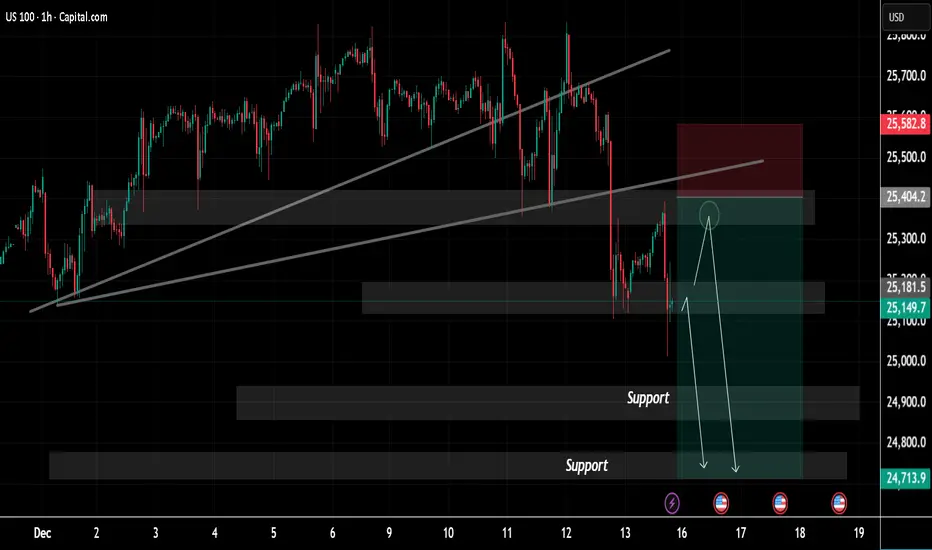
USNAS100 Price Update Clean Clear ExplanationUS100 on the 1-hour timeframe, highlighting a shift in market structure from bullish to bearish Price was previously moving within an ascending channel, respecting higher highs and higher low a strong bearish breakdown occurred, with price decisively breaking below the rising trendline, indicating a
Major correctionI'm targetting a drop to 11 000 around Aug to Dec next year and back to more reasonable valuations than currently. This would also arrive at the very long term lower trend line on the log chart. The area around 11 000 looks to me like it need retesting. And it would need to be in this sort of time f

Market Hunter: NASDAQ-NAS100 Sell OpportunityMy friends, Good morning!☀️
For US100-NAS100, I will open a SELL position between 24,988 and 25,243, targeting 23,843.📊
My friends, I share these analyses thanks to every single like I receive from you.
Your likes increase my motivation and make me want to support you in this way.🙏
I sinc

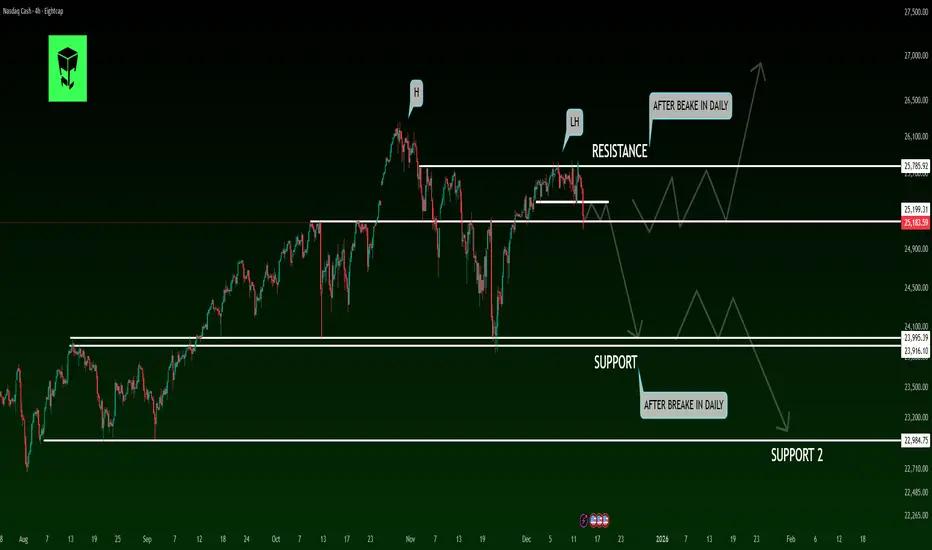
Calm Before the Storm?A Potential Crash Is Forming in US STOCKSHello, I hope you're doing well today. We are going to analyze the Nasdaq index together. The Nasdaq is one of the key U.S. stock indices and consistently offers promising trading opportunities. If you're ready, let's dive into the analysis.
Timeframe: 4H / Daily
🔍 Market Structure Overview
After
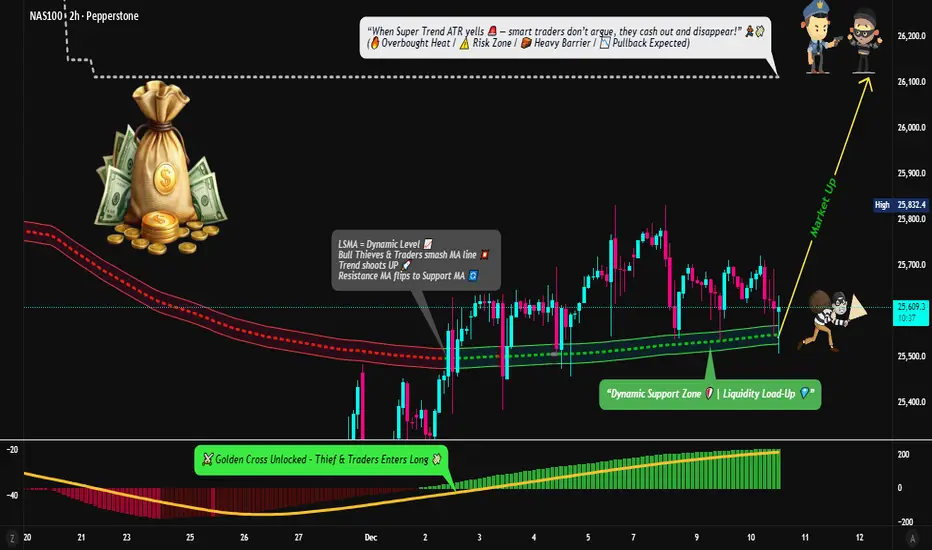
NASDAQ100 Strong Bullish Momentum — Clean Entry & Exit Blueprint⚡ THIEF STRATEGY ALERT: Golden Cross Breakout Setup
📈 TRADE PLAN OVERVIEW
Asset: NAS100 (NASDAQ 100 Index)
Timeframe: Day/Swing Trade
Market Bias: 🟢 BULLISH (Moving Average Breakout + MACD Golden Cross Confirmed)
Strategy Type: Layered Entry Approach (Multi-Level Limit Orders)
🎯 ENTRY STRATEGY - "
NASDAQ SHORT VERY BEARISHTri-star doji printed, a rare and strong reversal pattern - extremely bearish.

Learn or perish Market need some liquidity in the event that we are going up and there is a lot of it down there

Nasdaq December Rally starting?Institutionals have been leaving some traces of what its about to happen. Are we ready to surf the wave?
What if it doesn't wave and it was all a bear trap?
Stay tuned!

Another bad day for price action in the Nasdaq
BAD DAY TO TRADE
Nasdaq is very choppy today just as it has been for the entire year. London session already dealt with very high FOMC push so if it went more Bearish on the day I wouldn't be surprised. However the price action for December has been absolutely abysmal. Pre-Market stocks are lo
See all ideas
Displays a symbol's value movements over previous years to identify recurring trends.