US500 Awaits Fed Decision Near Record HighThe US500 (S&P 500) hovers just below its record high as market participants anticipate the upcoming monetary policy decision from the Fed. The index's flattening price action reflects a cautious but broadly bullish sentiment.
The US500 last closed near 6,840, losing about 0.1% on the day. This slight movement keeps the index less than 1% below its recent peak near 6,895. Over the 12-month period, the index shows a robust trend, advancing about 13 -14%.
Sentiment remains largely positive, though investors adopt a 'wait-and-see' approach ahead of the imminent Fed meeting. Markets are currently pricing in a high probability of another rate cut. Investor optimism for US equities is at its highest in about 1-year, fuelled by expectations of easier policy and liquidity. However, caution persists due to high valuations and concentration in large cap stocks.
Technically, the US500 remains in an uptrend, trading well above key moving averages. The short-term rally is losing momentum as the price tests the resistance at 6,895. The nearest support is the 6,800-6,815 range.
Consolidating above the 6,800-6,815 support may prompt the US500 to retest the next target at 6,895. Conversely, a break below the 6,800-6,815 range could lead the US500 to test the subsequent support at 6,750.
Analysis by Terence Hove, Senior Financial Markets Strategist at Exness.
S&P 500 Index
No trades
Trade ideas

S&P500 pullback as inflation risks remain tilted to the upsideThe S&P 500 fell 0.35%, snapping a four-day winning streak, as hawkish ECB commentary from Isabel Schnabel pushed global yields higher and weighed on risk appetite. Schnabel signalled comfort with expectations for another rate hike, warned that inflation risks remain tilted to the upside, and suggested the neutral rate may be rising due to AI and public investment. In response, euro overnight index swaps for Dec-2026 rose 8bps, contributing to the broader risk-off tone.
Equity losses in the US were broad-based, with 10 of 11 sectors lower, led by communication services (-1.77%) and materials (-1.66%). The Magnificent 7 fell 0.91% for its worst session in over two weeks, although semiconductors outperformed, helped by Nvidia (+1.72%). Despite the decline, the index remains less than 1% below its late-October record high, but momentum clearly cooled as yields climbed.
In after-hours trade, Nvidia gained a further ~2% after Donald Trump approved sales of its H200 AI chip to China, subject to a 25% government surcharge and sales only to “approved customers”—a potentially significant earnings tailwind if Chinese buyers are ultimately permitted to proceed.
This communication is for informational purposes only and should not be viewed as any form of recommendation as to a particular course of action or as investment advice. It is not intended as an offer or solicitation for the purchase or sale of any financial instrument or as an official confirmation of any transaction. Opinions, estimates and assumptions expressed herein are made as of the date of this communication and are subject to change without notice. This communication has been prepared based upon information, including market prices, data and other information, believed to be reliable; however, Trade Nation does not warrant its completeness or accuracy. All market prices and market data contained in or attached to this communication are indicative and subject to change without notice.


$SPX is showing short-term weakness as price pressesCheck Bear-flag thesis from :
Dec 3
Dec 2
Nov 21
Nov 17
SPX is showing short-term weakness as price presses directly against the lower rail of the 1H rising channel. The dotted midline was lost earlier in the week, and repeated rejections there have kept the index operating in the weaker half of the structure. Candle flow has formed a clear sequence of lower highs, and prior micro-support around 6840–6860 is no longer being defended. EMA/VWAP clusters are stacked overhead, adding downward pressure. The broader channel remains intact, but short-term structure continues to lean bearish unless buyers can reclaim midline strength.
Upside invalidation is clean: bulls must break above 6,885–6,900 with strength and reclaim the ATH zone from inside, not just touch it.
Until that happens, rallies into channel mid or top = short opportunities.
Bearish Bias | Watch 6,840 | Bear Flag Until Proven Otherwise
#SPX #S&P500 SP:SPX TVC:SPX CBOE:SPX #SP500 #BearFlag

Gold, S&P500 and their ratioThis shows two previous instances of long term gold bull vs S&P stalled sideways, during a decade in both instances, while Gold enjoyed great bull markets.
The ratio got down to 0.65 and 0.30 previously, while now it's still much higher 1.63. So this shows Gold could still have much upside (and S&P much sideways action) if history repeats.
Of course it's impossible to predict when this will happen, but now it still seems like a great time to hold gold as a diversifier against stocks.

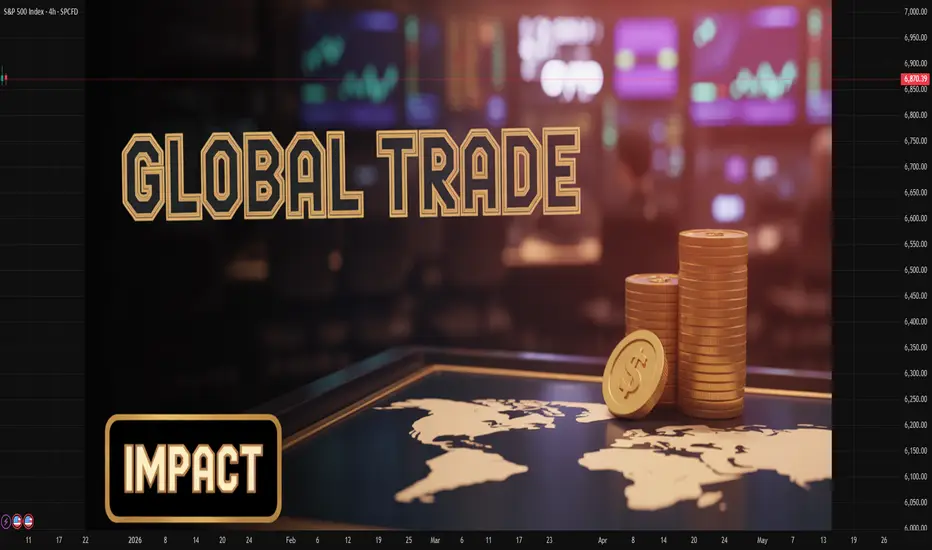
Global Trade and Its Impact: A Comprehensive AnalysisEconomic Impacts of Global Trade
At the core, global trade acts as a catalyst for economic growth. By allowing countries to specialize in the production of goods and services where they have a comparative advantage, trade promotes efficiency and productivity. For instance, countries with abundant natural resources can focus on extraction and export, while those with advanced manufacturing capabilities concentrate on producing high-value goods. This specialization leads to lower production costs, greater product variety, and higher overall economic output.
Trade also contributes to economic diversification. For developing countries, exporting a range of goods reduces reliance on a single sector and mitigates economic risks associated with commodity price fluctuations. For developed economies, imports provide access to raw materials, advanced technologies, and cheaper consumer goods, enhancing competitiveness. Moreover, global trade stimulates foreign direct investment (FDI), as companies establish operations abroad to access new markets, which, in turn, creates jobs and fosters economic development.
However, the economic impact of trade is not uniformly positive. While aggregate national income may rise, certain sectors and communities may face disruptions. Industries unable to compete with imported goods may decline, leading to unemployment and regional economic disparities. Additionally, excessive dependence on global markets can expose countries to external shocks, such as global recessions or supply chain disruptions, as witnessed during the COVID-19 pandemic.
Social and Labor Impacts
Global trade significantly influences labor markets and societal structures. By opening new markets and stimulating economic growth, trade creates employment opportunities across sectors. Export-oriented industries often provide higher wages and skill development opportunities. International companies operating in multiple countries also contribute to knowledge transfer, training local workforces, and raising labor standards.
On the other hand, trade can exacerbate social inequalities. Workers in industries exposed to international competition may face wage stagnation or job losses. The shift of manufacturing to countries with lower labor costs, often called “offshoring,” has led to declining industrial employment in certain developed economies, causing social and political tensions. In developing nations, while trade can lift millions out of poverty, it may also lead to exploitative labor practices if regulatory frameworks are weak.
Global trade also fosters cultural exchange. Exposure to foreign goods, services, and media enables the spread of ideas, lifestyles, and technologies, influencing societal values and consumption patterns. While this cultural interconnection promotes understanding and innovation, it may also challenge local traditions and cultural identities, leading to debates over cultural homogenization.
Technological and Innovation Impacts
One of the less immediately visible but highly transformative impacts of global trade is technological advancement. Trade encourages competition, compelling firms to innovate to maintain market share. Access to international markets allows companies to scale up production, invest in research and development, and adopt best practices from other countries. Technology transfer often accompanies trade, as multinational corporations introduce advanced processes, machinery, and management practices to host countries.
For example, the proliferation of information and communication technologies (ICT) in developing countries has been facilitated by global trade, enabling digital services, e-commerce, and global connectivity. Furthermore, trade in high-tech goods, such as semiconductors, medical equipment, and renewable energy technology, accelerates the diffusion of innovation globally, contributing to economic development and environmental sustainability.
Environmental Impacts
While global trade boosts economic growth, it also has environmental consequences. Increased production and transportation of goods contribute to carbon emissions, resource depletion, and ecological degradation. The demand for agricultural products, minerals, and manufactured goods often leads to deforestation, overfishing, and industrial pollution. Moreover, the carbon footprint associated with global supply chains has become a pressing concern, prompting discussions on “green trade” and sustainable practices.
On the positive side, trade can facilitate the dissemination of environmentally friendly technologies. Countries can import renewable energy equipment, pollution-control technologies, and sustainable agricultural practices, helping to mitigate environmental challenges. International agreements and trade policies increasingly incorporate environmental standards, promoting responsible trade practices that balance economic growth with ecological preservation.
Geopolitical and Strategic Impacts
Global trade is closely linked to geopolitics. Countries that dominate trade in critical goods, such as energy, rare minerals, and advanced technology, wield significant strategic influence. Trade relationships can foster diplomatic cooperation, strengthen alliances, and reduce the likelihood of conflict by creating mutual economic dependencies. Conversely, trade disputes, tariffs, and sanctions can become tools of geopolitical leverage, shaping international relations.
Trade also contributes to regional integration. Organizations like the European Union, ASEAN, and NAFTA (now USMCA) exemplify how trade can promote regional stability, harmonize regulations, and create large economic blocs capable of influencing global markets. However, overreliance on a few trading partners can increase vulnerability to political and economic pressures, highlighting the need for diversified trade strategies.
Globalization, Inequality, and Policy Challenges
Global trade is a driving force behind globalization, connecting economies, societies, and cultures. It has lifted millions out of poverty, expanded consumer choice, and spurred innovation. However, it has also intensified inequality, both within and between nations. Wealthier countries and multinational corporations often capture the lion’s share of trade benefits, while poorer nations may struggle to move up the value chain.
Policymakers face the challenge of maximizing trade benefits while mitigating negative impacts. Trade agreements, tariffs, and subsidies must be designed to protect vulnerable industries and labor forces. Social safety nets, skills training, and investment in infrastructure are essential to ensure that trade-driven growth is inclusive. Furthermore, international cooperation is critical to addressing environmental impacts, labor standards, and fair competition.
Conclusion
In summary, global trade is a double-edged sword with profound and multifaceted impacts. Economically, it promotes growth, efficiency, and diversification, but can disrupt local industries. Socially, it generates jobs and facilitates cultural exchange, yet can exacerbate inequality. Technologically, trade drives innovation and knowledge transfer, while environmentally, it poses both challenges and opportunities. Geopolitically, trade shapes alliances, strategic dependencies, and regional integration.
The ultimate impact of global trade depends on the policies, governance, and strategies implemented by nations. When managed effectively, trade can be a powerful engine for sustainable development, economic prosperity, and international cooperation. Conversely, neglecting its social, environmental, and political dimensions can exacerbate inequality, environmental degradation, and geopolitical tensions. As the world continues to navigate the complexities of globalization, understanding and leveraging the impact of global trade remains essential for shaping a more equitable and prosperous future.
SPX500 Bullish Plan in Motion with SMA + Kijun Confirmation🚀 US500/SPX500 INDEX MARKET SWING TRADE MASTERCLASS 🎯
📊 ASSET: S&P 500 Index (US500 | SPX500)
Timeframe: 4H-Daily | Strategy Type: Swing Trade | Market Context: Bullish Pullback Confirmation
🎲 TRADE SETUP: THE "THIEF PROTOCOL" STRATEGY ⚡
✅ TECHNICAL CONFIRMATION
🔹 Primary Signal: Simple Moving Average (SMA) Pullback Retest
🔹 Secondary Confirmation: Kijun-sen (Ichimoku MA) Retest
🔹 Market Structure: Higher Lows Formation + Bullish Consolidation
🔹 Bias: LONG with Layered Entry Methodology
💰 ENTRY STRATEGY: MULTI-LAYER LIMIT ORDER APPROACH
The "Thief Layering Method" - Stack multiple buy limit orders for optimal risk distribution:
🟢 Layer 1 Entry: $6,750.00 - Initial Probe Entry (30% Position Allocation)
🟢 Layer 2 Entry: $6,800.00 - Aggressive Add (35% Position Allocation)
🟢 Layer 3 Entry: $6,850.00 - Final Confirmation Entry (35% Position Allocation)
Entry Flexibility: Adjust layers based on your account size & risk tolerance. Spread entries across pullback zones for superior fill pricing.
🛑 STOP LOSS MANAGEMENT
Recommended SL Level: $6,720.00 - Placed below the support trendline + SMA confluence
⚠️ IMPORTANT DISCLAIMER: Dear Traders! This is YOUR trading journey. We strongly recommend adjusting stop loss based on YOUR risk management rules. Account sizing is crucial - never risk more than 2-3% per trade. Your SL placement = YOUR decision, YOUR responsibility. Use proper position sizing ALWAYS.
🎯 PROFIT TARGET ZONES
Primary Target: $7,050.00 ⚡
📊 Technical Reasoning: This level represents strong resistance confluence zone, historical supply level in overbought territory, and creates a risk/reward sweet spot of 1:3+ return potential. Alert: Trap zone exists here - smart money reversal area confirmed.
Exit Strategy Recommendation: Close 50% of position at $7,000-7,020 to lock partial profits. Hold remaining 50% with trailing stop or until $7,050 for maximum upside capture. Lock profits incrementally to secure gains.
⚠️ CRITICAL REMINDER: Your profit target = YOUR choice! This TP represents technical confluence, but market conditions evolve. Trade YOUR plan, manage YOUR risk, protect YOUR capital.
🌍 CORRELATED PAIRS TO WATCH 🔗
📈 PRIMARY CORRELATIONS
1️⃣ QQQ (Nasdaq-100 ETF) - 0.99 Correlation 💻
This is the tech-heavy composition that typically leads SPX rallies. Current focus remains on AI/Mag7 momentum and overall growth stock sentiment. Key watch: QQQ strength = SPX bullish confirmation signal. When QQQ breaks out, SPX follows closely.
2️⃣ IWM (Russell 2000 ETF) - 0.95 Correlation 📍
Small-cap composition with high tariff sensitivity. Current status shows small-cap underperformance zones vulnerable to trade policy shifts. Trading tip: IWM weakness = Sector rotation risk, so watch for divergence from SPX strength.
3️⃣ DXY (US Dollar Index) - Inverse/Mixed Correlation 💵
Recent positive correlation emerging in 2025 market dynamics. Current dynamic shows dollar strength now sometimes supports equities due to policy-driven factors. Risk factor alert: DXY spike above 108 = potential SPX headwind to monitor.
📊 SECONDARY WATCH PAIRS
SPY (S&P 500 ETF) - Mirror of SPX, use for volume confirmation and institutional positioning.
DIA (Dow Jones ETF) - Large-cap value barometer, less tech-sensitive than QQQ, shows rotation signals.
VIX (Volatility Index) - Above 25 = caution mode, below 15 = complacency warning.
📱 KEY CORRELATION INSIGHTS FOR THIS TRADE
🔴 RED FLAGS - Watch These Closely:
VIX spiking above 30 signals potential fear spike. DXY breaking above 108 creates dollar strength pressure. QQQ failing to confirm breakout indicates tech weakness divergence. IWM hitting new lows signals broad market weakness.
🟢 GREEN LIGHTS - Trade Confirmation:
QQQ and SPX moving in sync above SMA is bullish. IWM holding key support levels confirms breadth. DXY consolidating means no headwind pressure building. VIX below 20 indicates low fear environment.
🎯 TRADE PSYCHOLOGY & EXECUTION TIPS
✅ Pre-Trade Checklist:
Confirm SMA pullback on 4H chart before entry. Verify Kijun retest on Ichimoku indicator. Check QQQ alignment for correlation confirmation. Monitor DXY to avoid strong dollar days. Set alerts at all 3 entry layers for execution readiness.
✅ During Trade Management:
Take partial profit at 50% move up to secure gains. Move SL to breakeven after hitting first target. Trail stop every 50-pip move in your favor. Document your execution for journal review and performance tracking.
🔥 TRADE EXECUTION SUMMARY
Signal Type: Bullish Pullback Retest ✅ Confirmed
Entry Method: 3-Layer Limit Orders 🎯 Optimized for Best Fill Pricing
SL Level: $6,720.00 🛑 Defined and Placed Below Support
TP Level: $7,050.00 🎯 Defined at Resistance Confluence
Risk/Reward Ratio: 1:3+ 💰 Favorable Trade Structure
Best Tradeable Window: Next 48-72 Hours ⏰ Active Setup Zone
Good Luck, Traders! 🚀 Trade Smart. Trade Safe. Trade Often.
Remember: Your SL = Your Protection | Your TP = Your Goal | Your Risk = Your Responsibility
#SPX500 #SwingTrade #TechnicalAnalysis #TradingIdea #S&P500 #MarketAnalysis #TradeSetup #RiskManagement

sp500 1h🔹 Overall Outlook and Potential Price Movements
In the charts above, we have outlined the overall outlook and possible price movement paths.
As shown, each analysis highlights a key support or resistance zone near the current market price. The market’s reaction to these zones — whether a breakout or rejection — will likely determine the next direction of the price toward the specified levels.
⚠️ Important Note:
The purpose of these trading perspectives is to identify key upcoming price levels and assess potential market reactions. The provided analyses are not trading signals in any way.
✅ Recommendation for Use:
To make effective use of these analyses, it is advised to manually draw the marked zones on your chart. Then, on the 5-minute time frame, monitor the candlestick behavior and look for valid entry triggers before making any trading decisions.
$SPX | COVERAGE INITIATED — Personal Position Update [W49]SPX — WEEK 49 COVERAGE INITIATED | 12/05/2025
Ticker: SP:SPX
Timeframe: W
This is a reactive structural classification of SPX based on the weekly chart as of this timestamp. Price conditions are evaluated as they stand — nothing here is predictive or forward-assumptive.
⸻
Author’s Note — Personal Position Update
I initiated my own position on [ SP:SPX ] during Week , entering at $ . This decision follows my personal criteria: I only participate when my system identifies a verified structural trend shift supported by both a confirmed weekly flag and a qualifying candle state. This note reflects my activity only and is not a suggestion for anyone else.
As of this update, my position is currently up ~ from my entry. My structural exit level is $ on a weekly-close basis. This level will continue to adjust upward automatically as the structure strengthens. If price closes below that threshold, my system classifies the trend as structurally compromised, and that is where I personally exit.
This update exists solely to document my own participation and the structural levels I monitor. It is not predictive and does not imply any future outcome.
⸻
Structural Integrity
1) Current Trend Condition [ Numbers to Watch ]
Current Price @ $
• Trend Duration @ +2 Weeks
( Bullish )
• Trend Reversal Level ( Bearish ) @ $
• Trend Reversal Level ( Bearish Confirmation ) @ $
• Pullback Retracement @ $
• Correction Support @ $
⸻
2) Structure Health
• Retracement Phase:
Uptrend (operating above 78.6%)
• Position Status:
Healthy (price above both structural layers)
⸻
3) Temperature :
Warming Phase
⸻
4) Momentum :
Bullish
⸻
Structural Integrity
UPWARD STRUCTURAL ALIGNMENT
This mark reflects a point where market behavior supported the continuation of the existing upward direction. It does not imply forecasting or targets — it simply notes where strength became observable within the current trend. Its meaning holds only while price continues to respect the broader structural levels that define the trend.
⸻
Methodology Overview
This classification framework evaluates directional conditions using internal trend-interpretation logic that references price behavior relative to its structural layers. These relationships are used to identify when price movement aligns with the framework’s criteria for directional phases, transition points, or regime shifts. Visual elements or structural labels reflect these internal interpretations, rather than explicit trading signals or preset indicator crossovers. This framework is observational only and does not imply future outcomes.
S&P index bear trend in makingdue to divergence on both MCAD and RSI, there is going to be a trend reversal from bullish to bearish. please share ur thoughts

V Pattern On SPX/USD 12hr ChartHey traders and followers ! We have a V pattern on the SPX 12hr chart.
What's next? We go long on a break out of the break Line 6770.3
Target 6856.0 .
Follow your charts not the rumors during this confusing time. Charts never lie people do.
See you in a little while at the starting line as we wait for the break out to prove to us we have a V pattern going on. ;)

IWM - Buy The Rumor Sell The News?Today the IWM saw massive bullish flow, almost piercing the all time high double top.
Many high beta stocks absolutely ripped higher today on huge rate cut expectations.
There a strong chance they may keep small caps strong into the rate cut, which could set up a buy the rumor sell the news.
The rate cut is next week December 10th and it sure has fueled this rally.
we have been trimming some of our long positions into this strength and still have long exposure in key names.
Today we closed
AMEX:UMAC NASDAQ:DPRO FOR 15 - 17% GAINS
NYSE:SLB CALLS 45% GAIN
NYSE:ACN CALLS 102% GAIN

S&P500 Near-term direction remains data- and rates-driven,The S&P 500 rose +0.30%, continuing to consolidate just below record highs as markets looked past weak labour data and leaned further into rate-cut expectations.
Early weakness followed a sharp downside surprise in ADP payrolls (-32k vs +10k expected), the first decline since 2023 and heavily skewed toward small businesses. With official payrolls delayed, this report carried more weight than usual and reinforced the narrative of cooling US labour conditions.
That dovish signal was confirmed by ISM services, where prices paid fell to a 7-month low (65.4) and the employment index stayed in contraction (48.9) — easing inflation worries and strengthening confidence in a Fed rate cut next week.
Rates reflected the shift, with the 10yr Treasury yield falling to ~4.06%, providing support to equities. Risk appetite improved late session, with small caps sharply higher and Bitcoin extending gains, both consistent with a softer-rate environment.
On the policy front, markets continue to watch Fed leadership speculation around Kevin Hassett, though investors remain skeptical that any new appointments would materially accelerate the pace of cuts beyond what data already justify.
Bottom line for the S&P:
Near-term direction remains data- and rates-driven, with the index range-bound but underpinned by falling yields. As long as inflation signals remain contained and labour continues to soften gradually, buy-the-dip behaviour is likely to persist into the Fed meeting.

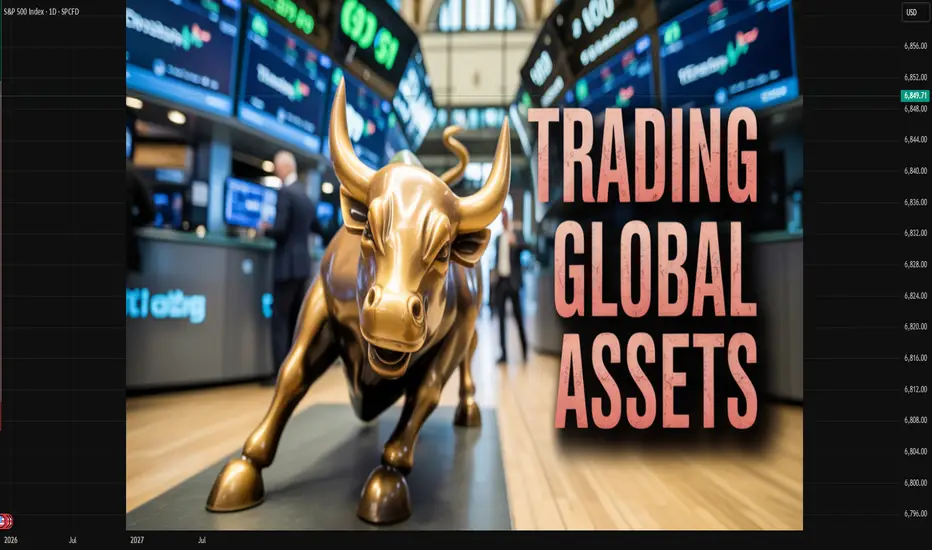
Trading with Global Assets1. What Are Global Assets?
Global assets are financial instruments available for trading on international markets. These include:
1. Global Stocks
Shares of companies listed on foreign exchanges such as:
NASDAQ, NYSE (USA)
LSE (UK)
TSE (Japan)
HKEX (Hong Kong)
Euronext (Europe)
Through global trading platforms or depository receipts (ADR/GDR), investors can gain exposure to multinational companies like:
Apple
Tesla
Alibaba
Toyota
Nestlé
2. Forex (Global Currencies)
Forex is the world’s largest financial market, operating 24×5. Traders deal in currency pairs such as:
EUR/USD
USD/JPY
GBP/USD
AUD/CAD
These pairs reflect economic health, interest rates, and geopolitical conditions.
3. Global Commodities
Commodities come from exchanges like:
CME (Chicago)
ICE (London/New York)
MCX (India)
Important commodities include:
Gold, Silver, Platinum
Crude Oil, Natural Gas
Corn, Wheat, Coffee
4. Global Indices
Indices represent the performance of groups of stocks:
S&P 500
Dow Jones
FTSE 100
Nikkei 225
DAX 40
Trading indices is a way to participate in the broad movement of an entire economy or sector.
5. Bonds and Global Debt Markets
Governments and corporations issue bonds internationally. Examples:
US Treasury Bonds
German Bunds
Japanese Government Bonds (JGBs)
Global bond trading provides stability and diversification.
6. Cryptocurrencies
Digital assets like:
Bitcoin
Ethereum
Solana
are traded globally 24/7. Their decentralized nature makes them attractive but highly volatile.
2. Why Trade Global Assets?
1. Diversification
Instead of relying only on your home country’s market, global assets spread risk across:
regions
currencies
industries
economic cycles
If one country faces recession, others may still perform well.
2. Access to High-Growth Markets
For example:
Investing in US tech stocks
Trading China’s manufacturing giants
Buying Middle Eastern energy companies
Exposure to international sectors gives traders more opportunities.
3. Around-the-Clock Trading
Trading global assets means:
Forex: 24 hours
Crypto: 24/7
Stocks: Based on time zones (US, Europe, Asia)
You can trade almost any time of day depending on which market is open.
4. Profit from Currency Movements
If your local currency depreciates, foreign assets may become more valuable, helping preserve wealth.
5. Hedging Strategies
Businesses and traders use global assets to hedge risks such as:
Currency risk
Interest-rate changes
Commodity price fluctuations
3. How to Trade Global Assets
Step 1: Choose a Global Trading Platform
Platforms offering global access include:
Interactive Brokers
Saxo Bank
TD Ameritrade
eToro
Binance (for crypto)
These platforms provide multi-asset access with global market data.
Step 2: Understand Market Hours
Every region has different trading sessions:
Asian Session (Tokyo, Shanghai)
European Session (London, Frankfurt)
US Session (New York)
Traders often use overlapping sessions (e.g., London–New York) because liquidity is highest.
Step 3: Study the Global Economy
Factors that affect global assets:
Interest rate announcements
Central bank policies
Inflation data
GDP reports
Geopolitical tensions
Oil supply decisions (OPEC)
Successful global traders follow global news daily.
Step 4: Use Proper Risk Management
Essential techniques:
Stop-loss orders
Position sizing
Diversification
Hedging using derivatives
Risk management is crucial because global assets can be highly unpredictable.
Step 5: Learn Technical and Fundamental Analysis
Global traders use:
Charts and indicators (technical)
Economic data, earnings reports, global events (fundamental)
Blending both improves the accuracy of trade decisions.
4. Opportunities in Global Asset Trading
1. Emerging Markets
Countries like India, Brazil, Vietnam, and Indonesia offer rapid growth. Traders often buy ETFs or stocks representing these markets.
2. Tech Innovation
US markets lead in:
AI
Biotechnology
Semiconductor manufacturing
Cloud computing
These sectors can deliver high returns.
3. Commodity Supercycles
When global demand rises (e.g., infrastructure projects), commodities like copper and crude oil surge.
4. Global Currency Trends
Currencies are affected by:
War
Interest rate hikes
Policy changes by central banks
These create trading opportunities for forex traders.
5. Energy Transition
Green energy assets like:
Lithium
Solar panel manufacturers
Hydrogen stocks
are rising due to global sustainability goals.
5. Risks in Global Asset Trading
1. Currency Risk
When your currency strengthens, foreign investments may lose value.
2. Geopolitical Risk
Examples include:
war
sanctions
border conflicts
political instability
These events can cause sudden market volatility.
3. Liquidity Risk
Not all global assets trade with high volume. Low liquidity can lead to:
wide spreads
slippage
difficulty exiting trades
4. Market Timing Issues
Time zone differences can make it challenging to react quickly to market events.
5. Economic Risk
Different countries react differently to:
inflation
interest rates
unemployment
recession
Unexpected policy changes impact asset prices significantly.
6. Strategies for Successful Global Asset Trading
1. Trend Following
Identify long-term global macro trends like:
interest rate cycles
dollar strength/weakness
commodity price trends
Ride the trend with appropriate assets.
2. Pair Trading
Trade correlated pairs such as:
Brent Crude vs WTI Crude
EUR/USD vs GBP/USD
NASDAQ vs S&P 500
This helps hedge risk.
3. Sector Rotation
Move investments between leading global sectors based on economic cycles:
Expansion → Tech & Industrials
Recession → Healthcare & Utilities
4. Carry Trades (Forex)
Borrow money in low-interest-rate currencies and invest in high-interest currencies to earn yield differentials.
5. Multi-Asset Portfolios
Balance your global trades across:
stocks
commodities
forex
bonds
crypto
This reduces portfolio volatility.
Conclusion
Trading with global assets provides unmatched access to world markets, allowing traders to benefit from trends, innovations, and growth opportunities beyond their home country. It offers diversification, 24-hour trading, exposure to global economic cycles, and the chance to profit from movements in currencies, commodities, and international stocks. However, it also introduces risks such as currency fluctuations, geopolitical uncertainties, market timing challenges, and liquidity issues.
Success in global asset trading depends on learning market behavior, following global financial news, using disciplined risk management, and applying effective trading strategies. For individuals who understand the global economy and are prepared to manage volatility, trading global assets can be both profitable and rewarding.

US500 Outlook
The US500 trades near its all-time highs, propelled by strong underlying momentum, but major financial institutions foresee a future of more moderate returns. This outlook reflects rich market valuations and a dependence on the narrow leadership of AI-linked mega-cap technology stocks, signaling a need for caution among investors.
Fundamental Analysis
The US500 sits near 6,850, a few percent below its 52-week high of 6,920, having posted mid-teen percentage gains year-to-date, driven by solid earnings and the ongoing enthusiasm for AI and productivity gains. Despite a recent catch-up in cyclicals and value sectors, performance remains highly concentrated in the largest tech names. Research from Goldman Sachs Group highlights that the US500 trades at a price-to-earnings multiple in the low-20s, which is well above long-term averages. This elevated multiple limits future multiple expansion, making forward returns extremely sensitive to robust earnings delivery.
Technical Analysis
The index currently tests 6,850, with a broader ceiling at the 6,925–7,000 range linked to prior record highs and a potential short-term topping region. The first support is seen at the 6,700–6,730 range and a deeper support zone near 6,515, which aligns with prior consolidation.
Key Risks and Outlook
The primary risks an AI sentiment reversal or earnings disappointment among mega-cap tech stocks, stickier inflation that could cap the Fed rate cuts, and any growth shock that undercuts the current 'soft-landing/mild expansion' narrative. The baseline consensus anticipates positive but more modest annual returns—roughly mid-single to low-double-digit gains per year into 2026.
This analysis is by Terence Hove, Senior Financial Markets Strategist at Exness

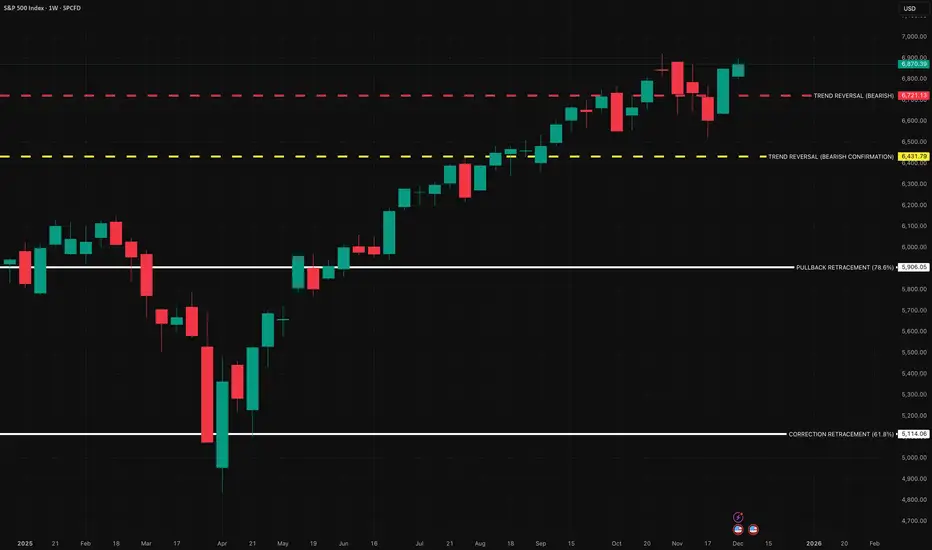
SPX — 2026 Structural Thresholds and Downside Levels To MonitorThere has been ongoing discussion in broader financial circles about long-term risk conditions. Rather than leaning into narratives or forecasts, the focus here remains strictly on the current structural levels that define the trend.
Recent volatility between November 10–17, 2025 highlighted how quickly structural momentum can shift, and if price were to revisit lower levels, the closest structural areas currently sit near approximately 5,908 and 5,114 on my charting framework.
As long as price remains structurally above the key reversal levels, the trend classification remains intact. At current levels, the nearest line separating trend continuation from structural deterioration sits around 6,721, with deeper confirmation closer to 6,431.
If those areas were ever broken with follow-through, that would represent a confirmed structural change in the existing trend — nothing more, nothing less.
Rather than forecasting outcomes, the goal here is simply to stay aware of the boundaries that define the current market structure. Price only decides direction through confirmation, not speculation.
⸻
1) Current Trend Condition [ Numbers to Watch ]
• Current Price @ 6,850$
• Trend Reversal Level (Bearish):
6,721$
• Trend Reversal Level (Bearish Confirmation):
6,431$
• Pullback Support :
5,908$
• Correction Support :
5,114$
⸻
Author’s Note
This analysis is fully reactive, not predictive. Market conditions, trend structure, and behavior are classified as they appear in real time. The objective is to identify where directional shifts first occurred, where structural integrity remains intact, and where it would begin to weaken if key levels were breached.
Predictive analysis projects outcomes that do not exist yet. Without price confirmation, prediction is built on baseless assumptions. This framework avoids that entirely by responding only to verified structural changes and live conditions.
The levels shown simply identify where the current trend structure first shifted and where it would begin to lose integrity if breached. Recognizing these boundaries allows for clearer interpretation of market behavior without relying on forward guarantees, speculative projections, or unsupported assumptions.
⸻
Methodology Overview
This classification framework evaluates directional conditions using internal trend-interpretation logic that references price behavior relative to its structural layers. These relationships are used to identify when price movement aligns with the framework’s criteria for directional phases, transition points, or regime shifts. Visual elements or structural labels reflect these internal interpretations, rather than explicit trading signals or preset indicator crossovers. This framework is observational only and does not imply future outcomes.

Foundations of Success in the Global Market1. Deep Understanding of Global Market Dynamics
Every global expansion begins with a profound understanding of how markets operate across regions. This includes analyzing demand patterns, competition, consumer behavior, regulatory environments, and geopolitical factors. Markets do not follow identical cycles; a product highly successful in one geography may fail in another due to cultural, economic, or regulatory differences.
Companies that succeed globally invest extensively in market research, scenario planning, and trend forecasts. They pay attention to currency fluctuations, trade policies, tariffs, inflation trends, and global supply chains. Furthermore, understanding demographic dividends—such as Asia’s young workforce or Europe’s aging population—helps shape long-term strategies. A sophisticated grasp of these global dynamics allows organizations to remain resilient during disruptions such as recessions, political conflicts, or inflationary periods.
2. Strong Value Proposition and Differentiation
To compete successfully in global markets, companies must offer a differentiated value proposition. Whether it is unique technology, superior customer service, competitive pricing, or exceptional product quality, differentiation forms the foundation of brand strength.
Global leaders like Apple, Toyota, and Unilever win because they combine innovation with consistent value across markets. Their products may be localized, but their core strengths—design, reliability, or trust—remain intact. Differentiation also requires understanding local competitors. In many emerging markets, domestic companies understand consumer needs better and compete aggressively on price. A global company must therefore offer something that local players cannot easily replicate.
3. Innovation and Technological Capability
Technology is the engine of global competitiveness. The world’s leading companies invest heavily in research, digital processes, AI, automation, analytics, and cutting-edge product development. Technology allows companies to scale faster, optimize costs, and improve quality.
In the global market, the rapid adoption of cloud infrastructure, digital payments, IoT, and AI-driven decision-making has become a baseline expectation. Businesses that fail to innovate eventually lose relevance, even if they previously dominated their sector.
Moreover, technology enhances global coordination. Modern supply chains rely on real-time data, tracking, forecasting, and predictive analytics. This allows companies to manage disruptions—such as shipping delays or raw material shortages—more efficiently.
4. Cultural Intelligence and Localization
Cultural understanding is one of the strongest predictors of global success. Brands that ignore cultural nuances risk alienating their target markets. Localization does not simply mean translating language—it involves adapting product features, packaging, branding, payment options, and customer experience.
For instance, global food chains modify menus to reflect local tastes. Tech companies adjust user interfaces to reflect regional preferences. Fashion brands adapt collections to climate and cultural attire norms.
Cultural intelligence also extends to building local teams. Companies that empower regional leadership often perform better because they understand local realities. Culturally intelligent companies build diverse teams, foster inclusive practices, and ensure global collaboration.
5. Financial Strength and Risk Management
Success in the global market demands strong financial planning and robust risk management. Global companies face currency volatility, geopolitical risks, regulatory changes, and tax complexities. Proper risk management includes:
Hedging currency exposure
Diversifying revenue streams
Maintaining strong cash flows
Building geographically diverse supply chains
Conducting country-risk assessments
Financial resilience also requires disciplined capital allocation—investing in high-growth regions, avoiding unprofitable expansions, and balancing short-term profits with long-term strategy.
6. Operational Excellence and Supply Chain Mastery
Operational efficiency is critical when competing in multiple markets with varying logistics infrastructures and regulatory rules. Efficient supply chain management ensures cost reduction, faster delivery, and higher customer satisfaction.
Successful global companies build flexible supply chains that can adapt to disruptions like pandemics, geopolitical tensions, or natural disasters. They diversify manufacturing locations, establish strong vendor partnerships, and invest in digital supply chain tools to improve transparency and predictive capability.
Operational excellence also includes sustainable manufacturing, lean processes, automation, and quality control across all facilities.
7. Strong Leadership and Strategic Vision
Leadership defines whether a company can successfully navigate global complexity. Visionary leaders create strategic pathways, inspire innovation, and balance global integration with local autonomy.
Successful leaders think long-term—they understand that global scale is not achieved overnight. They anticipate changes in technology, consumer behavior, and geopolitical environments. Building a global brand requires clarity of purpose, adaptability, resilience, and the ability to make decisive yet data-driven decisions.
8. Agility and Speed of Execution
The speed at which a company adapts to market changes often determines its global competitiveness. Markets evolve rapidly—trends emerge, technologies shift, and consumer expectations rise.
Agile companies respond quickly to new competitors, regulatory changes, and economic events. They make fast decisions, accelerate product development, and revise strategies based on real-time data. Agility also implies the willingness to pivot—entering new segments, adjusting pricing, or redesigning supply chains when needed.
9. Strong Branding and Trustworthiness
Global success demands a powerful, credible brand. Trust is a universal currency; companies that maintain consistent quality, honesty, and transparency build stronger customer loyalty.
Brand trust is built through:
Quality products
Ethical practices
Strong customer support
Responsible marketing
Sustainability initiatives
In today’s world, customers expect companies to demonstrate environmental responsibility and social commitment. Brands that embody these values enjoy stronger global appeal.
10. Compliance, Governance, and Ethical Standards
Operating globally requires adherence to a complex web of regulations—trade laws, data privacy rules, labor laws, environmental regulations, and industry-specific standards. Non-compliance can cause financial penalties, reputational damage, or even shutdowns.
Successful global companies maintain strong governance systems, auditing procedures, and internal controls. Ethical behaviour is equally important. Companies committed to fairness, transparency, and responsible business gain long-term goodwill and sustainable growth.
Conclusion
The foundations of success in the global market are multidimensional. Businesses must master global dynamics, innovate continuously, and adapt quickly. Cultural intelligence, operational excellence, risk management, and strong leadership form the core building blocks. While the global market is highly competitive, companies that combine vision, agility, and strategic discipline can build enduring international success. In a world where change is constant, the true winners will be those who innovate faster, understand customers better, and maintain the highest standards of excellence everywhere they operate.

Indexes Reverse ConfirmationMajor indexes, S&P, NASDAQ, DOW, SMALLCAP are testing of the April 2025 trend line. You can see this on the chart.
A move below this line would confirm that November's downward rally was wave 1 of a bear market.
If the S&P rises above 6870, this would confirm that November's rally was wave 4.
However, I believe we are in a bear market because:
1) The entire structure of the indices looks mature overall.
2) Gold is falling, regardless of the downward movement of the DXY, and they usually have an inverse correlation. Also, gold has not confirmed the ATH on silver.
3) The DXY fell throughout 2025, and now, I think it is ending the second wave, minute degree, that is, on the eve of the largest upward rally since 2022. The reaction on DXY may end near 97.85.
I wish you to be very rich!
Happy holidays!

Dec 2 - $SP:SPX Baar Flag test againSP:SPX Check Bear-flag thesis from Nov 21 and Nov 17 played out cleanly. We got the rising parallel channel after the late-Oct dump, then a decisive 1H breakdown + failure retest on Nov 20 — classic continuation, not a fakeout. Since then, structure is still bearish (lower highs/lows), and today’s candles are impulsive enough to treat bounces as corrective until proven otherwise.
SP:SPX
Lets see, what it does today.
#SPX #SP500 #BearFlag

S&P500 breakout retest? S&P 500 Trading Summary
Markets started December on weak footing, with risk assets and bonds under pressure. A global rates selloff, triggered by hawkish comments from BoJ Governor Ueda that pushed 10yr JGB yields to post-GFC highs, spilled into the US and Europe. Treasury yields jumped sharply, with the 10yr +7.2bps, its biggest rise in nearly a month.
At the same time, US data disappointed: the ISM manufacturing print took on a stagflationary tone, and higher oil prices amplified inflation concerns. This combination of higher yields + weaker data weighed on equities, leaving the S&P 500 down –0.53%.
Crypto-related volatility added to the risk-off sentiment, with Bitcoin down over 5% and major crypto-linked ETFs suffering steep year-to-date losses, though investor demand for such products remains surprisingly resilient.
On the consumer side, Cyber Monday spending grew more slowly in the US compared to Europe, partly reflecting tariff-driven pressures on US shoppers. While global online spending rose about 5%, the US lagged at 2.6%.
Overall: The session reflected renewed rate fears, stagflation worries, and softening US consumer data, all contributing to a softer tone for the S&P 500.
This communication is for informational purposes only and should not be viewed as any form of recommendation as to a particular course of action or as investment advice. It is not intended as an offer or solicitation for the purchase or sale of any financial instrument or as an official confirmation of any transaction. Opinions, estimates and assumptions expressed herein are made as of the date of this communication and are subject to change without notice. This communication has been prepared based upon information, including market prices, data and other information, believed to be reliable; however, Trade Nation does not warrant its completeness or accuracy. All market prices and market data contained in or attached to this communication are indicative and subject to change without notice.

Upcoming Rally?
Found an intersting pattern Gap-Rally-Tank. Right now we just had a tank but might not be done yet. So will we see another gap and rally soon?

S&P whats gonna happen next?
There are 3 very large support and resistance zones the S&P has been at for the bast week or so. I can kinda see a head and shoulders but I don't know if it will break the support or the highest resistance. What do you guys think?
