S&P500: Stocks and Tariff, what is next?US indices were bullish so far despite the NEW HUGE tariffs. As the tariffs become in play by Aug 1st, we shall see its effect in Q3 results, Q2 earnings beats, but will Q3 do ?
Disclaimer: This content is NOT a financial advise, it is for educational purpose only.
SPX500USD trade ideas

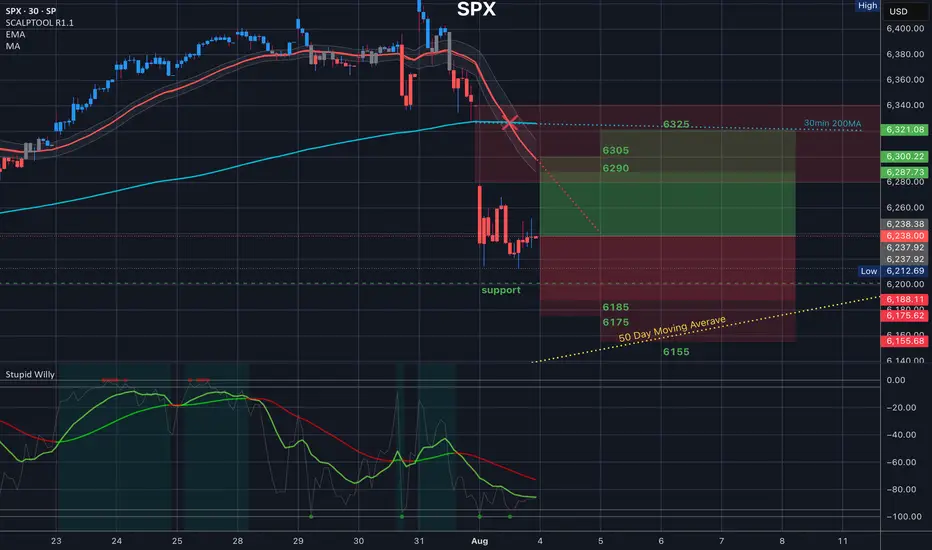
$SPX Analysis, Key Levels & Targets 8.4.25
Today’s Trading Range - we have a great range expansion here from last Friday’s drop. Some interesting targets here. Let me know what you see.
S&P500 corrective pullback key support at 6200Key Support and Resistance Levels
Resistance Level 1: 6316
Resistance Level 2: 6374
Resistance Level 3: 6430
Support Level 1: 6200
Support Level 2: 6112
Support Level 3: 6073
This communication is for informational purposes only and should not be viewed as any form of recommendation as to a particular course of action or as investment advice. It is not intended as an offer or solicitation for the purchase or sale of any financial instrument or as an official confirmation of any transaction. Opinions, estimates and assumptions expressed herein are made as of the date of this communication and are subject to change without notice. This communication has been prepared based upon information, including market prices, data and other information, believed to be reliable; however, Trade Nation does not warrant its completeness or accuracy. All market prices and market data contained in or attached to this communication are indicative and subject to change without notice.

$SPY $SPX SELLIt is time. For SPX today I sold SP:SPX 6420/6435 bear call spreads here. First order filled for 7.20, Back up orders at 6430/6445.

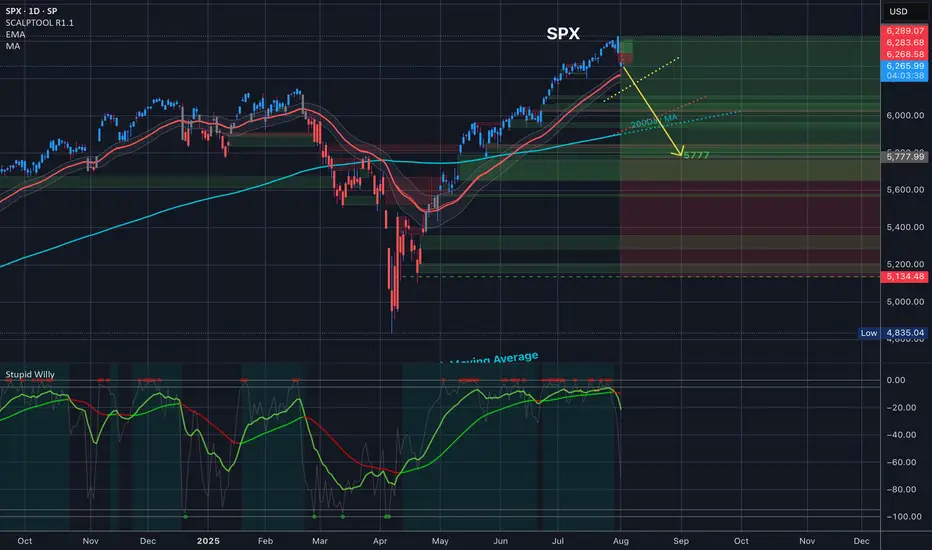
$SPY $SPX 5777 Target for end of AugustAMEX:SPY SP:SPX 5777 Target for end of August
What do you guys think here?
Price breakout below Keltner bandThe price has shown a breakout after the squeeze below the keltner band and may signal a more bullish trend.

Potential bearish drop?S&P500 is rising towards the pivot, which is a pullback resistance that aligns with the 61.8% Fibonacci retracement and could drop to the 1st support.
Pivot: 6,362.20
1st Support: 6,214.78
1st Resistance: 6,436.72
Risk Warning:
Trading Forex and CFDs carries a high level of risk to your capital and you should only trade with money you can afford to lose. Trading Forex and CFDs may not be suitable for all investors, so please ensure that you fully understand the risks involved and seek independent advice if necessary.
Disclaimer:
The above opinions given constitute general market commentary, and do not constitute the opinion or advice of IC Markets or any form of personal or investment advice.
Any opinions, news, research, analyses, prices, other information, or links to third-party sites contained on this website are provided on an "as-is" basis, are intended only to be informative, is not an advice nor a recommendation, nor research, or a record of our trading prices, or an offer of, or solicitation for a transaction in any financial instrument and thus should not be treated as such. The information provided does not involve any specific investment objectives, financial situation and needs of any specific person who may receive it. Please be aware, that past performance is not a reliable indicator of future performance and/or results. Past Performance or Forward-looking scenarios based upon the reasonable beliefs of the third-party provider are not a guarantee of future performance. Actual results may differ materially from those anticipated in forward-looking or past performance statements. IC Markets makes no representation or warranty and assumes no liability as to the accuracy or completeness of the information provided, nor any loss arising from any investment based on a recommendation, forecast or any information supplied by any third-party.

SPX range bound unit September expirationExpect sideways wave 4 to last 4 weeks, volatility, (small positions: sell up, buy dips or do NPOTHING and hold. Basically these types of Wave-4 are where traders loose money from Wave-3.
US500 Pulls Back from 6,400– Correction or Trend Shift?The index has rejected the 6,400 🔼 resistance zone with a strong bearish candle, pulling back toward the 6,200 🔽 support region. Price is still trading within a bullish structure, but this drop may signal early signs of exhaustion.
Support Levels: 6,200 🔽, 6,100 🔽, 6,000 🔽
Resistance Levels: 6,300 🔼, 6,400 🔼
Bias:
🔼 Bullish: If price holds above 6,200 and reclaims 6,300, the uptrend remains intact and bulls may reattempt a push toward 6,400.
🔽 Bearish: A daily close below 6,200 could open a deeper retracement toward 6,100 or even 6,000.
📛 Disclaimer: This is not financial advice. Trade at your own risk.

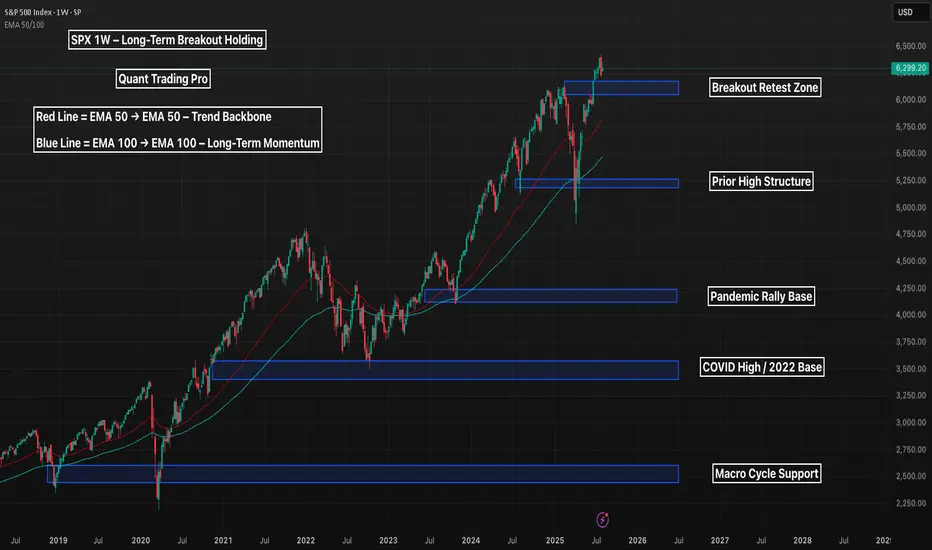
SPX 1W – Long-Term Breakout Holding, Can the Rally Sustain?The S&P 500 just printed a weekly breakout above historical highs, tapping into uncharted territory above 6,300 — but now the question is whether the trend can sustain or if a deeper retest is on the horizon.
🔹 Macro Structure
Multiple clean support levels exist below, each marking prior macro pivots — from the 2020 breakout to the 2022 base.
The most immediate zone of interest is 6,100–6,200, which could act as a bullish retest zone if this breakout is valid.
Deeper downside remains structurally healthy unless 4,250 or below is breached.
🔹 Trend Health
Price remains well above the EMA 50 and 100, showing no signs of structural weakness.
Pullbacks into the EMAs historically triggered trend continuation — and bulls will likely treat those zones as reload points.
🔹 Big Picture
As long as SPX holds above 5,400, the macro bull trend remains intact.
A drop to retest lower zones wouldn’t necessarily break the uptrend — but it would shake sentiment and invite reaccumulation.
Is this the beginning of a new macro leg — or the last shake before a deeper correction?
Let’s chart it out 👇
Rob the Rally SPX500: Enter Before Resistance Catches You🦹♂️💎 “SPX500 Vault Breach – Layered Robbery in Progress!” 💼📈
(Thief Trader's Multi-Limit Entry Bullish Blueprint – No Mercy, Just Money)
📍Asset: SPX500 / US500
🎯Plan: Bullish Heist
🧠Style: Layered Limit Orders | Thief Strategy Entry | Zero Mercy Execution
📈Target: 6600.00
🛑Stop Loss: 6200.00
💣Entry: Any level — thieves adapt, not wait!
🌍 Welcome to the Global Robbery Room, Traders!
It’s your boy Thief Trader, back in the vault with another plan to crack the SPX500 like a safe on Wall Street. This one’s for the bold bulls who like to rob with precision, not permission. 🎯💰
💼 The Setup – High Stakes, High Floors
SPX500 is lining up for a classic breakout breach. This isn’t just technical — it’s tactical warfare. Market noise? Ignore it. We operate on strategy and steel nerves. 🧠🔫
🔥 Entry Protocol – Layer Up or Miss Out
🧱 Multiple limit orders across price zones — like planting C4 charges on every door.
🎯 Enter wherever price dips — don’t wait for permission from retail traders.
🎯 No fixed entry — this is Thief Layering: get in where you fit in.
🚪 Escape Plan – Stop Loss Strategy
📍 SL: 6200.00
Why? That’s where the guards start showing up. If price drops below, we vanish.
💡 Be flexible — smart robbers don’t get caught, they regroup.
💎 Target Loot – The Golden Zone
📍 Primary TP: 6600.00
Once we breach the 6500+ resistance, it's a moonwalk. Lock gains or trail with confidence.
📢 Warning for Scalpers & Swing Thieves Alike:
Only play Long-side. Don’t try to rob both ends — that’s suicide.
Big wallet? Scale heavy. Small bag? Layer light but tight.
Always use trailing stops — never trust the market with your escape bag. 🎒💸
📊 Thief Intel – Why We’re Bullish
✅ Index rotation favors large-cap strength
✅ Macro sentiment + institutional bias points UP
✅ No bearish COT signals in sight
✅ Fed tone & economic backdrop: neutral to supportive
This isn’t hopium. It’s strategy.
🚨 NEWS FLASH – Stay Stealthy!
Do NOT enter during economic bombs 💣 (NFP, CPI, Fed minutes, etc.)
Market noise kills precision. We only move in silence and with SLs trailing tight.
💬 Smash that BOOST 💖 if you’re riding with the Thief Army.
Share this plan, spread the word, and let’s rob the markets the smart way.
📢 Tag your crew, stack your layers, and let’s hit 6600 like pros.
📌Disclaimer: Not financial advice — this is a market operation plan for educational use. Trade at your own risk. Smart thieves plan exits before entries. 💼📉📈
🦹♂️ Thief Trader out.
💸 Rob smart. Rob clean. Rob global.

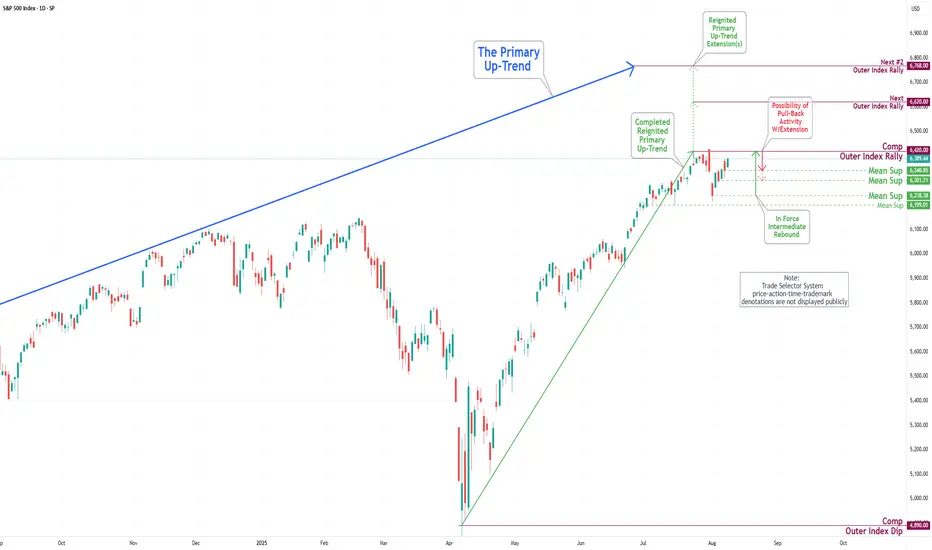
S&P 500 Daily Chart Analysis For Week of August 1, 2025Technical Analysis and Outlook:
During the trading activity of the previous week, the S&P 500 Index displayed a predominantly bearish movement after completing our Outer Index Rally target of 6420, as highlighted in the prior week’s Daily Chart Analysis, with the primary objective now being to plug our Mean Support at 6200.
It is essential to recognize that the current price movement may trigger a significant further pullback to the Mean Support level of 6090. Following this downturn, it is expected that the index will resume its upward momentum, aiming for a retest of the Outer Index Rally peak at 6420.

S&P 500 Daily Chart Analysis For Week of August 8, 2025Technical Analysis and Outlook:
During the trading activity of the previous week, the S&P 500 Index exhibited a predominantly bullish trend and is poised to retest the completed Outer Index Rally target of 6420, as outlined in last week’s Daily Chart Analysis. The primary objective now is to target subsequent levels, specifically the next Outer Index Rally target of 6620 and beyond.
It is crucial to recognize that the current price movement may initiate a substantial pullback from the present price action, either before or following the attainment of the Outer Index Rally peak at 6420.

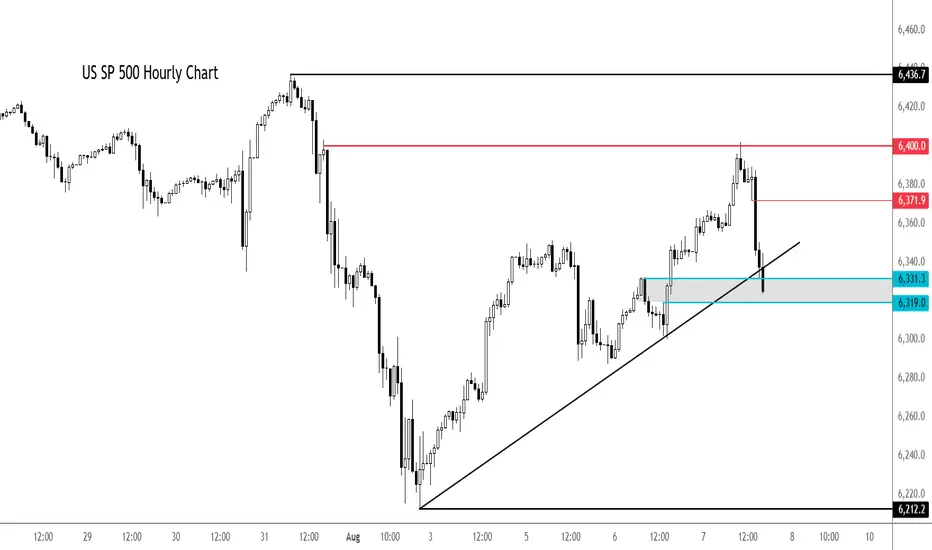
S&P 500 extends drop - can dip buyers come to rescue again?After a decent rally earlier in the day, the major indices and futures started to ease off around mid-morning London trade, before easing further lower in the last couple of hours.
At the time of writing, the S&P was testing its session lows. Here it was probing support and a short-term bullish trend line in the 6319-6331 range. This area needs to hold to keep the bulls happy and in charge. Break this and we could see a bigger correction in the days ahead.
Resistance now comes in at 6372 followed by 6,400.
By Fawad Razaqzada, markets analyst with FOREX>com
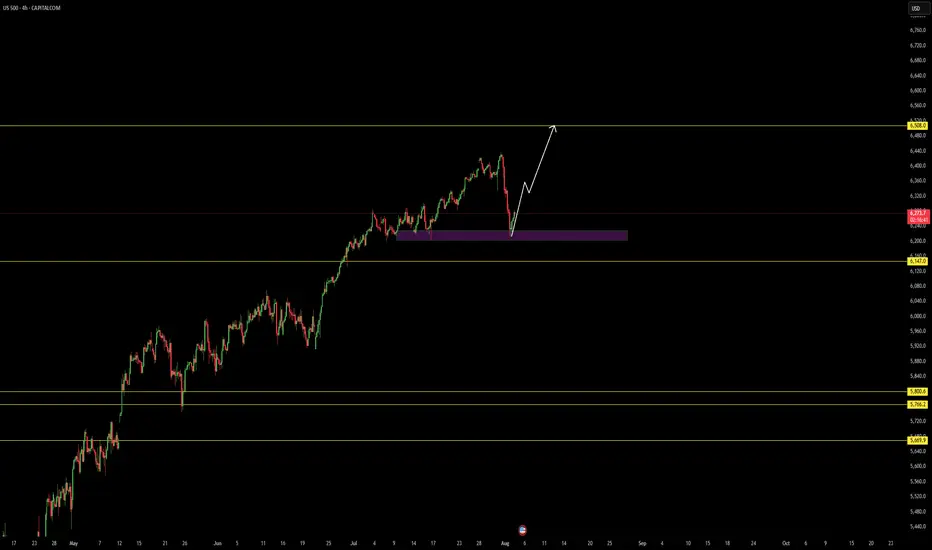
Fundamental end volumeThe S&P 500 has corrected from the margin level, as shown in the previous analysis, and is now rebounding. Large targeted volumes were injected from the 1/2 margin support for a breakout to new highs, with a growth target of 6500 and above. Recommendation: Buy
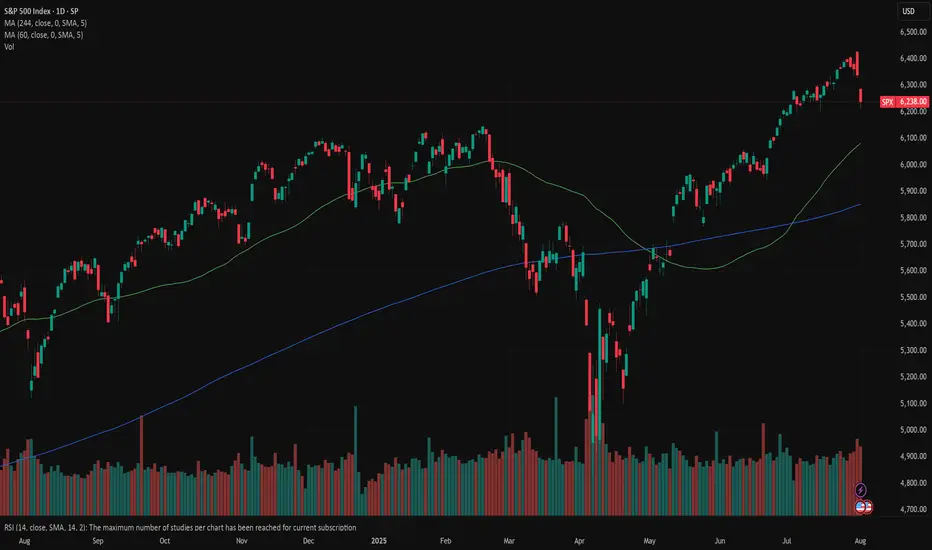
SPX: Investors` defensive positioning? The past week brought a flurry of important US macro data and a high market volatility in line with it. In addition, the FOMC meeting brought up increased nervousness regarding Fed's view on current and future macroeconomic developments. As Fed Chair Powell informed the public, the inflation is perceived to pick-up a bit as a reflection of imposed trade tariffs, but the Fed is not expecting that it will have a significant effect on increasing inflation, but only the one-off effect. Future Fed moves will continue to be data dependent and risk-assessed, in which sense, a direct answer to potential September rate cut was not provided by Fed Chair Powell.
Although Friday brought up some major market corrections in the S&P 500, Thursday's trading session was the one to bring major sentiment and indication over forthcoming correction. Namely, Thursday started in a positive manner, where the index reached a new all time highest level at 6.427, but soon after the market tumbled down, ending the trading day at 6.333. Futures were traded lower on Friday, where the S&P 500 was opened by 1,5% lower, ending the week at 6.238. These movements during the last two trading days are quite important because such strong moves in the value of index could be imposed only by institutional investors, showing their sentiment regarding the macro environment expectations at this moment.
Much of the negative market sentiment was driven by surprisingly weak non-farm payroll data of only 73K in July, which was below market estimate of 110K. At the same time, the unemployment rate modestly picked up in July to 4,2%, from 4,1% posted previously. Some analysts are noting that this could be a summer seasonal effect, however, investors are concerned that this could be a sign of a weakening US economy, due to implemented trade tariffs. During the time of writing this article, CNBC posted a news that the U.S. President Trump ordered immediate release of a duty of a Commissioner of labor statistics, due to continued posts of inaccurate labor data and its frequent revisions, also putting doubts that the July figure of 73K is accurate.
Regardless of actual accuracy of the US jobs data, investors continue to be concerned regarding the effects of implemented trade tariffs on earnings and growth of US companies. As analysts are noting, some of them are trying to lock in gains as earnings risks emerge, but with future uncertainties, a defensive positioning of investors might be wider in the coming period.
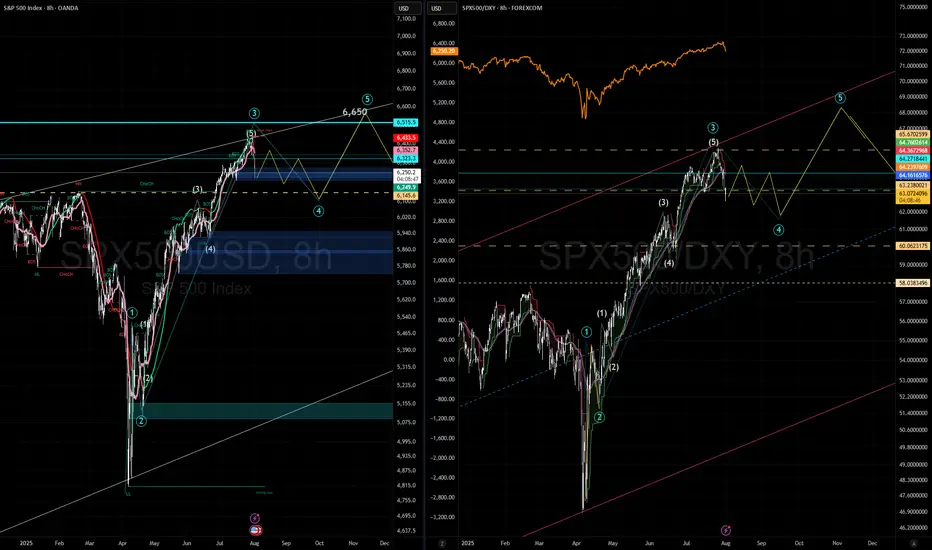
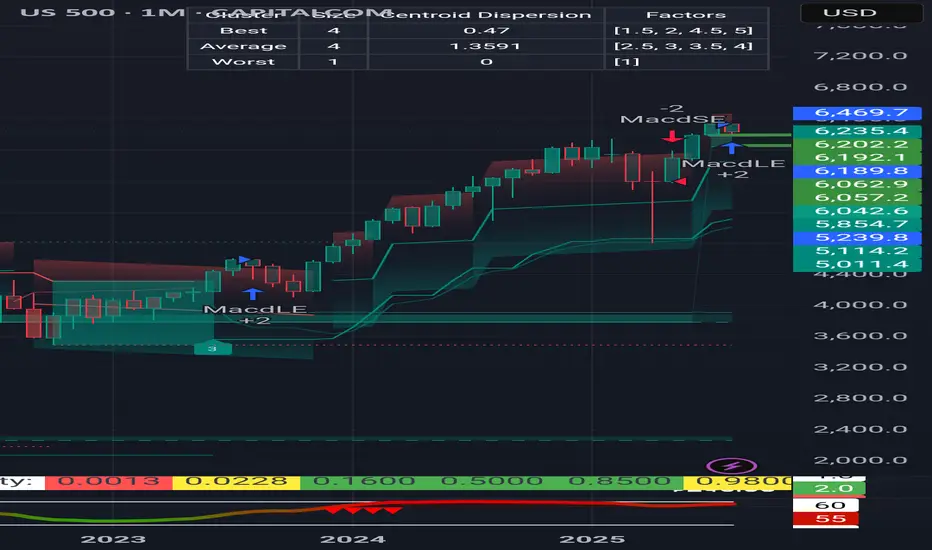
S&PS&P 500 waiting for overbought of 240 min. If it pass 6427 net resistance is about 6615. at this resistance there is a chance to drop 1 oversold of timeframe 240 min. however, it is on a long up trend, which the mid period target is 6952 (2-4 months). however, during this period it may go direcly to 6952 or down for 1 oversold of timeframe day or 240 min is OK. Note that the very importance supporting line,which should not be lower is at 4841. if it not fall below this point. S&P still on the uptrend.

Activation of the rounded pattern? Or a trend reversal?In the previous analysis, we mentioned that the price was at a decision point — and it made its decision, managing to move up slightly before returning to the bottom of the channel.
Now, at the end of the channel, a pattern has formed. We need to see whether it gets activated or turns out to be a fake.
If the pattern fails (turns out fake), the bullish trend could continue more strongly.
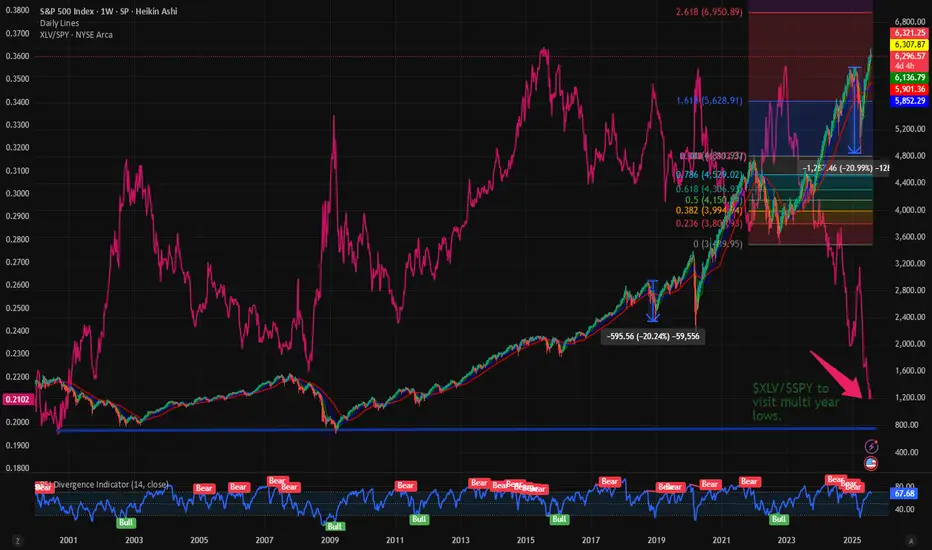
$XLV vs $SPY at multi year low. Is more downside expected? In this space we talk a lot about the market outperformance and how this has resulted in indexes at ATH. The SP:SPX and NASDAQ:NDX and their corresponding ETFs: NASDAQ:QQQ and AMEX:SPY have also made ATHs. But if peel under the surface we can observe that very few sectors have consistently outperformed the S&P 500. The Technology sector represented by AMEX:XLK has consistently outperformed the $SPY. The $XLK/ AMEX:SPY is in a upward channel depicted by the purple line. The SPDR select sector Technology sector has consistently increased its weightage on AMEX:SPY and the ratio $XLK/ AMEX:SPY is currently at 0.41 which is an ATH.
But the same cannot be told about the SPDR Healthcare Sector. The ratio between $XLV/ AMEX:SPY is making multi year low. With the ratio currently at 0.21 it is approaching its multi-year lows of 0.1975. The ratio was so low last in Sept 2000. Hence the question comes what should we expect the AMEX:XLV which is making new lows against the AMEX:SPY ? Will we visit the lows of 0.1975? If it happens then can we expect a upward momentum from his double bottom situation?
In my estimate in this bull market and Tech sector outperforming the AMEX:XLV will make new lows vs AMEX:SPY and the ratio will revisit the 2000 lows. But if on the macro front we have weak jobs numbers and recession risk rising then the AMEX:XLV can in fact draw inflows and outperform the index. Hence my estimate $XLV/ AMEX:SPY will sweep the multi-year low and then bounce back into 2026.
Verdict: Still more downside possible in $XLK/$SPY. Go long AMEX:XLV when the ratio is @ 0.1975 and into 2026.
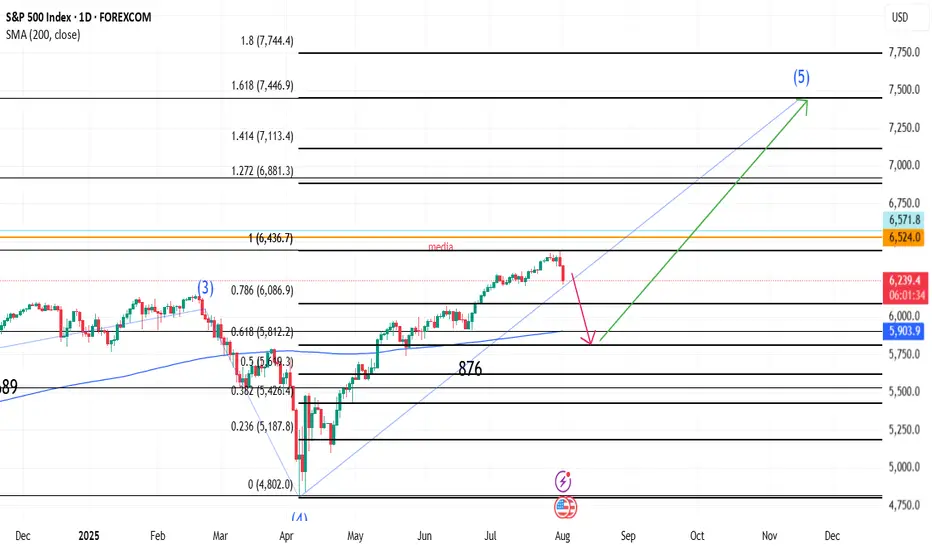
SPX correction to 5800 then 7445In my view current correction could stop in 5800 area where bullish trend could resume to target 7445 area in November
Correction will be to 6050-6190, probably the upper limit Now I notice something very important and things and the analyses of many actually coincide. Monthly support from the accumulated volume lies between 6050 and 6170. 4h indicators show a clear reversal. Separately, at these levels are the previous ATH. In my opinion, it is possible to stop even at 6180-6190. We will probably start with a gap on Monday. Now here comes the moment and over the weekend what will take place as conversations and statements in the media, but it is very likely that the minimum could happen as early as Monday night (USA time) or by Tuesday. I agree that this correction was necessary and should have happened as soon as possible because things became difficult even for bulls like me.
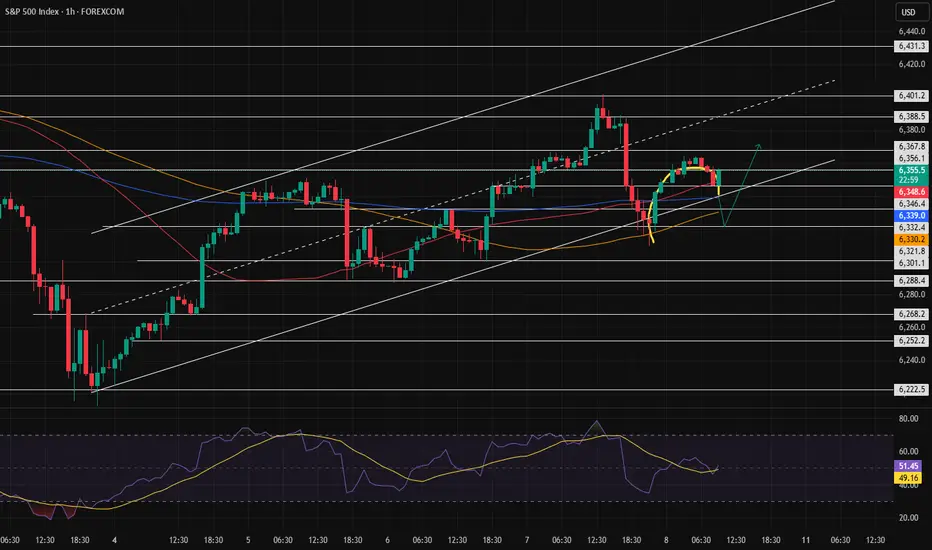
The Low Is In: Why the S&P 500 Just Confirmed a Bullish Reversal🔥 The Low Is In: Why the S&P 500 Just Confirmed a Major Bullish Reversal 🔥
The market just gave us a gift.
After weeks of drifting lower and sentiment turning cautious, the S&P 500 has touched — and bounced — off a critical rising trendline for the third time since May 2025. That third touch isn't just a technical coincidence… it's often the launchpad for a new impulsive leg higher.
📈 The Power of the 3rd Touch: Trendline Validation Complete
Look at the chart. This isn’t guesswork. Since May, the S&P 500 has been respecting a well-defined ascending trendline, one that connects multiple higher lows during this bull run.
The first touch was the May liftoff after the April consolidation.
The second came in June — a clean retest and bounce.
Now, as of early August, the third touch has held once again, exactly where the bulls needed it most.
This isn’t a random line on a chart. This is institutional flow stepping in to defend structure.
And when a rising trendline holds for a third time after a strong uptrend? That’s a classic continuation signal.
📉 RSI Washout + Structural Support = Perfect Storm for a Bottom
The RSI printed a dramatic dip to ~32, a level that screams “oversold” on the 4-hour timeframe. But notice the context — it happened right at structural support.
This is not weakness. This is accumulation.
Big players shake out weak hands on low timeframes… right before they send it.
🧠 Sentiment Is Offside… Again
Let’s not forget: this retrace came after a huge run-up since March. People expected a deeper correction. Bears started getting loud again.
That’s how bull markets trap you — by convincing you it’s over right before the next leg higher.
And with macro tailwinds (liquidity expansion, fiscal spend, tariff rollbacks), earnings season beats, and global capital rotation into U.S. equities, this setup is ripe for a violent upside squeeze.
🚀 8,700 in Sight: My End-of-Year Price Target Is Very Much in Play
Today’s close around 6,220 means the S&P 500 would need to rally ~40% to hit my target of 8,700 by year-end.
Sounds crazy? Not if you’ve seen what happens during parabolic melt-ups.
This isn’t just hope:
📊 Strong breadth under the surface
🏛️ Dovish policy pivot now expected in Q4
💸 Retail and institutional capital both re-engaging
📉 Bond yields are starting to roll over, supporting equity valuations
When bull markets enter their euphoria phase, they don’t stop at “reasonable” targets. They blast through them.
💡 The Setup Is Textbook — Now It’s About Execution
✅ Trendline defended
✅ RSI reset
✅ Sentiment shaken out
✅ Structure intact
The technicals just aligned with the macro. The low is in — and the runway to 8,700 is wide open.
Strap in. Q4 could be one for the history books.
