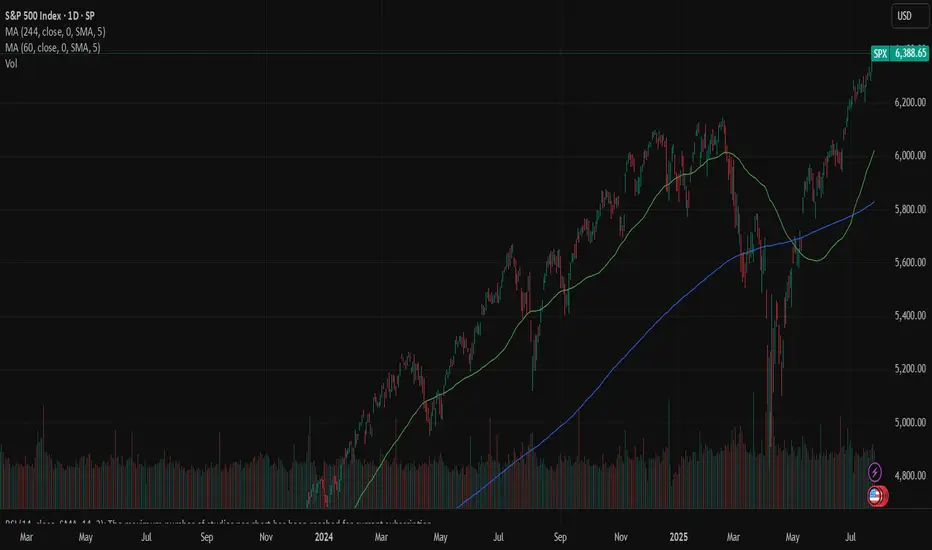
SPX: Tariffs deal (un)certainty Investors' optimism continued to hold at the U.S. equity markets another week in a row. The S&P 500 posted another weekly winning streak, supported by solid earnings of companies included in the index. The index also reached another all time highest level, with Friday's level of 6.388, gaining around 1,5% for the week.
Tech companies were once again main contributors to the surge of the index. Alphabet posted better than expected quarterly results, supporting the surge in share price of 4%. Tesla shares gained 3,5% for the week. The company reported strong vehicle delivery numbers and progress in AI-driven autonomous driving technology. Analysts are noting that 82% of all companies included in the S&P 500 index, that have already reported quarterly results, have beaten the market expectations.
Alongside strong earnings reports, recent advancements in U.S. trade negotiations have contributed to market gains. Earlier this week, President Donald Trump announced a significant trade agreement with Japan, which includes a 15% reciprocal tariff arrangement—an important step toward redefining trade terms between the two nations. Additionally, the U.S. and Indonesia have reportedly reached a framework agreement for a trade deal, reflecting a broader U.S. effort to strengthen and stabilize trade partnerships in Asia. On Friday, President Trump expressed confidence that more trade agreements will be finalized ahead of the August 1 deadline for new tariffs. One of these possible deals involves the European Union. Investors have welcomed these developments, as they help reduce tariff-related uncertainties and ease concerns about escalating trade disputes that could disrupt global supply chains and impact corporate earnings.
The week ahead brings a bunch of important macro data for the U.S. as well as the FOMC meeting, where Fed members will discuss a potential change in interest rates. Markets are currently not expecting that the Fed will make a move at this meeting. Certainly, with JOLTs, NFP, PCE data in combination with the FOMC meeting, the week ahead might bring back some higher volatility in the US equity markets, in case of any unexpected news.
SPXM trade ideas
sp500 up to 6535sp500 with in my pov target to 6535 by a flag created maybe and with this super upside trend for these days

Things are about to get wild. Just for fun... Hey, it can happen... right? 🤔😉
85% drop then.. hyper inflation.
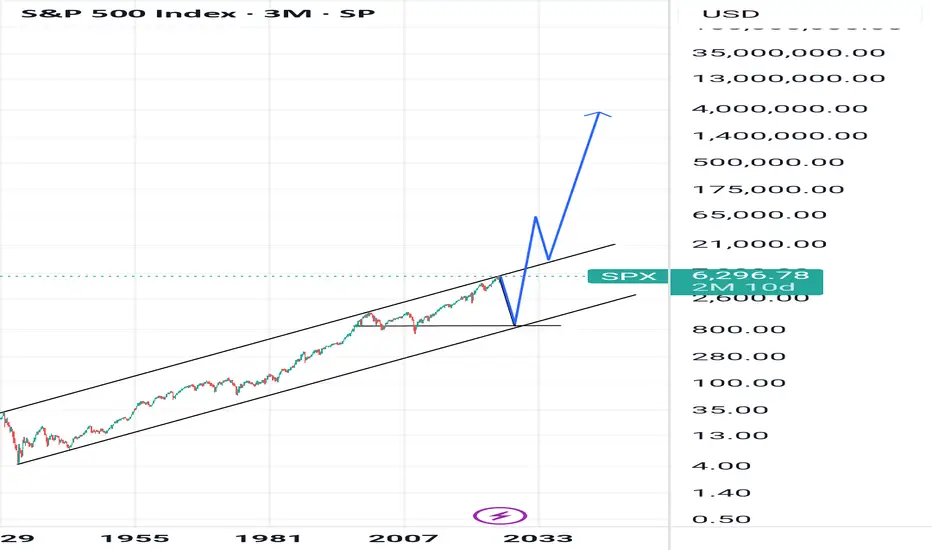
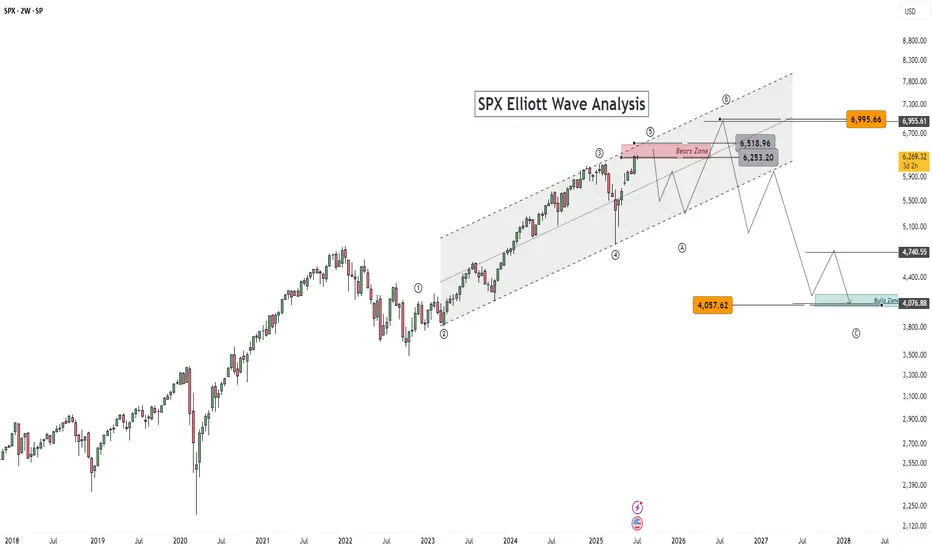
S&P 500 weekly timeframeS&P 500 in g of G of diametric aiming for ~8000 in 2026-27 and ~11000-13000 for 2029-2030
So every correction would be temporary until then

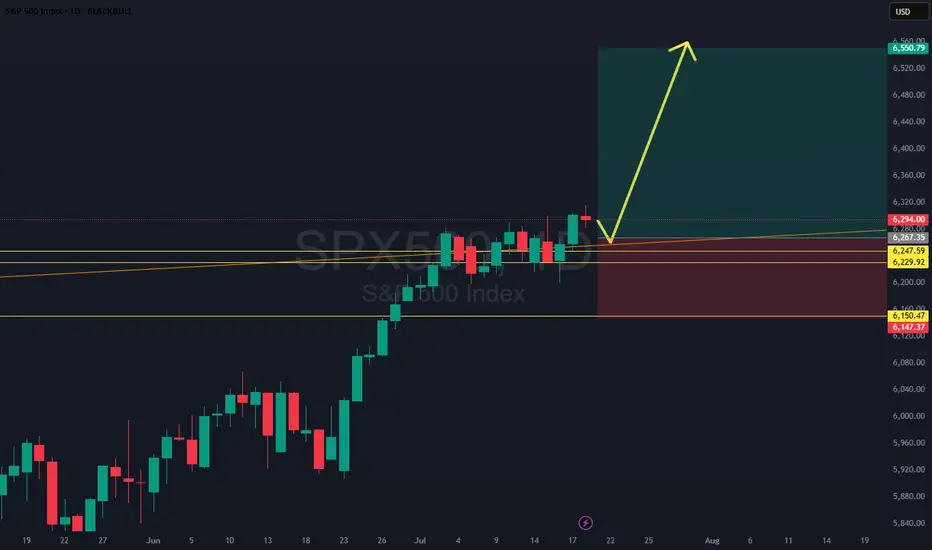
SPX500: Clean Breakout Setup - Trade of the Week?SPX500 just broke and closed above a key daily level, confirming strength after a bull flag formed off a skinny leg up. The plan? Wait for a retest of that flag structure, then ride momentum higher. We’ve got a conservative stop below solid support, making this one of the cleanest, most technically sound setups of the week. Only watch-out: price may not give the retest and could continue running. Either way, structure favors the bulls.
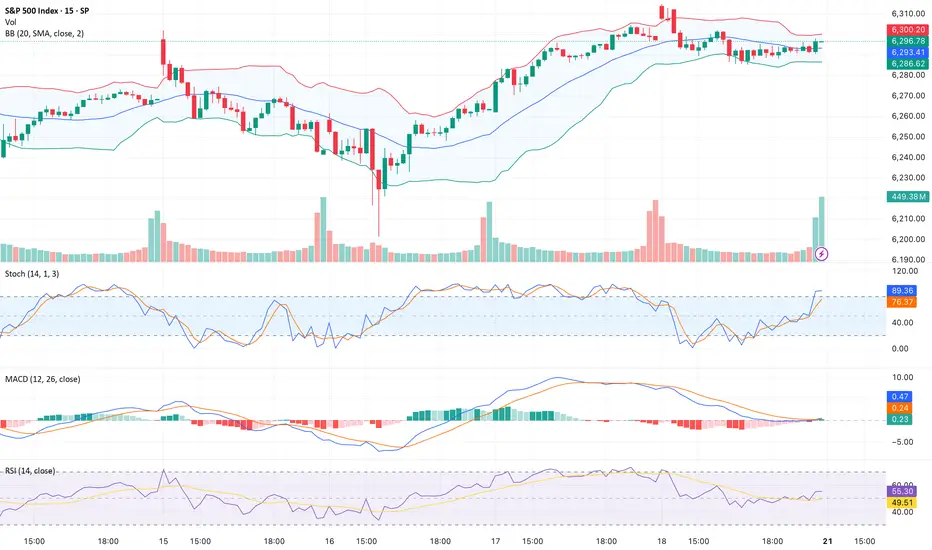
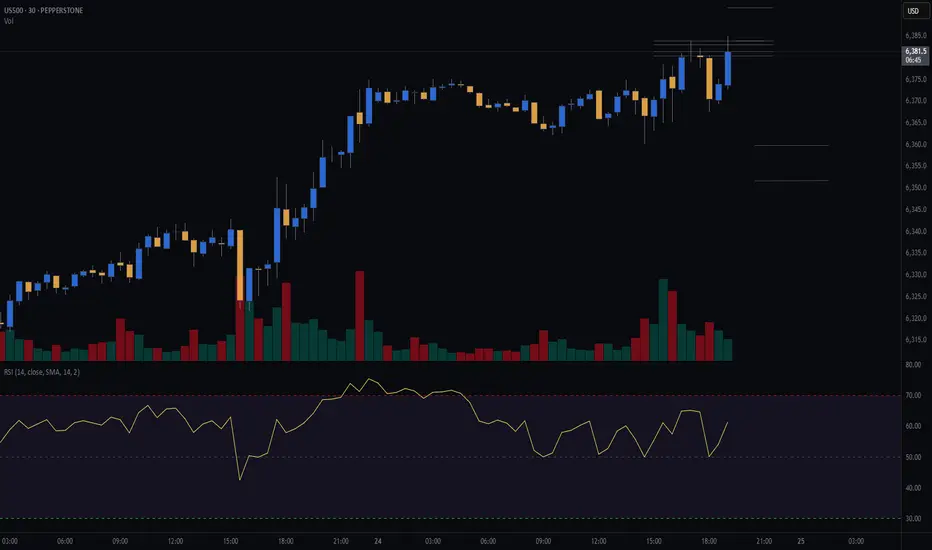
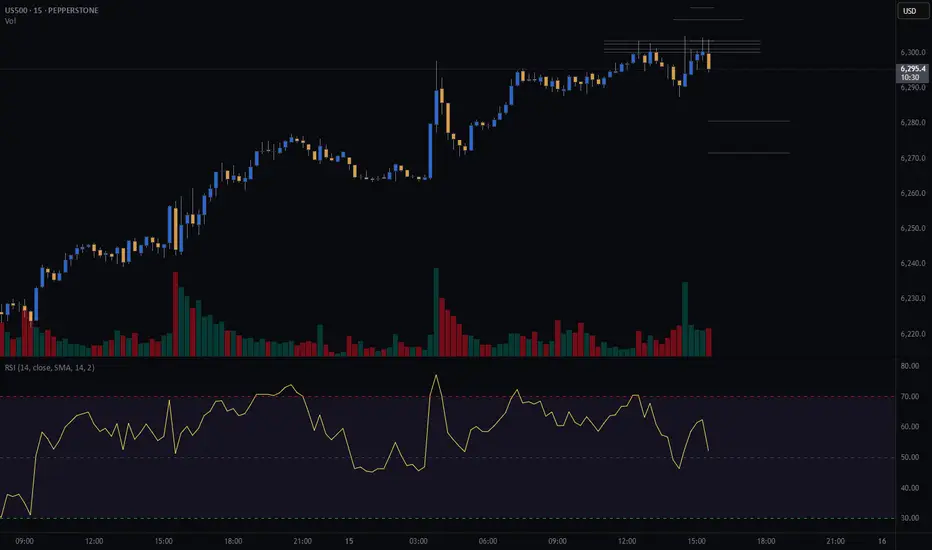
15_MinThis is a 15-minute timeframe chart, where each candlestick represents 15 minutes of trading activity. It is primarily used by intraday traders and scalpers to identify short-term trends, breakout zones, and momentum plays.
This chart of the S&P 500 (SPX) reflects intraday movements with real-time tracking of support/resistance zones, volume spikes, and short-term patterns.
S&P (CASH500) SHORT - Double top 30minRisk/reward = 2.7
Entry price = 6384
Stop loss price = 6393.8
Take profit level 1 (50%) = 6359.8
Take profit level 2 (50%) = 6351.8
Will get confirmation of remaining variables at close of this 30min candle at 19.30.
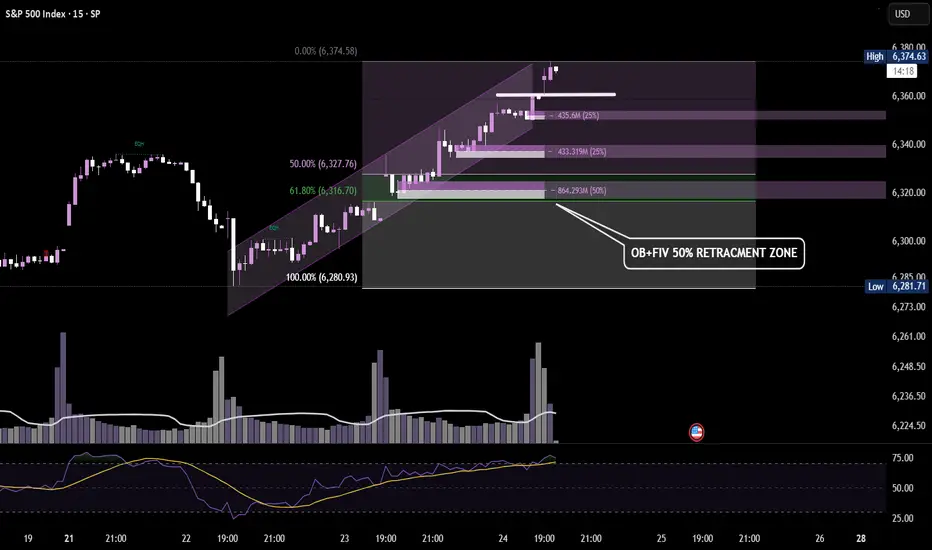
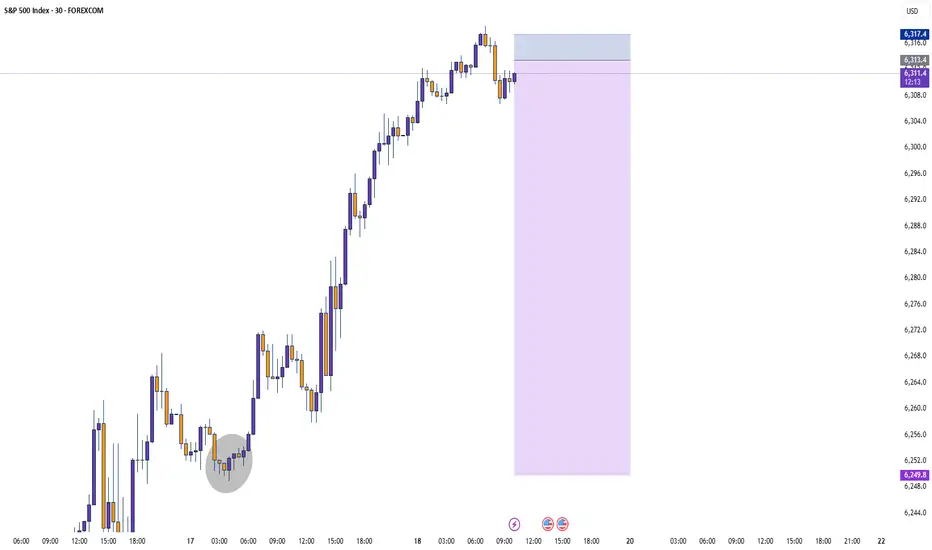
S&P 500 – 15Min Chart BreakdownPotential retracement zone aligning with Order Block + 50% FIB.
Watching for bullish reaction near 6320–6316 — key confluence zone for a possible continuation leg. 🔁📈
Waiting for a Clear Signal: Too Early to Short the IndexNothing interesting is forming on the index so far.
My outlook remains neutral.
I previously attempted to short it, but those attempts were unsuccessful. Now I need to wait for a more reliable entry point — the chart will show the way.
For now, I’m staying on the sidelines.
Historically, the start of the Fed’s rate-cutting cycle has always coincided with the beginning of a decline in the stock market. I believe this time won’t be an exception — but for now, it’s too early to short.
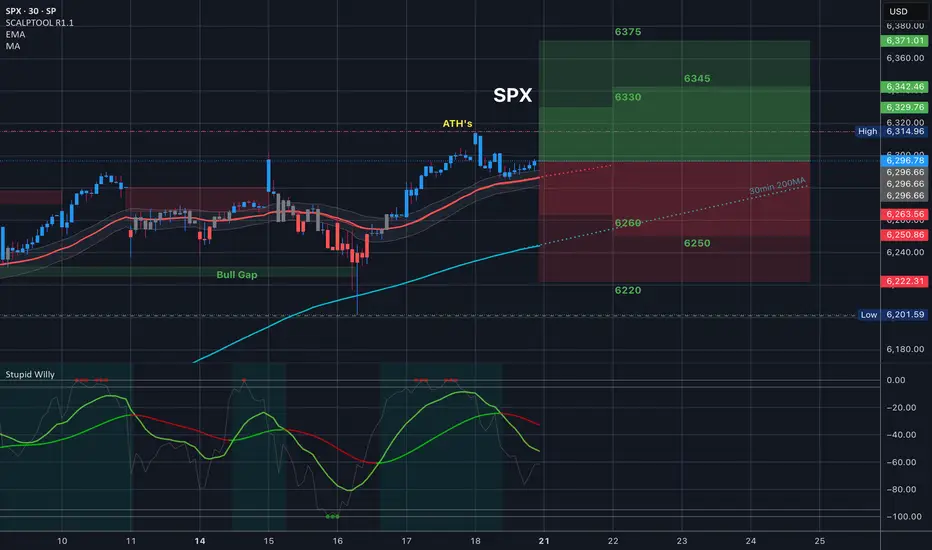
$SPX Trading Range for 7.21.25 and everything in itToday’s Trading range and everything in it. How are you playing it?
SPX500USD is on a riseHi traders,
Last week SPX500USD started the next impulse wave 5 (grey) as I've said in my outlook.
Next week we could see more upside for this pair.
Let's see what the market does and react.
Trade idea: Wait for a small pullback and a change in orderflow to bullish on a lower timeframe to trade longs.
NOTE: the next three weeks I'm on holiday so I will not post any outlook publicly.
If you want to learn more about trading FVG's & liquidity sweeps with Wave analysis, then please make sure to follow me.
This shared post is only my point of view on what could be the next move in this pair based on my technical analysis.
Don't be emotional, just trade your plan!
Eduwave

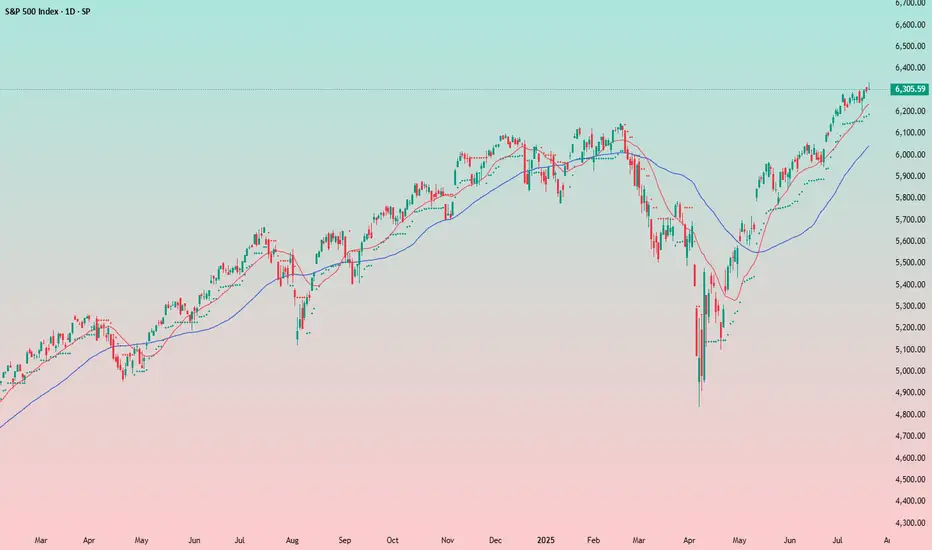
SPX chit chat... we're still up for nowAfter that crazy April 2025 crash, it feels like we should not be this high so fast... that's how I felt before too. But the rising channel is holding up right now. We are approaching the top. In previous times, the market grinded even higher (COVID pandemic was the last example).
Today we squeezed out new ATHs. The month ends next week and a new one begins. Less fear; more charts for the rest of the year.
See you in August!

S&P500 sideways consolidation breakoutKey Developments:
Fed Politics: Treasury Secretary Scott Bessent called for a review of the Fed’s $2.5B HQ renovation, continuing political pressure on Jerome Powell. This adds to the uncertainty around Fed independence and rate path.
Meme Stock Surge:
Opendoor soared 121% amid a retail-driven frenzy.
Major institutional investors are also chasing the rally, pushing broader equities to record highs.
However, upcoming Alphabet and Tesla earnings could be a turning point for momentum.
Corporate News:
Hewlett Packard Enterprise suffered a $985M loss in the Autonomy case—corporate governance and M&A risks in spotlight.
Sarepta paused drug shipments amid backlash—biotech volatility rising.
LA Times plans IPO—media valuations may resurface.
Crypto Moves:
Trump Media bought $2B in Bitcoin and related assets, aiming to become a crypto treasury.
JPMorgan may lend against crypto, signaling broader institutional adoption.
Tech & AI:
MIT’s Andrew Lo predicts AI will make real investment decisions in 5 years.
OpenAI–Oracle to expand US data center capacity by 4.5 GW—significant tech infrastructure tailwind.
Conclusion for S&P 500 Trading:
The S&P 500 remains supported by strong risk appetite, AI optimism, and crypto momentum, but faces near-term tests from key tech earnings (Alphabet, Tesla). Political noise around the Fed and signs of speculative froth (meme stocks) could introduce volatility. Stay bullish with caution—watch earnings and Fed commentary closely for market direction.
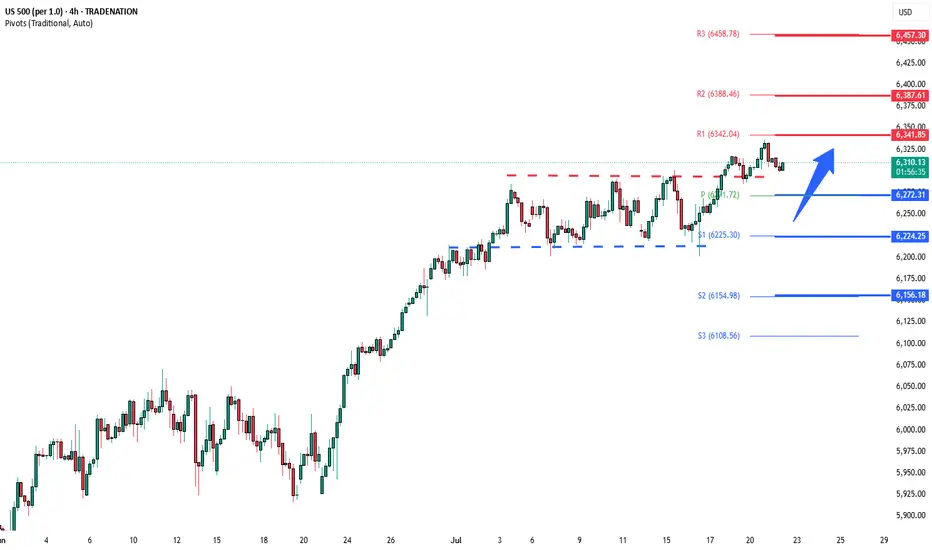
Key Support and Resistance Levels
Resistance Level 1: 6340
Resistance Level 2: 6390
Resistance Level 3: 6457
Support Level 1: 6270
Support Level 2: 6224
Support Level 3: 6156
This communication is for informational purposes only and should not be viewed as any form of recommendation as to a particular course of action or as investment advice. It is not intended as an offer or solicitation for the purchase or sale of any financial instrument or as an official confirmation of any transaction. Opinions, estimates and assumptions expressed herein are made as of the date of this communication and are subject to change without notice. This communication has been prepared based upon information, including market prices, data and other information, believed to be reliable; however, Trade Nation does not warrant its completeness or accuracy. All market prices and market data contained in or attached to this communication are indicative and subject to change without notice.
S&P bearish div on the dailySuspiciously... the market is correcting today before Powell has opened his mouth.
Bearish div on the daily chart above ATH's
Big correction coming?

US stocks hold near record highs on strong 2Q earnings
Despite elevated valuation pressures, US equities remain near all-time highs. While tariff concerns persist, resilient US economic data continues to support the market's upward momentum.
United Airlines reported a 1.7% YoY increase in 2Q revenue, citing easing geopolitical and macroeconomic uncertainties and a double-digit rebound in corporate demand. Meanwhile, earnings and share performance among mega-cap stocks have also been strong.
Netflix (NFLX) beat market expectations with 2Q revenue of $11.08 billion and EPS of $7.19. At the same time, Nvidia (NVDA) reached a fresh all-time high on renewed optimism over a potential resumption of exports to China.
After testing the support at 6285, US500 rebounded and approached its previous high again. The index holds above EMA21, suggesting the continuation of bullish momentum. If US500 remains above both EMA21 and the support at 6285, the index could breach the 6320 high. Conversely, if the US500 breaks below the support at 6285, the index could retreat further toward 6200.

SPX500: Calm Returns, But Bearish Pressure Lingers Below 6283SPX500 OVERVIEW
Markets Calm After Powell Drama
Markets steadied Thursday following Wall Street's volatile reaction to uncertainty over Fed Chair Powell’s future. While President Trump denied plans to fire Powell, he admitted discussing the idea with lawmakers and hinted he'd prefer a resignation. For now, earnings and data are back in focus.
Technical View:
SPX500 is consolidating between 6283 and 6223.
A 1H close above 6283 may trigger a bullish move toward 6341.
Remaining below 6283 keeps bearish momentum intact toward 6223, and a break below that could start a deeper downtrend.
Key Levels:
Support: 6243, 6223, 6195
Resistance: 6305, 6341

SPX 500 TO CONTINUE HIGHER Week of July 20, 2025 SPX500 will continue going higher as we don't have any reversal setup yet on the higher time frames, although there is a lot of hesitation on the chart as the past week's new high was not supported. The trend on 4 hours to weekly is still up and has no break of major moving averages yet. I am looking forward to either a capitulation new high candle or a bullish new high candle that breakout of the weekly consolidation zone as we enter another trading week. I hope my thought process and analysis is helpful for making your own trading or investment decisions.
Thank you for listening and wish everyone a great trading week.
Cheers

SellRejection Level
Daily Volume
Market Structure Shift
London Session
Trend Line Break
Untapped Order Point
Market ViewWatch
Trade
Manage
Smile
Rejection Level
Daily Volume
Market Structure Shift
London US Session
Trend Line Break
Untapped Order Point

SPX500 Eyes Further Upside After Breaking to New HighSPX500 | Technical Overview
The price continued its bullish momentum after stabilizing above the 6283 support level, as anticipated. It has since posted a new all-time high (ATH) and is currently aiming for the next key resistance at 6341. A confirmed breakout above this level may open the path toward 6393.
On the downside, a break and sustained close below 6283 would shift the structure bearish in the short term, potentially targeting 6223.
Pivot line: 6283
Resistance: 6341 – 6393
Support: 6247 – 6223
previous idea:

This is just my Elliott Wave Analysis not financial Advice. $SPThis is just my Elliott Wave Analysis not financial Advice. SP:SPX #SPX SP:SPX
S&P500 (CASh500) Short - double top 15minEntry = 6303.4
SL = 6312.8
Take profit level 1 = 6280.7
Take profit level 2 = 6271.6
S&P500 Accumulation almost over. New rally begins.The S&P500 index (SPX) has been trading within a 3-month Channel Up pattern, within which, it's been replicating almost the same structure. This involves an aggressive Bullish Leg Phase (dotted Channel Up), followed by a correction/ Accumulation Phase (blue Channels), which eventually leads to the new Bullish Leg.
The 1D RSI fractals among those patterns are similar and right now it seems that we are about to complete the latest Accumulation Phase. Having completed a 1D Golden Cross 2 weeks ago, the time-frame looks more bullish than ever and as long as the 1D MA50 (blue trend-line) holds, we expect at least a +5.68% rise (the minimum of the previous Bullish Legs), targeting 6550.
-------------------------------------------------------------------------------
** Please LIKE 👍, FOLLOW ✅, SHARE 🙌 and COMMENT ✍ if you enjoy this idea! Also share your ideas and charts in the comments section below! This is best way to keep it relevant, support us, keep the content here free and allow the idea to reach as many people as possible. **
-------------------------------------------------------------------------------
Disclosure: I am part of Trade Nation's Influencer program and receive a monthly fee for using their TradingView charts in my analysis.
💸💸💸💸💸💸
👇 👇 👇 👇 👇 👇
