Trade ideas

STEEMBTCSee chart. Idea. This is my viewpoint and my opinion. I am not giving advice but only sharing what I see.
Feel free to support my efforts (details on profile). A good action creates good karma, as does good intent. Peace Dill


STEEM seems ready to break above 10000If it does 16000 is the goal according to a few friendly whales
I am not in because i am trapped and i exited @ 8350 a while ago.
I am waiting a hopeful retracement to 7800 that never seems to come.
There are a shitload of dApps being made (without smart contracts) and an exchange will be released soon for those dapps.
They are giving away free tokens everywhere.


Steem very Short termBuy signal at 0.00008490
Sell
Target 1 - 0.00008950
Target 2 - 0.00009000
Target 3 - 0.00009150


READY FOR THE TAKE-OFFEverything on the chart. STEEM has been waiting for a long time but it is time to move up.

Will steem test the 7500 before the next whale pump ?Steem is preparing the next whale pump (It happens about once a week) but first it needs to slowly retrace to the comfort zone.
Do you think if will retrace to 7600 / 7400 levels before moving up again ?
The trend seems to fall into the FIB %
Possible Strategies:
If you hold STEEM: Sell now * 8000 buy back @ 7700 wait for pump sell @ 10500
Look for the volume... Usual volume in binance is about 60 - 70 BTC when it goes above 100 the action began... It can reach up to 300 BTC historically

STEEMBTC [Daily] Looking to buy while 7000 holds...Looking to buy Steem a bit lower, hopefully below 7000 and expecting similar pattern we seen late December.

3rd ride?Last 2 trades with $STEEM using the Ultimate Crypto Trading Strategy script were really good (33%-22%).
Now after breaking from a falling wedge, price seems to be looking for 3rd ride. MACD bullish,RSI bounced hard from oversold levels.Volume spiked.
Target could be 1kSats #STEEM


STEEM REady to test 7600-7400 ?The Volume increased 30% since yesterday and the price got some momentum, but it just looks like a repetition of the action on the 31st of Jan.
Steem can go both ways, the lack of momemtum seems to indicate we will test the mid 7000's

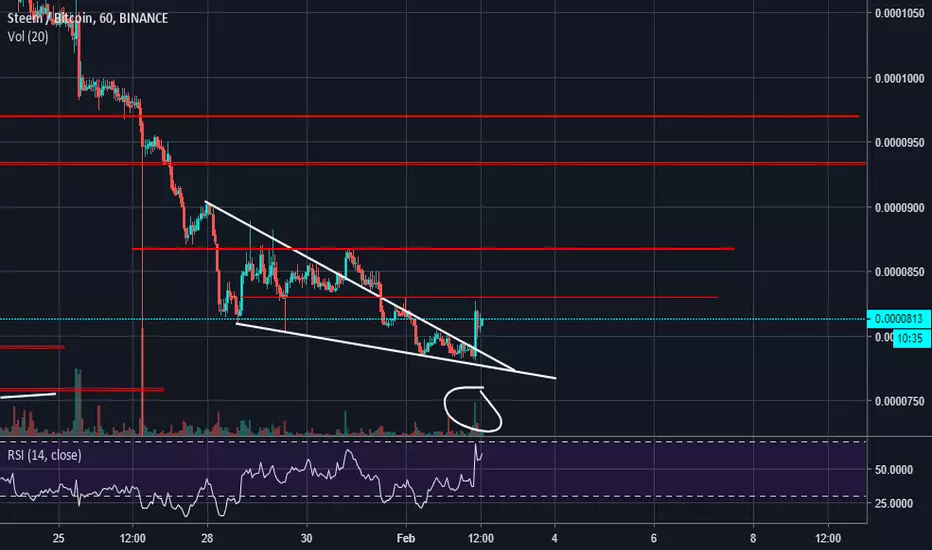
STEEM triangleI am waiting for retest. Low risk.
Red lines are targets and under trend line is stop level
The price action is falling towards the buying zoneIt seem to be that the price action has failed to break the 200MA and now the 1st red appeared on heikin ashi candle.
We have a 100MA support between 0.382 to 0.50 fibonacci retrecement.
The RSI is is overbought and bearish.
I have defined the targets accordingly and insha Allah I am expecting that the price action will follow these directions.
Regards,
Atif Akbar (moon333)


#STEEM STILL GOT STEAM LEFT IN ITBroke over first resistance , will now act as support.
This could still retest the 1085 sats ranges before moving towards further targets.
Stop loss / targets are in chart.
Leave a like if it helps. Follow to get notified for further analysis.
Read other analysis below. ( Over 90 % accuracy so far)

Another target hit but almost donewe've been riding this one for a while now and hit our target. Not too much longer and we will be out of this one and on to the next trade.

STEEM short#STEEM analysis short
Seems like the wedge was broken and then price rallied to a monthly level of 9200 satoshis from December 06th 2017, today it is moving above it after positively testing the weekly level of 10450 satoshis and gaining the level when it make it over the daily level of 11300 satoshis. Now this is the important and more interesting thing to analyzed, should you get started in a position aiming for daily levels of 13400 and then 15200 , will it gain the 17800 monthly level? will STEEM fall back down assuming a monthly support of 9200 satoshis, what do you think?


STEEM - small bull pennant#STEEM - Buy if we break up from the pennant around 1080 sats and close above.
SL - 1036 sats or around 1000 sats if you want to give it more space.
TP1 - 1236
TP2 - 1435

