Potential Upward Movement in STX!Falling Wedge Pattern: This pattern, typically considered bullish, suggests a potential reversal to the upside. The fact that it's forming within an ascending parallel channel reinforces this bullish outlook.
On-Balance Volume (OBV) Divergence: While the price has been making higher highs and lower lows, the OBV is registering higher highs and higher lows. This positive divergence indicates that, despite price fluctuations, buying pressure is increasing, which often precedes a price uptick.
Relative Strength Index (RSI): Currently at 40, the RSI is approaching oversold territory. This suggests that the asset may be undervalued, potentially setting the stage for a price rebound.
Support Levels: The price is currently at the support level of both the parallel channel and the falling wedge pattern. These converging support levels can act as a strong foundation, increasing the likelihood of a price bounce.
Given these factors—the bullish falling wedge within an ascending channel, positive OBV divergence, RSI nearing oversold levels, and the presence of strong support—there's a technical basis to anticipate a potential upward movement in STX's price. However, it's essential to consider broader market conditions and conduct thorough research before making any investment decisions.
Market insights

Stacks New Bearish Impulse: Volume SignalSTXUSDT (Stacks) did move lower in August and activated its December 2023 support range. It seems the bears (down-selling pressure) are not done with this pair.
The main level we have been tracking for the entire Cryptocurrency (Altcoins) market sits around September, October and November 2023, this is the main support for the current corrective period, the potential bottom. It seems Stacks will not be an exception and is ready to move lower, here shown with an orange line on the chart.
The blue line is the Dec. 2023 level. The orange line is for November 2023. Lower prices can be found around September/October 2023 but we are aiming for a higher low.
The signal that is pointing toward this disaster that is about to happen comes from the volume indicator. We can see the biggest volume bar since January 2024 on the daily timeframe, the highest volume in ten months happened yesterday.
When trading volume goes super high, it signals the start of a new move, a new impulse. Since yesterday was a bearish day, we lean towards a new bearish impulse; a lower low.
Thank you for reading.
Namaste.

Stacks | STX The price of Stacks is $0.79 today with a 24hour trading volume of 204 million dollar. This represents a 14% price increase in the last 24 hours and a 11% price increase in the past 7 days
Stacks is a crypto project on a mission to unlock the full potential of the Bitcoin network by bringing smart contracts and dApps to Bitcoin. It's designed as a Layer 1 solution that utilizes Bitcoin as its base layer. The Stacks token powers the performance of smart contracts, transaction processing, and registration of new cryptocurrencies.
as you can see the chart and candles still following the uptrend and are in green zone, the RSI are above average and volume goes up which shows bulls are in control
our today daily candle going to break 50 EMA line which is another bullish sign. bulls next targets are 0.83, 0.85 and 0.89. stop loss at 0.69 and 0.67 levels are necessary as well

STX Consolidation and Potential Rally AheadMarket Overview:
STX has been consolidating within a range established since June, currently testing potential resistance in the October 25th bearish gap ($1.701–$1.768).
Bulls are showing strength in this zone, hinting at the possibility of a rally, especially if traders begin "selling the news" following an upcoming release.
Key Levels to Watch:
Resistance Targets:
First target: Stops above the October 24th swing high at $1.842.
Next resistance: $1.884 (October 20th level).
Further resistance around relatively equal highs at $1.962, $2.000, and $2.074.
Support Levels:
Initial support: $1.652 (last week's candle tail midpoint).
If bearish pressure continues, further support may be tested near $1.560 and $1.530.
Potential profit-taking could occur around September 16th's swing low at $1.470.
Outlook:
A sustained bullish momentum could propel STX towards the upper resistance targets, supporting a continued rally.
Conversely, if bearish sentiment prevails, the price may test lower support levels, indicating a need for caution among traders.
#STX #CryptoMarket #Consolidation #BullishPotential #TechnicalAnalysis

DreamAnalysis | STXUSDT layer-2 blockchain for Bitcoin👋 Welcome back to DreamAnalysis! Today, we're diving into STX (Stacks), a unique layer-2 blockchain for Bitcoin, and analyzing its potential.
🔗 What is Stacks (STX)? Stacks (STX) is a layer-2 blockchain designed specifically to add smart contracts and decentralized applications (DApps) to the Bitcoin network. Smart contracts on Stacks run without altering Bitcoin's core structure, leveraging Bitcoin's security. The STX token is used for transactions and rewarding miners on the Stacks network.
📆 Weekly Analysis of STXUSDT:
In the weekly timeframe, STX shows a more bullish trend compared to many altcoins, which are sitting near their main support levels, while STX remains above these crucial levels.
A rising trendline on the weekly chart indicates that breaking and closing below 1.305 could lead to a decline toward 0.742. If that support breaks, consider temporarily exiting this coin in spot trades.
For re-entry, triggers at 1.987 and 2.444 offer good buying points to hold this Bitcoin layer-2 solution in a bull run. Increasing volume would strengthen this setup. Weekly STX Chart
📉 Daily Analysis of STXUSDT:
In the daily timeframe, STX is consolidating within the 1.65 to 1.987 range, and specific triggers are in place for the next move.
The weekly trendline also remains relevant here, and breaking below 1.65 could result in a drop toward the lower support level within a larger box range.
📊 4-Hour Analysis of STXUSDT: Market sentiment has shifted recently due to geopolitical events, including the Israel-Iran conflict, which has impacted many altcoins, causing widespread selling.
📈 Long Position:
wait for the trendline break and trigger confirmation at 1.82, considering higher timeframe bullishness.
📉 Short Position:
rejection from the trendline and breaking the significant 4-hour support at 1.649 could provide a favorable setup to enter short and follow the downtrend. 4-Hour STX Chart
💬 This wraps up today’s analysis. If you found this helpful, feel free to share it with friends, and drop a comment with any other pairs or coins you’d like us to analyze!
📌 Disclaimer: These analyses are based on chart patterns, not strict rules. Technical analysis is an art, and these insights are not financial advice.


#STX Set for a 133% Surge?In this daily chart of Stacks #STXUSDT, the price is forming a descending channel, a pattern often signaling a potential bullish reversal. Currently trading at $1.428, STX could rally to $3.345, representing a possible gain of 133.74%. With strong resistance levels being tested, this setup is drawing attention for a potential breakout. Are you ready for the ride?
⚠️ All trading ideas are published with a time delay. If you want to follow the trading in real-time, please follow the link:

STX Pumped From the trend lineBINANCE:STXUSDT is still moving in a ascending triangle, In my previous update i was expecting a breakdown of this triangle but fortunately Stx retest the trend line and made multiple Green Candles.
I have marked the Retest of this Trend line It is showing Clearly that after retesting this trend line STX is making a high, If the Bitcoin and Crypto market remain bullish Stx could hit the price may be 2$-2.3$.

STX breaking the trend line off ascending triangle NASDAQ:STX is currently breaking its trend as i mentioned in my previous analysis that ascending triangle is a bearish formation, lets see how down it will go, as per my analysis it will dump to 1.2$ minimum

STX is moving in Ascending triangle.is consolidating in ascending triangle, if the market remain bullish we may see a breakout from this triangle and it can lead the price of #STX to 3$.
But if it breakdown the triangle, it can also get dump 1$-1.2$.

Stacks (STX), LONG opportunity🟢 Here is a LONG opportunity on STX/USDT:
Potential Buy Zones:
1- 1.80 $
2- 1.65 $
3- 1.50 $
Potential Sell Zones:
1- 2.17 $ (20%)
2- 2.39 $ (32%)
3- 3.00 $ (66%)
4- 3.46 $ (93%)
About Stacks (STX):
Stacks (STX) enhances Bitcoin by enabling smart contracts and decentralized applications (DApps) without altering Bitcoin’s core protocol. Using Proof-of-Transfer (PoX), Stacks leverages Bitcoin’s security, enabling scalable and efficient transaction processing. STX tokens are essential for executing smart contracts, processing transactions, and rewarding network participants. The Stacks project is notable for being the first SEC-qualified token offering in the U.S., highlighting its regulatory compliance and potential for wide adoption.
Disclaimer
The information provided here should not be construed as financial advice. Always conduct your own research and consult with a licensed financial advisor before making any investment decisions. The author is not responsible for any losses or gains resulting from investment activities based on the information provided.

STXUSDTThe rising swing trade volumes indicate heightened market activity, while algorithmic analysis signals the potential onset of a bearish trend. This is a short-term swing.

October Picks: Stacks (STX) Gearing Up for new ATHs
📈🔥 October Picks: Stacks (STX) Gearing Up! 💥📊
Kicking off October with a promising setup! Historically a strong month for crypto, and Stacks (STX) is already up by 4% today. The chart reveals an ascending channel, with a rejection at 1.943.
Key Levels to Watch:
Support: 1.789 and 1.735
Breakout Zone: 1.95
Next Target: 2.76 🚀
This month, I’ll be sharing some of my favorite chart setups early on, so stay tuned for more picks coming soon! For more insights on STX, check out my previous analysis .
One Love,
The FXPROFESSOR 💙
Big chart and targets here:

STXUSDT BUY OPPORTUNITYSTXUSDT has formed a giant bullish pole and flag pattern. Within this larger structure, we've identified an internal bullish continuation pattern, also a pole and flag, which has achieved its projected target. We have outlined a strategic buyback area, named the accumulation zone, which should act as a strong demand area for the coin. This setup requires maximum patience, but it promises significant rewards as indicated on the charts.

STXUSDT 1DWait until the price crosses the resistance and you can enter the long trade in the price retest! In the second scenario, there is a possibility that the price will once again return to the bottom of its ascending channel, which is the best place to trade long.

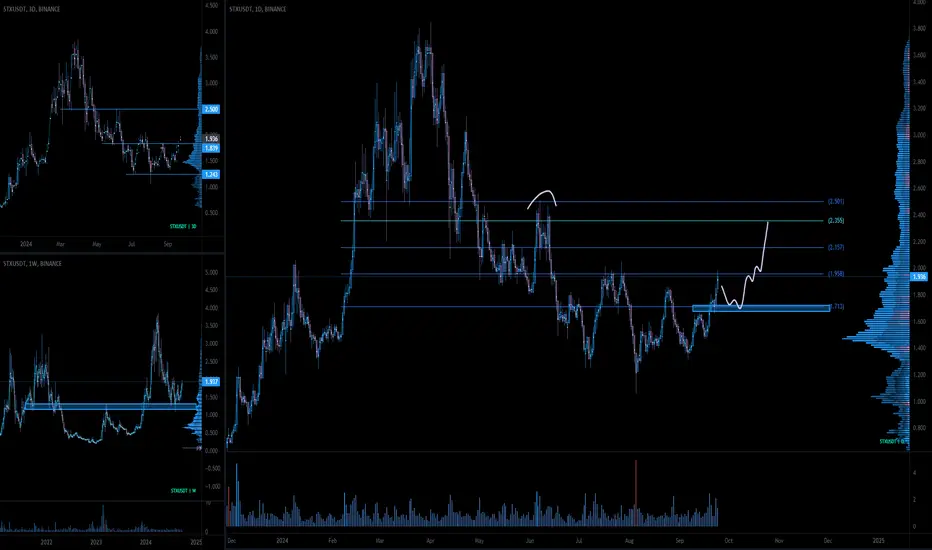
$STX Key levels to watchSTX (Stacks) is breaking out of a 3-month consolidation and is now nearing its horizontal and psychological resistance at $2
A bullish structure is forming, and we have significant upside potential if we can break through the immediate resistance, which has now been tested for the third time.
There's strong support between $1.70 and $1.65. In my view, any dip to this range is a buying opportunity. If this level holds, we could see a move up towards $2.3 to $2.5
Buy Trade Idea for STX (Stacks)Description
Stacks (STX) is a unique cryptocurrency that brings smart contracts and decentralized applications (dApps) to Bitcoin, unlocking new opportunities within the Bitcoin ecosystem. Here are the key fundamentals supporting a potential buy trade for STX:
- **Bitcoin-Powered Smart Contracts:** STX is the first cryptocurrency to enable smart contracts on the Bitcoin blockchain, combining the security and stability of Bitcoin with the versatility of programmable contracts.
- **Growing Ecosystem:** The Stacks network is rapidly expanding, with a variety of decentralized applications being built, especially in areas such as decentralized finance (DeFi) and non-fungible tokens (NFTs).
- **Clarity Language:** Stacks uses the Clarity programming language, designed to be predictable and secure, reducing bugs and vulnerabilities in smart contracts, which is key for long-term growth and adoption.
- **Secure and Transparent:** STX leverages Bitcoin’s proof-of-work security model to anchor its transactions, ensuring high security and transparency for users and developers alike.
Given these strong fundamentals, STX presents an attractive buy opportunity for investors looking to capitalize on the integration of smart contracts and Bitcoin’s robust security framework.
Disclaimer
Trading and investing in cryptocurrencies involves significant risk and can lead to substantial losses. The information provided is for informational purposes only and should not be considered financial advice. Cryptocurrencies are highly volatile, and prices can fluctuate due to various market factors. It is important to conduct your own research, assess your risk tolerance, and consult with a financial advisor before making any investment decisions. Past performance does not guarantee future results.

STX - USDTThe STX/USDT chart shows the price testing a crucial resistance zone (Blue). A successful breakout above the resistance zone (Blue) could trigger a strong bullish wave. Failure to break this level may lead to further consolidation or downward movement.

Head & Shoulders pattern: C-waveChart description
Skewed H&S pattern. Looks confirmed;
Price broke previous local high;
Additional confirmation 50/100 sma cross;
Expecting this to be a C-wave (3rd wave);
Intermediate price targets laid out in chart

STX/USDT100 percent growth within a month or two seems possible. Keeping an eye. Looks boullish over EMA 100.
What do you guys think!??

STXUSDT Triangle BreakoutSTXUSDT technical analysis update
STX is breaking the symmetrical triangle resistance with high volume, and the price is trading above the 100 EMA on the daily chart. This is considered a strong bullish signal for STX.
Buy zone: Below $1.75
Stop loss: $1.55
Regards
Hexa

Stacks – Primed for a Breakout with Strong Bitcoin IntegrationAbout Stacks (STX): Stacks is a unique project that brings smart contracts and decentralized applications (dApps) to Bitcoin without altering Bitcoin’s core. It has a market cap of $2.52 billion and a 24-hour trading volume of $167 million, showing strong market interest.
Impact of Rate Cuts: With the Fed's recent 50 bps rate cut, risk-on assets like STX are expected to thrive as investors seek high-growth opportunities in the crypto space. Stacks, building on the strength of Bitcoin, stands to benefit from this macroeconomic backdrop.
Entry Point: STX is currently trading at $1.69, showing a 12.1% increase in the last 24 hours. Immediate support is at $1.17, and a breakout above $2.76 could set the stage for a strong bullish rally. The primary target is $4.33, while the maximal target in a moonshot scenario reaches $19.
📊 Technical Levels:
Support: $1.17
Primary Target: $4.33
Maximal Extension: $19 (Moonshot Scenario)
The chart is showing STX flirting with a breakout, and the combination of Bitcoin’s stability and smart contract capability could push STX higher.
If you like STX, perhaps it’s time to diversify with AI + Crypto unicorns like CRGPT 🤖🚀.
One Love,
The FXPROFESSOR 💙

$STX squeeze coming upWould like to see BTC hold above $59,500 and close out a daily candle in the green to trickle down the bullishness with correlated Stacks NASDAQ:STX , bullish wave back up a few Fib levels as the end of the current macro squeeze is coming up. Been steady sideways accumulating for the past 5 weeks. Bearish scenario it breaks the wedge and dips down to the Lower Support Zone.
