STXUSDT | Heavy Resistance AheadSTXUSDT is now approaching a critical resistance zone . This red box isn’t just any level — it’s where price has previously stalled or reversed .
I’m watching closely, but I won’t chase into strength blindly. Only if this level breaks with volume and flips to support will I consider a long setup .
“I will not insist on my short idea. If the levels suddenly break upwards and do not give a downward break in the low time frame, I will not evaluate it. If they break upwards with volume and give a retest, I will look long.”
Patience and confirmation are what keep the win rate high. Most traders forget that. I never do.
📌I keep my charts clean and simple because I believe clarity leads to better decisions.
📌My approach is built on years of experience and a solid track record. I don’t claim to know it all but I’m confident in my ability to spot high-probability setups.
📌If you would like to learn how to use the heatmap, cumulative volume delta and volume footprint techniques that I use below to determine very accurate demand regions, you can send me a private message. I help anyone who wants it completely free of charge.
🔑I have a long list of my proven technique below:
🎯 ZENUSDT.P: Patience & Profitability | %230 Reaction from the Sniper Entry
🐶 DOGEUSDT.P: Next Move
🎨 RENDERUSDT.P: Opportunity of the Month
💎 ETHUSDT.P: Where to Retrace
🟢 BNBUSDT.P: Potential Surge
📊 BTC Dominance: Reaction Zone
🌊 WAVESUSDT.P: Demand Zone Potential
🟣 UNIUSDT.P: Long-Term Trade
🔵 XRPUSDT.P: Entry Zones
🔗 LINKUSDT.P: Follow The River
📈 BTCUSDT.P: Two Key Demand Zones
🟩 POLUSDT: Bullish Momentum
🌟 PENDLEUSDT.P: Where Opportunity Meets Precision
🔥 BTCUSDT.P: Liquidation of Highly Leveraged Longs
🌊 SOLUSDT.P: SOL's Dip - Your Opportunity
🐸 1000PEPEUSDT.P: Prime Bounce Zone Unlocked
🚀 ETHUSDT.P: Set to Explode - Don't Miss This Game Changer
🤖 IQUSDT: Smart Plan
⚡️ PONDUSDT: A Trade Not Taken Is Better Than a Losing One
💼 STMXUSDT: 2 Buying Areas
🐢 TURBOUSDT: Buy Zones and Buyer Presence
🌍 ICPUSDT.P: Massive Upside Potential | Check the Trade Update For Seeing Results
🟠 IDEXUSDT: Spot Buy Area | %26 Profit if You Trade with MSB
📌 USUALUSDT: Buyers Are Active + %70 Profit in Total
🌟 FORTHUSDT: Sniper Entry +%26 Reaction
🐳 QKCUSDT: Sniper Entry +%57 Reaction
📊 BTC.D: Retest of Key Area Highly Likely
📊 XNOUSDT %80 Reaction with a Simple Blue Box!
📊 BELUSDT Amazing %120 Reaction!
📊 Simple Red Box, Extraordinary Results
I stopped adding to the list because it's kinda tiring to add 5-10 charts in every move but you can check my profile and see that it goes on..
Market insights

TradeCityPro | STX: Watching Triangle Breakout and RSI Reaction👋 Welcome to TradeCity Pro!
In this analysis, I’m going to review the STX coin, which belongs to the Stacks project—a Layer 2 solution for Bitcoin.
🔍 STX, with a market cap of $1.45 billion, is currently ranked 59 on CoinMarketCap.
🔄 In the previous analysis, I drew an expanding triangle and mentioned that if this triangle breaks to the upside, we can enter a long position or even make a spot purchase.
✨ The trigger for the triangle breakout was at the 0.731 level. After breaking out and pulling back to this level, the price moved up to 1.049 and is now once again in a consolidation phase.
📅 Daily Timeframe
Currently, after RSI got rejected from the 73.58 zone and exited the overbought area, the price has undergone some correction. A pullback to the 0.871 level is possible.
🧩 If a pullback or deeper correction occurs, as long as RSI remains above 50, I still consider the market momentum to be bullish and believe the price can continue moving upward.
📈 If we see a solid bullish candle confirming continuation, we can enter a long position. However, the main long trigger is the breakout of 1.049. The RSI trigger for sharper moves would also be a breakout above 73.58.
📊 The next resistance level is at 1.332. If this level breaks, the coin enters a new price zone, and we’ll need to see whether it can establish support above that area.
🔽 For a bearish scenario, we should wait for the market to form a structure and provide a valid trigger to confirm a short position. At the moment, it’s better to wait for that setup.
🔑 If the market turns bearish, the key support zones to watch are 0.731, 0.571, and 0.453, which could potentially halt further decline.
📝 Final Thoughts
This analysis reflects our opinions and is not financial advice.
Share your thoughts in the comments, and don’t forget to share this analysis with your friends! ❤️

STX ANALYSIS (2D)The STX pair has reached a demand zone.
A price movement fractal seems to be repeating (highlighted by the orange and white boxes).
In the orange boxes, every time STX has dropped more than 72%, it has made a rebound move to the upside.
We are looking for buy/long positions around the demand zone.
The targets for STX are $0.93 - $1.10 - $1.30.
A daily candle close below the invalidation level will invalidate this analysis.
For risk management, please don't forget stop loss and capital management
When we reach the first target, save some profit and then change the stop to entry
Comment if you have any questions
Thank You

STXUSDT Potentially BullishWe saw BTCUSDT gain some momentum and this effect is being seen on many ALT coins. BINANCE:STXUSDT is no different!!! At the moment, STX is breaking out of a consolidation phase on the Daily TF. Will this breakout mean #STXUSDT is regaining its bullish momentum? That remains to be seen, However a close above the 0.78 will likely bring us into the bullish phase.
Until then, fingers crossed.
Do your analysis before taking any trade, results are not typical, past results does not guarantee future results

STXUSDT Potentially BullishBINANCE:STXUSDT is beginning to take shape and is looking good to go long. Broken the consolidation phase and retested it. The bulls are setting in however, we just might see the market slow down around the 1.152 area which turns out slightly below the EMA 200 and also aligns with a resistance point on the weekly TF. On futures trade, I will target this area while i will lock down some profits on my spot trading at this point.
This is not a trade advice as such do your due diligence
Past results does not guarantee future results

STX entry 1.8 to 2.06 through 4.Stacks ($STX) is a layer 2 (or as described by Stacks as a Layer 1.5) smart contract protocol that lives on the Bitcoin blockchain. Via Stacks DeFI and other utility/protocols including City Coins (currently being minted by New York City and Miami and soon Austin and others), while other DeFi platforms built for Bitcoin live on other layer 1's (i.e. Badger on Ethereum), a smart contract protocol on top of the most secure blockchain may or should not only assist in avoiding a "flippenning" but is critical at a time where multi/cross/para chains are the current solutions to avoid bouncing protocol to protocol.
Additionally Stacks was both the first cryptocurrency to be acknowledged by the SEC as a security and also to be no longer recognized as a security by the SEC after successful adoptions. DYOR, Grayscale and partners have significant involvement in Stacks and was instrumental in the SEC approvals. This is pure gut but my gut says Grayscale will be the first BTC ETF approved by the SEC due to familiarity, etc.
Fractals show a similar pattern having already taken place, expect a full push or a pullback and then push to and through $4. Naturally as tied to Bitcoin, BTC volatility could slow or speed up the growth of STX, but smart contracts on the Bitcoin blockchain is powerful and not discussed nearly as much as one would expect.
The stacking opportunities and ecosystem being built around Stacks i.e. City Coins (read NY and Miami Mayoral comments on plans) make this a long term hold for those who want, as blockchain continues to proliferate real world applications beyond just crypto.

Stacks: Psychological Effects Of Trading & Technical AnalysisI was about to call it quits for now but I saw Stacks.
There was a guy here, a few years back. You know these people that are a true pain in the muladhara? That type of guy. He was always going about STXUSDT and as usual, I would give him the entry, the levels, the exit and he would always get it wrong.
Write, write, write, comment, comment; back and forth but never right, always wrong.
Jesus Christ!
Brahman please help!
I have positive impressions on my mind for this pair. That is because some time ago I shared a chart and it did great. This happens. When the prediction goes as planned, it records pleasant memories and each time I go through the pair the sanskaras are activated. It also works the other way. When a trade goes wrong, when I see the pair I tend to feel, "Yuck!"
Each time, good or bad, I have to overcome my mental attachments to be able to look a the pair fresh, with a new perspective, new!
If you get attached to the positive outcome, you are likely to jump in before the time is right.
If you get attached to the negative outcome, you are likely to miss it the next time prices are about to rise.
Both these need to be avoided if you are looking at charts or doing your own numbers. Detach completely and look at it fresh.
Today it is a new day. Whatever happened in the past, good or bad, has nothing to do with this present moment.
I am looking at Stacks, STXUSDT, what does the chart have to say?
A long-term support zone, mid-2023, has been activated.
All the action in 2024 has been removed. We are back to baseline, back to baseline is good for the bulls.
This pair allows buying at support in expectation of long-term growth.
Namaste.

STX Downtrend Breakout + 2x Bull RSI Divergences (1D)BINANCE:STXUSDT broke out of its downtrend after printing two Bull RSI Divergences in a row, and retesting a demand zone dating back to 2019.
Key Levels to Watch
• $0.45: Main Demand Zone, relevant since 2019. A break below it would invalidate the setup.
• $1.20: Arguably the most important S/R throughout STX's history, in place since March 2021 and potentially a strong resistance, also currently reinforced by the 200-day EMA. If reclaimed, it would most likely shift the bias to bullish.
• $2.70-$3.00: Main Supply Zone to overcome for new ATHs, dating back to April 2021.
Definitely worth taking a look at the chart on the monthly timeframe as well, to grasp the full significance of these levels.
All things considered, this seems a high-conviction trade, with a clean invalidation and a very good R/R.

STXUSDT is showing bullish divergence in 1d Time frame STXUSDT is showing bullish divergence in 1d Time frame and also broke LH

STXUSDT - LongLong entry at 0,533 USDT with a stop loss at 0,386 USDT.
Profit taking: 1,236 USDT, 1,78 USDT and 2,472 USDT.

TradeCityPro | STX: Watching for a Breakout in Bitcoin’s L2 Star👋 Welcome to TradeCity Pro!
In this analysis, I want to review the STX coin for you. This coin is one of Bitcoin’s layer-2 projects and, with a market cap of $933 million, ranks 67th on CoinMarketCap.
📅 Daily Time Frame
In the daily time frame, as you can see, this coin has been in a downtrend. Its most recent upward move began after breaking 1.332, and then it dropped within an expanding triangle structure down to the 0.533 area.
🔍 Currently, the main price support is at 0.453, which the price hasn't reached yet, but the 0.533 area is also strong and could mark the end of the downtrend.
✨ If the price bounces from the 0.533 area and starts moving upward, the likelihood of the triangle breaking to the upside increases. Since the price hasn’t reached the triangle’s bottom and could form a higher low, bullish momentum may enter.
📊 Market volume during the last bearish leg was decreasing, and now with supportive candles forming, volume is increasing—which, if it continues, also increases the likelihood of the triangle breaking.
🛒 If this happens, the buy trigger in spot is at 0.731, which, besides being suitable for a spot entry, can also provide a good futures position in lower time frames.
✔️ The RSI oscillator is also near the 50 level, and if it breaks above that and moves up, the price can head toward higher targets.
📉 On the other hand, for short positions, the 0.533 support is very important, and breaking it could justify opening a short. But note that this area is very close to 0.453, so if you're opening a short, be aware it's very risky and the price could reverse at any moment.
❌ If you already hold this coin and are looking for a good stop-loss level, a break and confirmation below 0.453 is appropriate. However, keep in mind that if your stop-loss is triggered and the price moves back above the support area, you should find a new trigger and buy again so you don’t miss the move.
📝 Final Thoughts
This analysis reflects our opinions and is not financial advice.
Share your thoughts in the comments, and don’t forget to share this analysis with your friends! ❤️

STX Bulls Beware: Is This the Calm Before a Massive Drop?Yello, Paradisers! Are you seeing what we’re seeing on STXUSDT? If not, now’s the time to pay attention—our recent predictions on bearish setups are starting to unfold again, and this one might catch many off guard. Let’s break it down.
💎Currently, STXUSDT is flashing some serious warning signs. We’re spotting a clear bearish Change of Character (CHoCH) in play, which is being reinforced by a Head and Shoulders pattern—a combination that significantly increases the probability of a downside move.
💎To make things worse for the bulls, there’s an unfilled Fair Value Gap (FVG) sitting just below the current price. This acts like a magnet and could drag the price downward as liquidity gets targeted.
💎However, if STXUSDT manages to bounce from current levels, we’ll be closely watching the Order Block (OB) and Fibonacci Golden Zone as potential entry points. These could offer an excellent risk-to-reward (RR) setup if the bearish scenario gets temporarily rejected.
💎But here’s the key invalidation point: if price breaks and closes above the OB zone, the entire bearish thesis falls apart. In that case, we’ll step aside and wait for stronger confirmation before jumping back in. No need to rush—better opportunities always come with clear setups.
🎖Trade smart, Paradisers. The market doesn't care about your bias—it rewards only patience, precision, and discipline. Stick to your trading plan, and don’t let FOMO or fear drive your decisions.
MyCryptoParadise
iFeel the success🌴

#STX/USDT#STX
The price is moving within a descending channel on the 1-hour frame, adhering well to it, and is heading for a strong breakout and retest.
We are experiencing a rebound from the lower boundary of the descending channel, which is support at 0.600.
We are experiencing a downtrend on the RSI indicator, which is about to break and retest, supporting the upward trend.
We are looking for stability above the 100 moving average.
Entry price: 0.670
First target: 0.691
Second target: 0.714
Third target: 0.739

STX Breaking | BTC | ETH | XRPSTX breaking local resistance and closed 4hr candle above it
if Price holding here would see a run to 4hr 200MA and then Next target around .830
will buy if its retrace to 15min 50ma


STXUSDT 1WSTX ~ 1W Analysis
#STX Buy gradually from here if you still have a Conviction on this coin with a short -term target of at least 20%+.

Time to buy? STXUSDT
You can see the support line is broken down last week. Now, it's trading around 0.62x, do you think can buy this time, this price?
I think not yet. I expect BINANCE:STXUSDT hit the first all time high zone 0.4-0.5
So wait and see

[LONG] STX - STACKS on support and ready for a bounceSTX is another beaten up coin that this year alone lost more than 60% of it's already beaten up marketcap. From the peak on April of 2024 to January of this year STX was already down 50%. Bulls got completely obliterated, but not everything is lost for STACKS: Sitting at $0.75 is now testing (and holding) for second time the previous 2023 resistance, now turned support. A bounce here doesn't immediately mean the end of the fall, but we can catch a good counter-trend move to retest the distribution zone on the $1.44 to $2.00 range
1st Entry: $0.75 (previous resistance, now support)
2nd Entry: $0.65 (most traded zone)
move SL to Break even if price breaks the previous high at $1.00
1st TP: $1.34
2nd TP: around $1.80 or look for signs of weakness in lower timeframes at this area

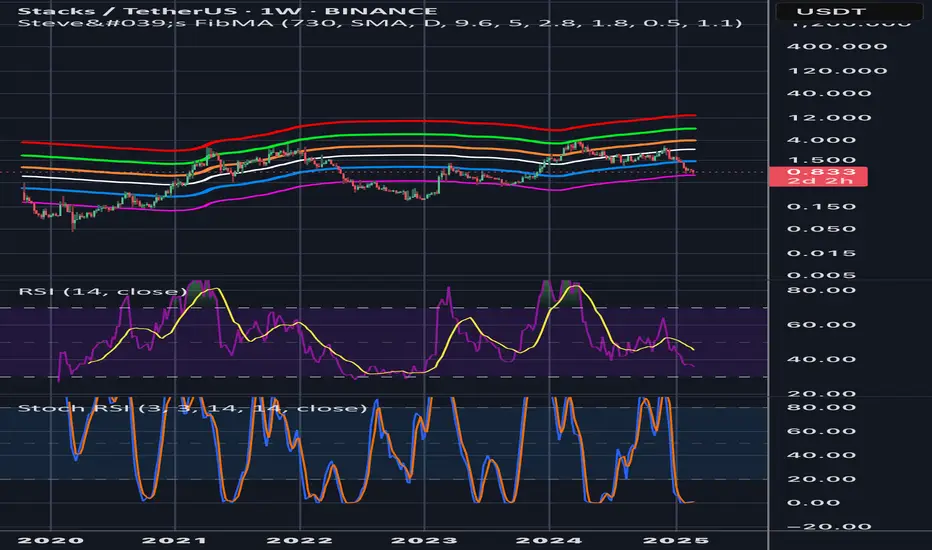
Bullish on STX: Massive Support Just Hit – $15 Is Actually PossiStacks (STX) is flashing strong bullish signals, and the charts are aligning for a major move to the upside. Here’s why $15 isn’t just a dream—it’s a real possibility.
1. Strong Support at Key Levels
STX has just bounced off a critical support zone, aligning with the pink and blue moving averages, which have historically acted as reversal points. This suggests a potential bottom formation and a springboard for the next leg up.
2. Fibonacci Bands Indicate a Huge Upside
The price is sitting below the white mid-band, a level that has consistently preceded major breakouts. With the next Fibonacci resistance around $3-$4, once that is cleared, momentum could push STX toward its previous highs and beyond.
3. RSI & Stochastic RSI Reset for a Surge
• RSI (Relative Strength Index) has cooled off to neutral territory, meaning there’s room for upward movement.
• Stochastic RSI is approaching oversold levels, a classic signal that price is ready to rebound hard.
4. Historical Price Action Suggests a Parabolic Move
Looking at past cycles, STX has surged 10x+ after bouncing from these levels. If this pattern holds, a move toward $10-$15 is entirely feasible in the next few months.
Final Thoughts
STX has all the ingredients for a massive rally: strong technical support, bullish momentum indicators, and historical price action that favors explosive moves. If Bitcoin and the overall market remain strong, we could see STX skyrocket toward double-digit territory sooner than expected!
Key Levels to Watch:
• Support: $0.80 - $1.00
• Breakout Zone: $3 - $4
• Ultimate Target: $15 🚀
Do you think STX can hit $15? Let me know in the comments!
STXUSDT UPDATESTXUSDT is a cryptocurrency trading at $0.900. Its target price is $1.600, indicating a potential 90%+ gain. The pattern is a Bullish Falling Wedge, a reversal pattern signaling a trend change. This pattern suggests the downward trend may be ending. A breakout from the wedge could lead to a strong upward move. The Bullish Falling Wedge is a positive signal, indicating a potential price surge. Investors are optimistic about STXUSDT's future performance. The current price may be a buying opportunity. Reaching the target price would result in significant returns. STXUSDT is poised for a potential breakout and substantial gains.

Will STXUSDT recover from a failed fifth Elliott wave?
We start our Elliott wave count at the bear market lows (Nov 2022). The first wave tops in March 2023 starting the second wave that bottoms at the 0.618 Fib (typical second wave). The third wave tops along with most of the crypto market in end of March or early April 2024. Then the fourth wave corrects more than expected barely holding the 0.382 Fib, the first wave high and the pitchfork median line support. The fifth wave starts in August 2024 and tops in December 2024, below the third wave high and rejecting from a pitchfork resistance. From here STX tumbled down.
STX recently found support at the outer line of a macro modified Schiff pitchfork. We can see that the price action interacted with the median line of this pitchfork throughout the bull run. If we are to hit that median line again, we get a pretty ambitious target at around 5$ by the end of July 2025.
Below I examine other pitchforks for more realistic price targets.
Looking at the same pitchfork on linear scale we again see price action interacting with median, 0.5 and outer lines of the pitchfork. This chart gives us a target price of around 1.9 by the end of July 2025.
Changing the pitchfork type to Schiff and looking at the log chart again shows price action interacting with median and 0.5 lines of the pitchfork. This chart gives us a target price of around 2.44 by the end of July 2025.
Some smaller pitchforks on the log chart provide us with additional resistance levels to keep in mind.
Similarly on the linear chart. Here we also see a pitchfork median line that served as support.
In recent price action we can see bullish divergence in RSI and SRSI. In addition, at the daily close, one should watch for bullish crosses in RSI and SRSI.
Will this be the turning point for STX? Time will tell.

Univers Of Signals | STXUSDT Reached Weekly SupportLet's go together to analyze and review one of the popular cryptocurrency coins and Bitcoin's second layer and update our triggers
🌐 Overview Bitcoin
Before starting the analysis, I want to remind you again that we moved the Bitcoin analysis section from the analysis section to a separate analysis at your request, so that we can discuss the status of Bitcoin in more detail every day and analyze its charts and dominances together.
This is the general analysis of Bitcoin dominance, which we promised you in the analysis to analyze separately and analyze it for you in longer time frames.
📊 Weekly Timeframe
On the weekly time frame, stx is one of the coins that started its upward trend before the start of 2024, which caused the formation of its ATH and new ceiling
You can also see one of the best weekly trends in this coin, which is that after each time we hit this support trend line, we rose and made a sharper move.
Also, when this trend line was broken, we made a pullback to it and as we had given the weekly exit trigger with a break of 1.299 in the previous analysis, after the break of the trigger of the trend line, we experienced a sharp decline and reached the support level of 0.796 and now we need to form a structure.
📈 Daily Timeframe
On the daily time frame, but after the rejection of the important weekly resistance 2.745 and getting rejected, we started to correct the price and fall until this price correction turned into a trend change in the daily time frame
After forming the lower ceilings and floors, we reached important support and the trigger for the spot exit, which after the daily failure and pullback to that daily candle, engulfed the previous 3 candles and caused further decline, which led to us reaching the important support of 0.859
Currently, after hitting the support of 0.859 twice, our fall volume has not increased much and it can be said that the sellers do not intend to take the price below 0.859 for the time being, and this will cause us to go into the range and form a new structure. However, I will open a short with a failure of 0.859, but there is no buying at the moment.
⏱ 4-Hour Timeframe
We suffered enough in the four-hour time frame and formed a structure and we are in a range box that we can take a position from both sides
📉 Short Position Trigger
For my short position I open a position with a break of 0.859 and accept the stop loss. Since it is an important support, I try to place my stop loss in a logical space and not make it small.
📈 Long Position Trigger
For the long position, we have two triggers, one risky and one somewhat certain. You can open a position with a break of 0.953 and 1.005, respectively. The difference is that with a break of 0.953, the possibility of a stop loss is higher, and with a break of 1.005, the possibility of losing the position is higher. I choose to take the stop loss myself.
📝 Final Thoughts
Stay calm, trade wisely, and let's capture the market's best opportunities!
This analysis reflects our opinions and is not financial advice.
Share your thoughts in the comments, and don’t forget to share this analysis with your friends!

TradeCityPro | STXUSDT Reached Weekly Support👋 Welcome to TradeCityPro Channel!
Let's go together to analyze and review one of the popular cryptocurrency coins and Bitcoin's second layer and update our triggers
🌐 Overview Bitcoin
Before starting the analysis, I want to remind you again that we moved the Bitcoin analysis section from the analysis section to a separate analysis at your request, so that we can discuss the status of Bitcoin in more detail every day and analyze its charts and dominances together.
This is the general analysis of Bitcoin dominance, which we promised you in the analysis to analyze separately and analyze it for you in longer time frames.
📊 Weekly Timeframe
On the weekly time frame, stx is one of the coins that started its upward trend before the start of 2024, which caused the formation of its ATH and new ceiling
You can also see one of the best weekly trends in this coin, which is that after each time we hit this support trend line, we rose and made a sharper move.
Also, when this trend line was broken, we made a pullback to it and as we had given the weekly exit trigger with a break of 1.299 in the previous analysis, after the break of the trigger of the trend line, we experienced a sharp decline and reached the support level of 0.796 and now we need to form a structure.
📈 Daily Timeframe
On the daily time frame, but after the rejection of the important weekly resistance 2.745 and getting rejected, we started to correct the price and fall until this price correction turned into a trend change in the daily time frame
After forming the lower ceilings and floors, we reached important support and the trigger for the spot exit, which after the daily failure and pullback to that daily candle, engulfed the previous 3 candles and caused further decline, which led to us reaching the important support of 0.859
Currently, after hitting the support of 0.859 twice, our fall volume has not increased much and it can be said that the sellers do not intend to take the price below 0.859 for the time being, and this will cause us to go into the range and form a new structure. However, I will open a short with a failure of 0.859, but there is no buying at the moment.
⏱ 4-Hour Timeframe
We suffered enough in the four-hour time frame and formed a structure and we are in a range box that we can take a position from both sides
📉 Short Position Trigger
For my short position I open a position with a break of 0.859 and accept the stop loss. Since it is an important support, I try to place my stop loss in a logical space and not make it small.
📈 Long Position Trigger
For the long position, we have two triggers, one risky and one somewhat certain. You can open a position with a break of 0.953 and 1.005, respectively. The difference is that with a break of 0.953, the possibility of a stop loss is higher, and with a break of 1.005, the possibility of losing the position is higher. I choose to take the stop loss myself.
📝 Final Thoughts
Stay calm, trade wisely, and let's capture the market's best opportunities!
This analysis reflects our opinions and is not financial advice.
Share your thoughts in the comments, and don’t forget to share this analysis with your friends!
