SUI/USD – Heating Up AgainSUI printed a strong V-recovery from $3.24, pushing into the $3.46–$3.50 zone which aligns with the 200 SMA. RSI has exploded to 66+, indicating strong bullish intent. This looks like the beginning of a trend reversal, but to confirm, bulls need to push and hold above $3.50 for continuation toward $
Trading activity
Transactions 137
BuysSells
8750
Volume 224USD
Buys volumeSells volume
13787
Traders 105
BuyersSellers
6243
About SUIAUSD_B8A669.USD
Related DEX pairs
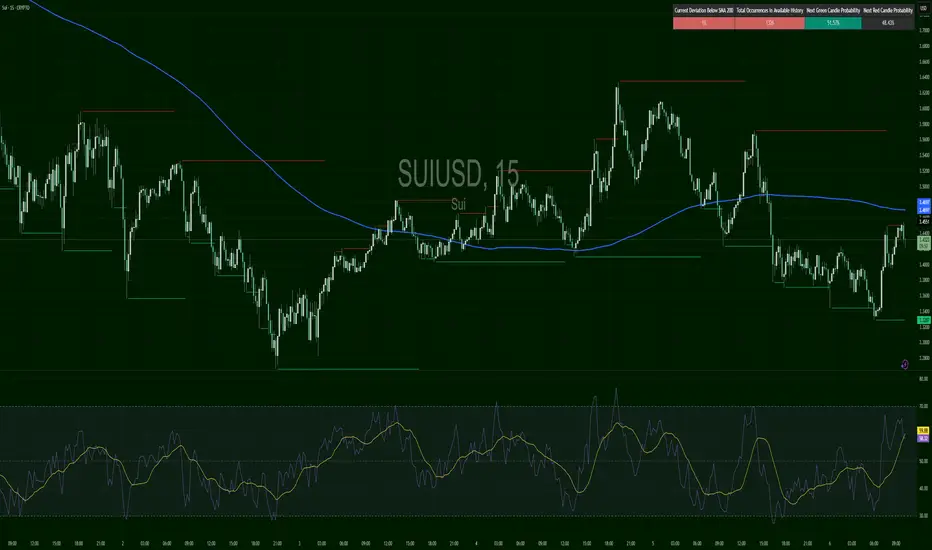
SUIUSD – Snapped Trend, Needs FuelSUI launched off $3.62 support, breaking trendline and 200 SMA around $3.81, reaching $3.95. RSI got hot (~63) and now turning. It’s pausing under resistance, forming a potential flag. $3.89 is key support to hold for next push. Below that risks retracing deeper.

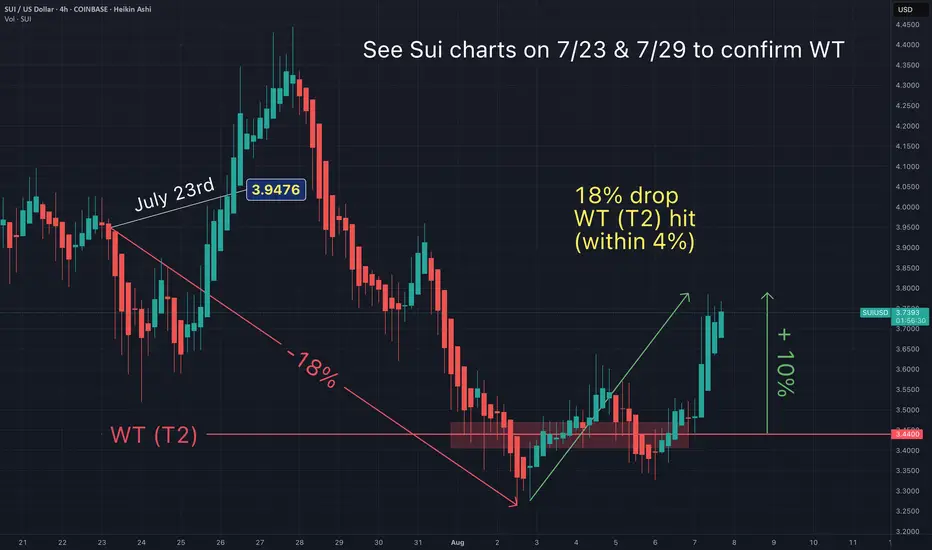
Sui - Target 2 just hit (alternate view)I love it when a plan comes together.
I hope my T3 doesn't hit (after this next bounce).
May the trends be with you.
You will ask yourself "how did he know Sui would do that"?Here's a simplified summary of my prediction made on 7/23 & 7/29 for my ideal entry.
Feel free to review my Sui charts on those days to confirm.
I keep stats on my accuracy and so should you.
How else would you know what influencer to actually follow?
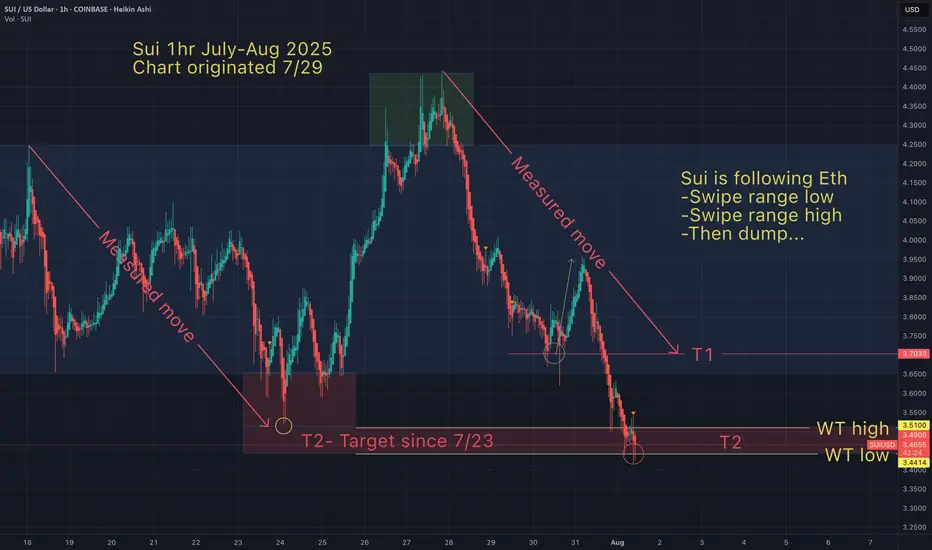
Sui - My T2 target just hit As anticipated, target 2 (T2) was hit right on time (as indicated by red arrow set a few days ago)
Sui dumped after taking the liquidity above the high and I
assumed it would swipe the lows as well...before any chance
of a meaningful move towards the upside.
I hope, Sui doesn't hit my bearish T3

SUI new trend started!SUI / USDT
Price broke out after long accumulation range with good volume
Looks like a new bullish trend has started

Sui bounce off my T2 now confirmed. Heading lower to my T3?On Aug 1st I wrote:
"I hope my T3 doesn't hit (after this next bounce)."
Now that the bounce off my T2 has been confirmed, I've become cautious.
I hope I'm wrong about Sui (and alts) going lower, for the bulls sake.
Sui may bottom when Eth does around $2950 (see my Eth "Descent" chart)
May the

Can SUI end the year at over $10?Sounds wild sitting here in August.
But those are the type pf moves possible on a new cycle blockchain entering the last parabolic run of the 4 year cycle.
Now we are still unsure when this cycle will end?
Q4 of 2025 or does extend April/May of 2026.
Either way SUI has potential of compressed p

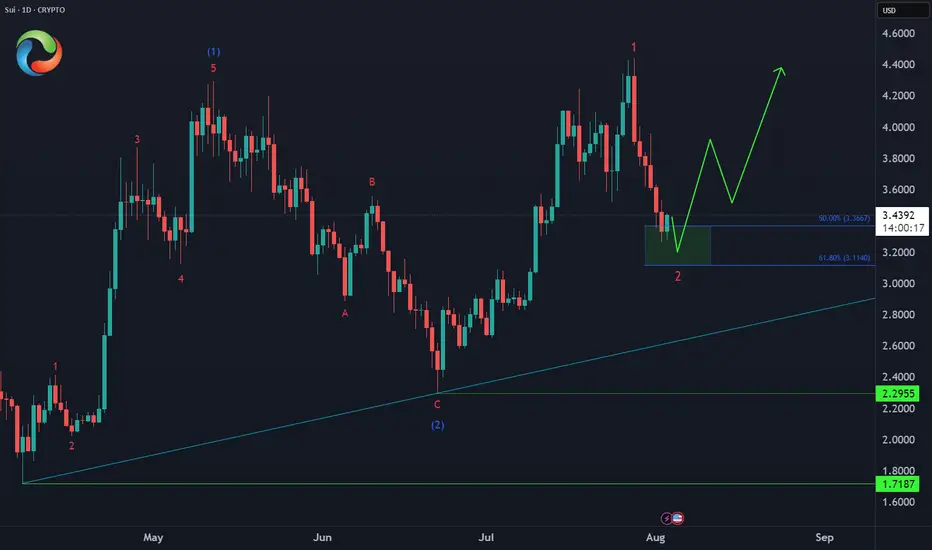
SUI Bullish Setup Ahead🚀 After breaking above its May peak, CRYPTO:SUIUSD has confirmed a higher high sequence, signaling bullish momentum. The current price action suggests it's now working on a higher low, likely forming around the 50%–61.8% Fibonacci retracement zone between $3.36 and $3.11 before resuming its rally.
#SUI/USDT 4H: Broke out of a falling wedge with bullish momentum#SUI/USDT 4H: Broke out of a falling wedge with bullish momentum, now holding an ascending trendline. Watch for a retest around $3.40–$3.20. Holding above this zone targets $4.00 and $4.80. A break below $3.00 invalidates the setup.

See all ideas
Summarizing what the indicators are suggesting.
Oscillators
Neutral
SellBuy
Strong sellStrong buy
Strong sellSellNeutralBuyStrong buy
Oscillators
Neutral
SellBuy
Strong sellStrong buy
Strong sellSellNeutralBuyStrong buy
Summary
Neutral
SellBuy
Strong sellStrong buy
Strong sellSellNeutralBuyStrong buy
Summary
Neutral
SellBuy
Strong sellStrong buy
Strong sellSellNeutralBuyStrong buy
Summary
Neutral
SellBuy
Strong sellStrong buy
Strong sellSellNeutralBuyStrong buy
Moving Averages
Neutral
SellBuy
Strong sellStrong buy
Strong sellSellNeutralBuyStrong buy
Moving Averages
Neutral
SellBuy
Strong sellStrong buy
Strong sellSellNeutralBuyStrong buy