Trade setup for SUI 20 R:R. Now or never!!!BTC and ETH are already showing signs of reversal. Do you believe a bull run is coming? This might be a good setup before the market takes off. Risk-to-reward ratio of 20:1 — extremely risky but potentially very rewarding. Only two resistance levels left before reaching the all-time high (ATH).
Ent
Key stats
Trading activity
Transactions 577
BuysSells
394183
Volume 53.95 KUSD
Buys volumeSells volume
35.74 K18.21 K
Traders 123
BuyersSellers
10023
About SUIUSDC_CF9946.USD
Related DEX pairs

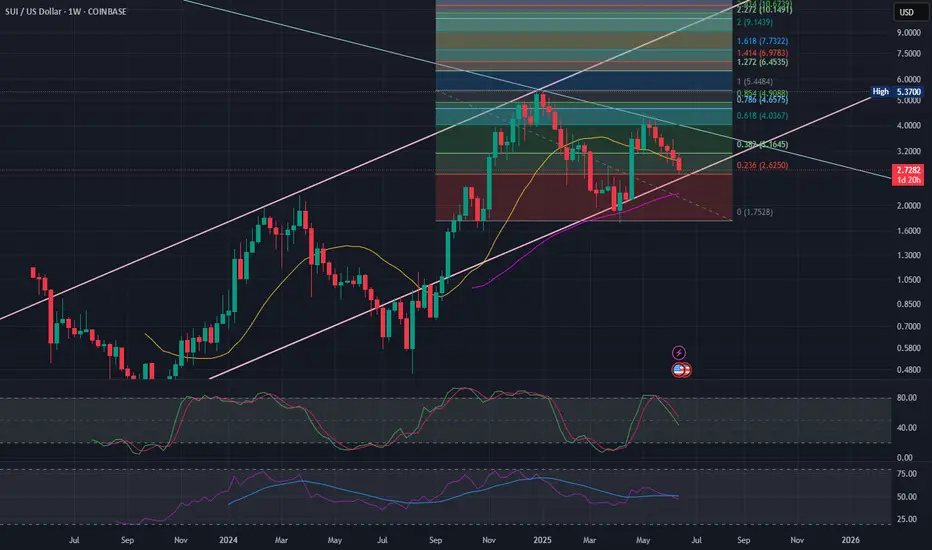
SUI Wave 3 of 3 Started?SUI appears to have completed a local wave (2) at the .618 Fibonacci retracement and a larger degree wave 2 at the alt-coin golden pocket between .618-.782
Triple resistance looms ahead of the daily 200EMA, major resistance High Volume Node and descending resistance trend line.
A breakthrough and

SUI: Closing in on the Target Zone?SUI should continue closing in on our blue Target Zone between $2.27 and $1.72. We expect blue wave (ii) to complete there, ideally above support at $2.02, before the next move higher kicks off in wave (iii). However, because the June 22 low came within just $0.03 of our zone, we must consider the p

SUI Swing Trade Setup Targeting 2R Risk-RewardSUI Likely to Close Daily Above $4.12 — Setting Up for Next Leg Toward All-Time High of $5.40
SUI is showing strong momentum and is likely to close the daily candle above $4.12, potentially setting up for the next leg up toward its all-time high at $5.40.
This swing trade setup offers a 2:1 risk-t

SUI Wave 2 Complete?CRYPTOCAP:SUI appears to have completed a wave 2 pullback at the 'alt-coin' golden pocket Fibonacci retracement 0.786.
Price tested the S2 daily pivot as support, which adds confluence to the .786 Fib. A bullish engulfing candle followed, negating the previous 3 days price action but price still h

SUI/USD Weekly Analysis: Price Trend Through TrendlineSUI/USD Weekly Analysis: Price Trend Through Trendline, Fibonacci, and Market Behavior
This article analyzes the price behavior of the SUI token against the US Dollar (USD) on a weekly chart using key technical tools such as trendlines, Fibonacci retracement/extension, moving averages (EMA), and mo
SUIUSD – Broken Wedge, Not Yet Broken OutSUI printed a breakout wick above $2.87, then retraced hard through support and consolidated in a falling wedge near $2.68. A minor breakout from that wedge has begun, with early signs of strength as price climbs into $2.74. Bulls need a break of $2.78–$2.80 to confirm trend reversal. For now, it's

SUIUSDTCryptocurrency Futures Market Disclaimer 🚨🚨🚨
Trading cryptocurrency futures involves high risks and is not suitable for all investors.
Cryptocurrency prices are highly volatile, which can lead to significant gains or losses in a short period.
Before engaging in crypto futures trading, consider you

SUI long 34% short 88%I think we need to see these moves first before we will have the extreme big wave to the upside. Just opened a long position. Then looking to short

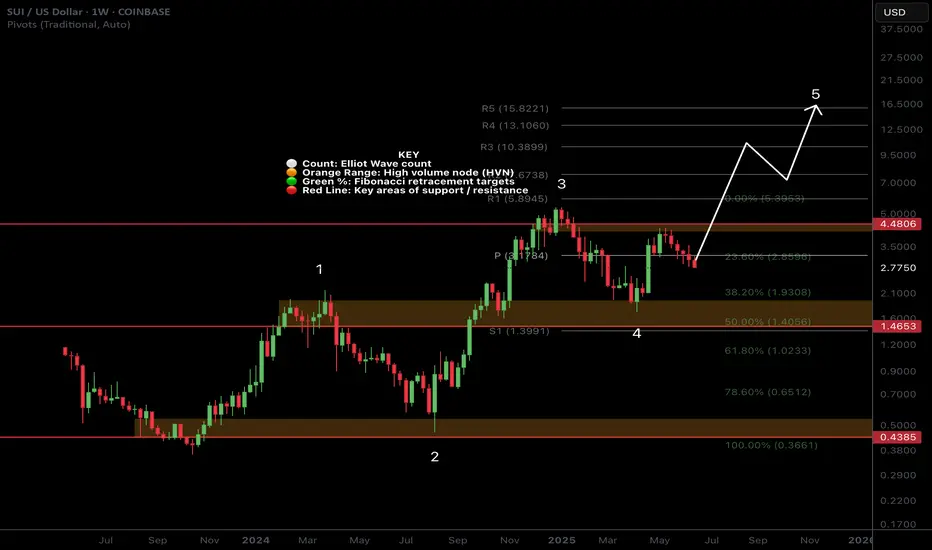
SUI Macro AnalysisCRYPTOCAP:SUI macro analysis update...
📈 𝙇𝙤𝙣𝙜 𝙩𝙚𝙧𝙢 outlook shows price action still outperforming most alts with a great rally recently. Target remains the R5 weekly pivot at $15
📉 𝙎𝙝𝙤𝙧𝙩 𝙩𝙚𝙧𝙢 outlook has price pulling back, looking to find a bottom between $2.3-2.65
War escalation's and retail s
See all ideas
Summarizing what the indicators are suggesting.
Oscillators
Neutral
SellBuy
Strong sellStrong buy
Strong sellSellNeutralBuyStrong buy
Oscillators
Neutral
SellBuy
Strong sellStrong buy
Strong sellSellNeutralBuyStrong buy
Summary
Neutral
SellBuy
Strong sellStrong buy
Strong sellSellNeutralBuyStrong buy
Summary
Neutral
SellBuy
Strong sellStrong buy
Strong sellSellNeutralBuyStrong buy
Summary
Neutral
SellBuy
Strong sellStrong buy
Strong sellSellNeutralBuyStrong buy
Moving Averages
Neutral
SellBuy
Strong sellStrong buy
Strong sellSellNeutralBuyStrong buy
Moving Averages
Neutral
SellBuy
Strong sellStrong buy
Strong sellSellNeutralBuyStrong buy