Sui Update · Clearly Moving Towards $7.62, $11.3 & $15The SUIUSDT chart looks great and just today we are witnessing a bullish continuation. Resistance was found 11-July but the market didn't produce any significant retrace. This is obviously because we are ultra-bullish and ultra-bullish can only mean sustained growth.
After the 11-July resistance, o

Is SUI ready to surge 13% toward $3.95 target?Hello✌
let’s dive into a full analysis of the upcoming price potential for SUI 📈.
BINANCE:SUIUSDT has broken out of its descending channel with notable volume, indicating a potential shift in momentum. Price action is currently holding near a key support area, which could act as a solid base fo

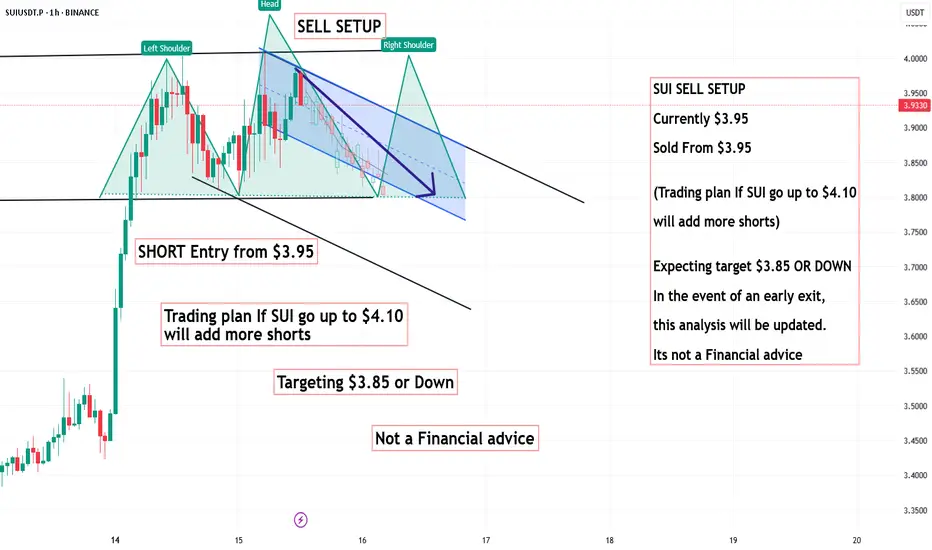
SUI SELL SETUP , Sold From $3.95SUI SELL SETUP
Currently $3.95
Sold From $3.95
(Trading plan If SUI go up to $4.10
will add more shorts)
Expecting target $3.85 OR DOWN
In the event of an early exit,
this analysis will be updated.
Its not a Financial advice
SUI - Daily Chart PerpectiveThis chart is in expansion to our previous post:
What we can see is SUI has clearly broken out of its symmetrical triangle (yellow trendlines). This is the first good sign for potential new highs for SUI.
However since the 4H chart could be spelling out a short term drop lets see where price cou

SUIUSDT Long IdeaDescending trendline of lower highs has been breached
Should expect rejection at $4 area and a slight pullback to 0.382 fib level around $3.35
Resistance at $4 area should be closely monitored and if breached, wait for retest and confirmation in order to set up long position.

SUI - SUI SUI in your ears!Hellooo so SUII moves are marked till the blue line - as stated but beyond it if it goes just in case, you know the path

Lingrid | SUIUSDT Pullback and New Higher High PotentialBINANCE:SUIUSDT has rebounded strongly from the support level at $3.60, continuing its bullish sequence of higher highs and higher lows. The price broke out of the consolidation zone and climbed above the blue upward trendline, confirming a continuation of the bullish trend. A retest of the breakou


$SUI/USDT Technical Analysis
Major Bounce from FIBO ZONE 📈
SUI has just bounced off the golden Fibonacci retracement zone (0.618–0.786), confirming it as strong dynamic support. This move comes after a healthy correction from previous highs.
📍 Current Price: $3.0816
🎯 Target 1: $4.8865
🎯 Target 2: $7.4445
🛡 Invalidation L

SUIUSDT Breaks Out of Triangle – Eyes on $10BINANCE:SUIUSDT daily chart has confirmed a breakout above a symmetric triangle resistance line within a larger ascending channel, signaling strong bullish momentum. Price has reclaimed the 100 and 200 EMAs, and the breakout is backed by rising volume. This setup opens the door for a potential rall

See all ideas
Summarizing what the indicators are suggesting.
Oscillators
Neutral
SellBuy
Strong sellStrong buy
Strong sellSellNeutralBuyStrong buy
Oscillators
Neutral
SellBuy
Strong sellStrong buy
Strong sellSellNeutralBuyStrong buy
Summary
Neutral
SellBuy
Strong sellStrong buy
Strong sellSellNeutralBuyStrong buy
Summary
Neutral
SellBuy
Strong sellStrong buy
Strong sellSellNeutralBuyStrong buy
Summary
Neutral
SellBuy
Strong sellStrong buy
Strong sellSellNeutralBuyStrong buy
Moving Averages
Neutral
SellBuy
Strong sellStrong buy
Strong sellSellNeutralBuyStrong buy
Moving Averages
Neutral
SellBuy
Strong sellStrong buy
Strong sellSellNeutralBuyStrong buy
Displays a symbol's price movements over previous years to identify recurring trends.