Haven't been monitoring, just glanced.. Party is over now.Its time to get out of your SUI long folks. You'd have to be insane to stay in it after 5-6am this morning.
SUIUSDT.P trade ideas

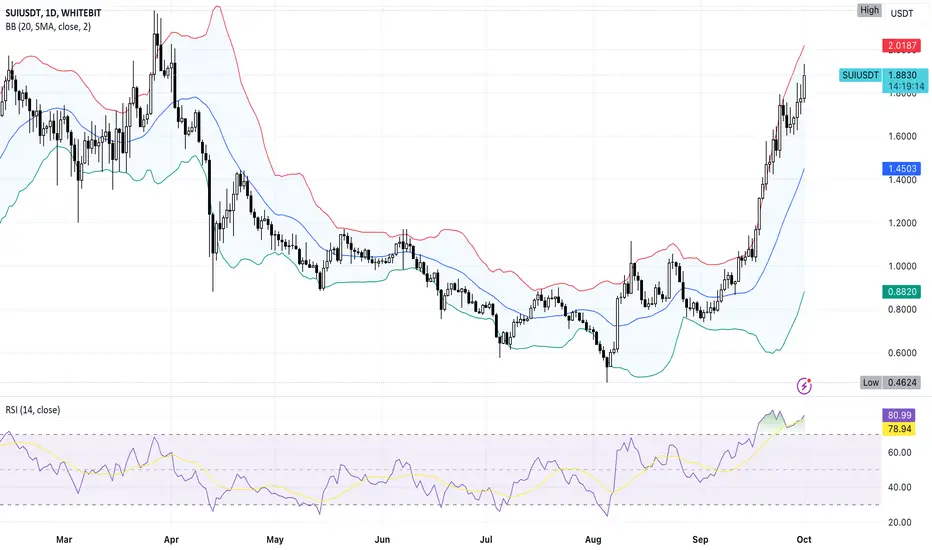
Up 46% Since Last Entry. What's next?
🔥📊 SUI Surges 47% Since September - Is $3 Next? 💥
Since my last post on September 19th, SUI has soared by 47%, moving from $1.31 to the current $1.88. We’re now approaching the first major resistance at $2.03, where I'll be considering taking some profits. However, the next big target is at $3.02.
For more details on mid-term targets, be sure to check out my previous chart linked below. As always, October tends to be a historically strong month for the markets, so this momentum could continue.
Stay sharp, and let’s make the most of it!
One Love,
The FXPROFESSOR 💙
Main chart and levels:

SUI breaks out with 132% volume surge: is a bull run ahead?Sui (SUI) is capturing the market’s attention with its recent price movement and increased trading volume. Many traders and analysts are wondering whether this momentum could signal the start of a sustained uptrend.
Therefore, it’s essential to examine key market metrics to understand the full picture.
At press time, SUI was trading at $1.73, reflecting a 2.98% increase over the past 24 hours. This steady rise signals growing confidence among investors.
Furthermore, Sui continues to test important resistance levels, which highlights the bullish sentiment surrounding the token.
The widening Bollinger bands between $1.40 and $1.97 suggest that volatility is increasing. In addition, the RSI stands at 78.02, deep in overbought territory, indicating robust buying pressure.
However, traders should remain cautious, as overbought conditions sometimes signal a potential short-term pullback.
Moreover, the surge in SUI’s trading volume is undeniable. With a massive 132.55% increase, the volume now sits at $2.71 billion. This significant rise underscores growing interest in the token across both spot and derivatives markets.
Historically, such volume spikes have preceded sharp price movements, and therefore, this increase could propel Sui’s price even higher in the coming days.
Given the current market conditions—rising price, surging volume, and increasing social dominance—SUI appears poised for continued growth.
While short-term pullbacks may occur, the data overwhelmingly supports the likelihood of a new uptrend. However, traders should stay vigilant as markets can shift quickly.
#SUI/USDT#SUI
The price is moving in a descending channel on the 1-hour frame and is sticking to it very well and is about to break upwards
We have a bounce from the lower limit of the channel at 1.690
We have a downtrend on the RSI indicator about to break, which supports the rise
We have a trend to stabilize above the moving average 100
Entry price 1.727
First target 1.800
Second target 1.862
Third target 1.936

SUI Can Burst. Considering the upward momentum of this currency in the weekly time frame, we can expect a powerful upward movement for it.

SUI 1.85 oh my goodness gracious i think my world just stopped as this looks and feel like it is going up relentlessly
is it late to get in or buy more or wait
oh well xmas rally seems to be happening and rate cut

SUI: Steady or sleepy?If you find this information inspiring/helpful, please consider a boost and follow! Any questions or comments, please leave a comment!
Followed the count up and hit the target box.
Now
Support Zones:
$1.450: Immediate support level if the price pulls back.
$1.161: A deeper support level, which coincides with significant previous price action.
Elliott Wave Structure: The chart shows a potential completing wave 3, and a potential corrective wave 4 before possibly moving into wave 5, which might bring a new high.
Outlook: The overall trend is bullish but it is getting extended.
Breaking the higher low pattern may be the signal a correction at the larger degree is coming.
Trade Safe.
Trade Clarity.

#SUI (SPOT) entry ( ,82- ,94 ) T. (1.4590) SL (0.7415)
entry range ( ,82- ,94 )
Target (1.4590)
SL .4H close below (0.7415)
#SUI
#SUIUSDT
#SUIUSD
#swingtrade
#shortterminvestment
#ALTCOIN
#Cryptotading
#cryptoinvesting
#investment
##trading
#cryptocurrencytrading
#bitcoininvestments
#Investing_Coins
#Investingcoins
#Crypto_investing
#Cryptoinvesting
**** #Manta ,#OMNI, #DYM, #AI, #IO, #XAI , #ACE #NFP #RAD #WLD #ORDI #BLUR #SUI ****
#bitcoin
#BTC
#BTCUSDT
BINANCE:SUIUSDT

Another Bullish Run Is Started 📈 Perfect Bullish Flag Formed At The SUI Chart By The Clear Corrective Structure And The Price Breakout From The Trend Line By The Strong Green Candle, Next Short Term Targets Are 1.9$ And 2.1$
The Main SUI Trend Is Extremely Bullish

SUI short SUI is very overpriced. Trust me it will fall. SUI went parabolic for 2 weeks and I think is it the right time to short it.

SUI's Impressive Performance
SUI started its upward trend when it broke through a 5.5-month downtrend shortly after its first listing times.
Now, by breaking through another 5-month downtrend between April and August, it has initiated a new uptrend. In just 2 months, it has quadrupled in price, capturing the market's attention.
After breaking the resistance of the blue downtrend, the price retested this level for two weeks and then continued upward. This indicates a healthy price movement.
The next significant resistance level seems to be around $1.86 - $1.95. If SUI can successfully maintain its price above this level, we can expect a positive short-term view.
In case of a potential pullback, we can use the orange uptrend channel as a reference. This is a healthy structure that has been in place since SUI's bottom. I believe it will provide good support during any retracements. It's upper line shows anout $1.4 nowadays.

SUI PriceSui (SUI) price has registered a double-digit rally over the past week, reaching the critical resistance barrier of $1.80.

Sui to shortSui is trading in a downward channel, one can open a short.
Entry: 1.6555
Tp 1 : 1.5950
Tp 2 : 1.5050
SL : 1.6880
Follow for more

SUI update The price must pass $2.2 to continue the bullish trend and cancel the blue idea.
Not being able to pass $2.2 is very bearish. Breaking $1 confirms the blue idea and cancels the white idea.

Sui (SUI) scores 11% growth in the last 24 hours: analysisWith a bullish recovery rally gaining momentum, the SUI token price shows an exponential rise. Over the past 24 days, it has increased by 135%, with a streak of massive bullish engulfing candles.
Currently, it is challenging the 78.60% Fibonacci level at $1.74. With a golden crossover in the daily chart, the RSI line is trading high in the overbought zone.
Based on the Fibonacci level, the next target for this rising altcoin stands at $2.00, with the upside potential to the $3.00 resistance level at $1.618 Fibonacci level.

SUI is at resistance $1.75 and rejected on daily (so far).NYSE:SUI #SUI #SUIUSDT #SUIUSD
SUI is at resistance $1.75 and rejected on daily (so far).
I am opening a short:
Stop is confirmation above $2.05 on daily.
Target is ~1.00

SUI pullback xac dinh xhpullback xac dinh xh
Structure Mapping
Sui is a first-of-its-kind Layer 1 blockchain and smart contract platform designed from the bottom up to make digital asset ownership fast, private, secure, and accessible to everyone. Its object-centric model, based on the Move programming language, enables parallel execution, sub-second finality, and rich on-chain assets. With horizontally scalable processing and storage, Sui supports a wide range of applications with unrivaled speed at low cost. Sui is a step-function advancement in blockchain and a platform on which creators and developers can build amazing, user-friendly experiences

2:1 RR 15% tradeThis trade is not fully developed, may not fill, requires a pullback from here, if it does though should be nice. There are some OK ranges and an established Trend. Although major target is hit, it is monthly and SUI can go higher.

SUI BULLISH SCENARIOThere are 2 posibilities, first of all SUI created a wyckoff acumulation on HTF and reacted from a weekly demand zone. I expect to reach 1.5 USDT.

SUIUSDT.PSUIUSDT.P is in reversal mode.
Bearish divergence also shown in RSI.
we wait for the further confirmation.
If price will break the last HL .
Then we will execute trade.

Sui (SUI): are we seeing 5$ growth?As the bull run in the crypto market gains momentum, the SUI price skyrockets at a breakneck speed. With a streak of bullish candles, the uptrend in SUI is challenging a resistance trendline near the initial price of $1.6785.
Will a new breakout run surpass the 78.60% Fibonacci level to hit the $5 psychological mark in October?
With a rounding bottom reversal in the weekly chart, the SUI price reveals a trend reversal rally. As the altcoin exceeds more than 100% returns in the last three weeks, the uptrend in SUI surpasses the $1.50 psychological mark.
The rounding bottom reversal teases a double bottom pattern with a neckline near $1.67. Further, the all-time high of $2.18 remains a high supply zone, and a breakout above this will boost the bull run.
Currently, the SUI price is trading at $1.55 with an intraday drop of 2.04%, concluding the bullish streak. Trading at just a 30% discount from its all-time high, the bull run shows potential for a new all-time high.
With the bullish trend reversal rally gaining momentum, the SUI price is likely to complete a double-bottom reversal beyond the 78.60% Fibonacci level at $1.7712.
Based on the Fibonacci levels, the uptrend in the SUI price is likely to target the $3 and $5 psychological mark. Further, the bull run history of the crypto market in October bolsters the chances of hitting the target.
On the flip side, the support levels for SUI are present at $1.50 and $1.33.

SUI/USDT Technical Analysis, 154% Potential surge in few weeks.SUI is showing strength as it approaches a critical resistance level. A confirmed breakout could push SUI into a price discovery phase, opening up the potential for significant gains.
Current Price: Around $1.02
Optimal Entry Zone: $0.75 to $1.00
Target: $2.58 (154% potential gain)
Resistance: A breakout above this level could unlock major upside potential
Lower Support: Strong support around $0.50
Two Potential Scenarios:
Scenario 1: A breakout and daily close above $1.10 will trigger a strong buy signal.
Scenario 2: A retest of the lower level between $0.75 to $0.95 offers an opportunity to accumulate.
Strategy:
To maximize gains while minimizing FOMO, consider buying 30% at the current price (CMP) and adding the remaining 70% if either of these scenarios plays out. This way, you’re positioned for profit regardless of the market's direction.
A breakout above this key resistance could see SUI reaching new highs.
This is a setup worth watching, especially for those looking to accumulate on retests.
Please keep it on your radar!
Not financial advice. DYOR!
Want more setups for spot and futures? Follow me and like this post!
Thank you
#PEACE

SUI: Gearing up for 150% Gain!#SUI has broken above the yellow dotted resistance trendline and is likely to continue its bullish rally. The price has shown a decent rebound, forming a support trendline, and is aiming to reach the upper resistance trendline.
Trade setup:
Entry 1: CMP
Entry 2: $0.54-$0.62
Targets: T1 $1.34, T2 $1.85, T3 $2.57
Trade type: Spot
Note: Accumulate on dips and always invest wisely. Do your own research and analysis before investing your hard-earned money.
Regards,
Team Dexter
#SUI #Crypto
