SUIUSDT LONG SIGNAL📢 **Official Trade Signal – SUI/USDT**
📈 **Position Type:** LONG
💰 **Entry Price:** 1.3930 (Limit Order)
🎯 **Take-Profit Targets (Partial Exits):**
• TP1: 1.4340
• TP2: 1.4932
• TP3: 1.5613
• TP4: 1.6414
🛑 **Stop-Loss:** 1.3507
📊 **Timeframe:** 15m
⚖️ **Risk/Reward Ratio:** —
💥 **Suggested Leverage:** 3×5
🧠 **Technical Analysis Summary**
Price is reacting near the lower trendline support with signs of short-term reversal.
A sustained hold above the entry zone increases the probability of continuation toward higher resistance levels.
Targets align with key liquidity and prior structure levels.
⚙️ **Trade Management Rules**
✔️ Take partial profit at TP1
✔️ Move Stop-Loss to Break-Even after TP1 is hit
✔️ Trail SL as price approaches higher targets
✔️ Avoid re-entry if Stop-Loss is hit
⚠️ **Risk-Management Note**
Capital protection comes first.
If price returns to BE after TP1 → zero-risk exit.
📌 **TradingView Hashtags**
#SUIUSDT #SUI #CryptoSignal #LongSetup
#TradingView #TechnicalAnalysis #Altcoins
Market insights

SUIUSDT - Readiness for bearish distributionBINANCE:SUIUSDT is updating local lows after breaking through consolidation support. The market structure is weak (bearish), and the decline may continue...
Bitcoin is consolidating in a symmetrical triangle. It is within a downtrend. A breakout of support will trigger a bearish rally. If the flagship of the crypto market begins to fall, altcoins may fall even lower. For SUI, within the D1 timeframe, there is potential for a fall to 1.3148 - 1.1163.
SUIUSDT has a weak market structure: a downtrend, declining highs, updating local lows, breaking through consolidation support.
If the bears keep the price below 1.4154, the altcoin's decline may continue towards the liquidity zone at 1.326
Resistance levels: 1.4154, 1.457, 1.4977
Support levels: 1.326
Bulls are not yet ready to make an effort to change the trend. The market is under selling pressure. Keeping the price below 1.4154 after breaking through the level could trigger further sell-offs towards a double bottom...
Best regards, R. Linda!

#SUI/USDT Could switch sides soon. Be ready#SUI
The price is moving in a descending channel on the 1-hour timeframe. It has reached the lower boundary and is heading towards breaking above it, with a retest of the upper boundary expected.
We have a downtrend on the RSI indicator, which has reached near the lower boundary, and an upward rebound is expected.
There is a key support zone in green at 1.40. The price has bounced from this zone multiple times and is expected to bounce again.
We have a trend towards consolidation above the 100-period moving average, as we are moving close to it, which supports the upward movement.
Entry price: 1.43
First target: 1.46
Second target: 1.50
Third target: 1.56
Don't forget a simple principle: money management.
Place your stop-loss below the support zone in green.
For any questions, please leave a comment.
Thank you.

SUI/USDT - Breakouts! Is This the Start of a Trend Reversal?On the 12-hour timeframe, SUI/USDT has successfully broken above the descending resistance trendline that had capped price action since October. This breakout indicates weakening selling pressure and opens the door for a trend transition from bearish toward early bullish conditions.
Price is currently trading around 1.48 USDT, hovering near the former trendline area, suggesting a post-breakout consolidation / retest phase.
---
Pattern Explanation
The dominant technical structure now is:
Descending Trendline Breakout (Potential Trend Reversal)
The long-term descending trendline has been decisively broken
Bearish lower-high structure is losing control
Sideways movement above the trendline suggests a successful retest attempt
Technically, this pattern often marks the early stage of a trend reversal, as long as price holds above the breakout zone.
---
Key Levels
Support (Post-Breakout):
1.45 – 1.48 USDT → Critical breakout retest zone
1.35 USDT → Invalidation level
Resistance / Upside Targets:
1.65 – 1.72 USDT → Nearest resistance
1.96 USDT → Strong supply zone
2.05 – 2.37 USDT → Major resistance area
2.70 USDT → Extended bullish target if reversal fully develops
---
Bullish Scenario (Primary Scenario)
The bullish case becomes the primary scenario if:
1. Price holds above the 1.45 – 1.48 USDT support zone
2. The former trendline acts as new support
3. Bullish continuation candles appear
Bullish Targets:
TP1: 1.65 USDT
TP2: 1.72 USDT
TP3: 1.96 USDT
TP4: 2.05 – 2.37 USDT
---
Bearish Scenario (Invalidation Scenario)
The bearish scenario only applies if:
1. Price falls back below the broken trendline
2. A strong close occurs below 1.35 USDT
Bearish Targets:
1.23 USDT
Lower supports if selling pressure accelerates
As long as price remains above the breakout area, bearish continuation is not favored.
---
Conclusion
The breakout above the descending trendline on SUI/USDT represents a potential early trend reversal signal. The key focus now is whether price can defend the breakout zone as support.
➡️ Holding above support = bullish continuation
➡️ Break back below = false breakout
This is a critical decision zone for the next directional move.
---
#SUIUSDT #SUIBreakout #TrendReversal #CryptoAnalysis #TechnicalAnalysis #Altcoin #SupportResistance #CryptoTrading

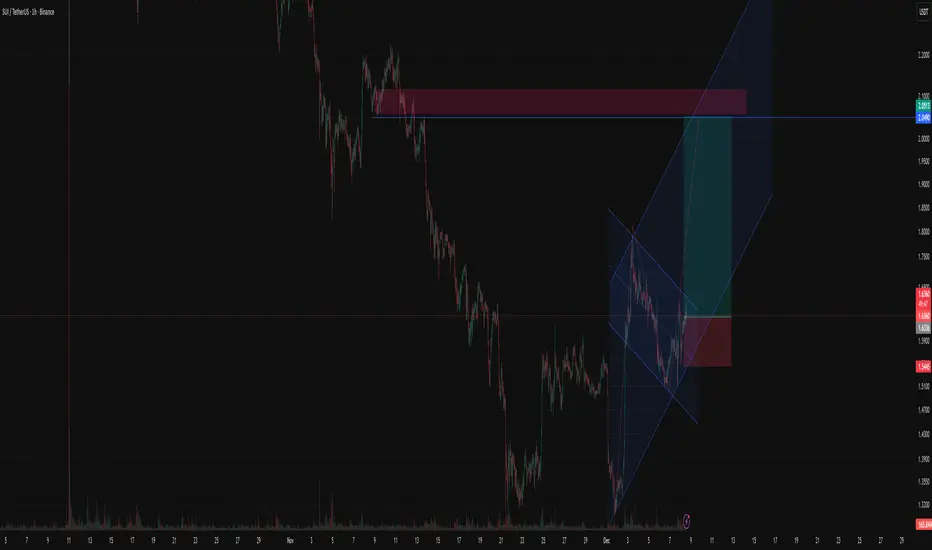
Break Out And Retest.As the diagram above shows, its that simple we wait for a break and retest out of the bearish flag to take a buy to the up side. ( key resistance level for me is the high of last month's candle)

#SUI/USDT Could switch sides soon. Be ready#SUI
The price is moving in a descending channel on the 1-hour timeframe. It has reached the lower boundary and is heading towards a breakout, with a retest of the upper boundary expected.
We are seeing a bearish trend in the Relative Strength Index (RSI), which has reached near the lower boundary, and an upward bounce is expected.
There is a key support zone in green at 1.37, and the price has bounced from this level several times. Another bounce is expected.
We are seeing a trend towards stabilizing above the 100-period moving average, which we are approaching, supporting the upward trend.
Entry Price: 1.40
First Target: 1.431
Second Target: 1.465
Third Target: 1.50
Remember a simple principle: Money Management.
Place your stop-loss order below the green support zone.
For any questions, please leave a comment.
Thank you.

SUIUSDT – Trade ideaSUI is trading inside a broader downtrend but is currently reacting from a key demand area with multiple FVGs below.
Price already tapped the upper imbalance and may sweep lower liquidity before continuation.
Positioning
Already in the trade.
Looking to add more on deeper pullbacks into the lower FVG, aiming for a higher time-frame mean reversion move.
Bias
As long as price holds above invalidation, this remains a pullback-to-imbalance long setup.
Patience is key — let price fill the imbalance.
MrC

Long trade Buyside trade 3
Mon 22nd Dec 25
LND Session AM
10.55 am
Entry 1.4662
Profit level 1.4970 (2.10%)
Stop level 1.4609 (0.36%)
RR 5.81
SUIUSDT.P — Sentiment Analysis Summary- Buyside trade
5min TF entry
Sell-side liquidity has been exhausted below the NY session low, with price now accepting above prior value and targeting buy-side liquidity resting in premium inefficiencies — short-term bullish bias remains intact while HTF structure remains rotational
🧭 Structural Context
Price has successfully defended the prior NY Session Low (19th Dec) and the 5-min demand zone, confirming sell-side exhaustion. Subsequent price action shows higher lows and impulsive displacement, indicating bullish intent rather than corrective relief. The most recent London-to-early NY price action indicates acceptance above the prior value, not rejection.
PD Arrays & Imbalances
Multiple 5-min FVGs below the price have been mitigated, reducing downside draw.
The current structure is trading inside bullish inefficiency, supporting continuation.
💧 Liquidity & Order-Flow Narrative
Sell-side liquidity, which has been below recent lows, has been fully consumed.
No sustained acceptance below that zone → assume bearish continuation invalidated.
Price is now gravitating toward buy-side liquidity resting above:
Prior London & Tokyo session highs
NY Session High (19th Dec) ~1.4970
Untapped premium FVGs
🧠 Smart Money Read:
Downside liquidity was engineered to reload long inventory, followed by controlled upside expansion.

Long trade Buyside trade
Sun 21st Dec 25
LND Session AM
8.25 am
Entry 5min TF
Entry 1.4424
Profit level 1.4843 (2.90%)
Stop level 1.4391 (0.22%)
RR 12.7
📌 SUIUSDT.P — Buy-Side Liquidity Expansion (30M)
Market: SUIUSDT Perpetual
Timeframe: 30 minutes
Model: AMD (Accumulation → Manipulation → Distribution)
Bias: Bullish continuation after sell-side failure
🔍 Market Context -STRUCTURE
The price traded back into discount territory following a controlled sell-side sweep below the prior session's lows. Higher-timeframe structure remains intact, with no bearish BOS confirmed. This created a classic environment for buy-side delivery once liquidity has been engineered.
🧠 Setup Logic (Institutional Narrative)
Accumulation (A):
Range compression following sell-side sweep
Price stabilises inside a defined demand zone
Manipulation (M):
Wick and displacement observed - demand zone
Stops cleared beneath NY session lows
Distribution / Expansion (D):
Strong bullish displacement from demand
Expansion delivered during the London → NY overlap
🟦 TAB 6 — FVG / INEFFICIENCY
Multiple 5m / 30m FVGs below price
Price respected FVG support on retest
Clean imbalance → expansion behaviour

BUY BIAS I've been watching it for days now, gotten my confluence so I'll entering now... posting it for those who would wanna take it as well, if you come across this 2 hours later I wouldn't recommend you join. Not a financial advice risk what you can afford to lose. The trade is just my idea nothing is certain in the market.

#SUI/USDT Could switch sides soon. Be ready#SUI
The price is moving in a descending channel on the 1-hour timeframe. It has reached the lower boundary and is heading towards breaking above it, with a retest of the upper boundary expected.
We have a downtrend on the RSI indicator, which has reached near the lower boundary, and an upward rebound is expected.
There is a key support zone in green at 1.38. The price has bounced from this zone multiple times and is expected to bounce again.
We have a trend towards consolidation above the 100-period moving average, as we are moving close to it, which supports the upward movement.
Entry price: 1.40
First target: 1.42
Second target: 1.44
Third target: 1.48
Don't forget a simple principle: money management.
Place your stop-loss below the support zone in green.
For any questions, please leave a comment.
Thank you.

Rising Channel Breakdown → Waiting for Better Buy Prices on SUISUI has been moving inside a well-defined rising channel on the higher timeframe, forming higher highs and higher lows. However, price is now trading near the lower boundary of the channel , showing signs of weak momentum and potential breakdown.
Historically, a loss of the rising channel support often leads to a deeper corrective move, especially after an extended uptrend. Current structure suggests that downside continuation is more likely before any sustainable bullish scenario.
📌 Key points:
Long-term ascending channel
Price approaching / losing channel support
Increased risk of trend exhaustion and correction
🎯 Downside targets:
Target 1: $0.60
Target 2: $0.25
🛑 Conclusion:
At current levels, buying SUI is not attractive from a risk-reward perspective. A better strategy is to wait for deeper pullbacks and signs of stabilization near the mentioned targets before considering long positions.
This is a patience trade — better prices are likely ahead.

Sui (SUI): Each Start of Pump Been Different | Looking For Pump!SUI might be forming for the 3rd time the pattern that previously has been giving us a decent upside movement.
Now the start of the pump is hard to determine, as it has always been different but the pattern remains the same. As price currently has formed some kind of supportive zone, we are expecting to see a decent breakout to form from here, which would then lead the price to upper zones.
The first target is going to be the EMAs, which, upon seeing a breakout from, will be our second confirmation where we could open another long position (until the next break of local top)
Swallow Academy

SUI at a Major Decision Point!#SUI is now sitting on a major long-term trendline a level that has held since launch. 👀
Every time the price touched this trendline, SUI started a strong move up.
We’re back here again… right at support + near the 0.786 Fib zone.
If buyers step in, a bounce toward $2.2 → $2.8 is the next key target.
If this level breaks, only then do we look lower.
Big moment for SUI.
Stay alert.
#Crypto

SUI - Catching a Falling KnifeAlright traders, we’re clearly seeing a selloff today…
BUT — and this is very scientific —
I just don’t feel it. 😄
Somewhere deep inside my trader soul,
I still smell a little Santa rally coming for the whole crypto market.
Either that…
or Trump tweets something weird,
and we’re all instantly screwed.
50/50. 🎅💥😂
Now about SUI:
Yes, this is technically a falling knife situation.
Yes, that sounds scary.
But honestly?
The probabilities here are not that bad.
Why I’m taking it:
• liquidity was already taken below
• we had a nice upward move a few days back
• continuation is still possible
• and this whole drop kinda smells like pre-macro manipulation
So yeah —
this is a swing trade,
BUT with a tight stop loss,
because I like excitement, not account destruction. 😄
Could this fail? Absolutely.
Could it work beautifully? Also yes.
That’s crypto.
Let’s see how this plays out.
Good luck traders — and may the knife stop falling right where we catch it 🔪📈😄

SUI/USDT - upmove100%Over the past 20 days, SUI/USDT has shown clear signs of strong buyer participation, aggressively defending the 1.30–1.40 demand zone

Start of a full-blown uptrend: 2.0-2.1446
Hello, traders!
Follow us to get the latest information quickly.
Have a great day!
-------------------------------------
(SUIUSDT 1M chart)
To continue the uptrend, the price must rise above the M-Signal indicator on the 1M chart and hold.
Accordingly, the key question is whether the price can rise above the 2.0-2.1446 range and maintain its upward momentum.
If the upward movement fails, we should observe whether the M-Signal indicator on the 1M chart moves sideways until it declines near the Fibonacci level of 0.236 (1.3434).
-
(1W chart)
The key question is whether the price can find support and rise near the newly forming DOM (-60) ~ HA-Low range (1.4969-1.8396).
Based on the basic trading strategy, the target range is around the 4.2272-4.7328 range.
However, caution is advised when trading, as the price is currently forming below the M-Signal indicator on the 1M chart.
Therefore, I think it's best to start trading after confirming whether the price rises to around 2.0-2.1446 and maintains its strength.
-
(1D Chart)
When analyzing charts, it's best to observe the movements of the 1D chart as a basic trading strategy.
This is because most indicators are derived from the 1D chart.
In this sense, the key is whether the price can find support and rise around the 1.3451-1.5174 range, which is the DOM(-60) ~ HA-Low range on the 1D chart.
As mentioned earlier, to sustain the uptrend from a long-term perspective, the price must remain above the M-Signal indicator on the 1M chart. Therefore, the current price level is not suitable for trading.
A decline in the DOM(-60) ~ HA-Low range could lead to a step-down trend.
This means that the price is renewing its low, but it can also be considered a time for a split buy.
Therefore, you should consider how to execute a split buy before starting a trade.
If the price rises from the DOM(-60) to HA-Low range, the HA-High to DOM(60) range will form.
Therefore, if you bought near the DOM(-60) to HA-Low range, you should sell near the HA-High to DOM(60) range.
However, if the price rises from the HA-High to DOM(60) range, it's likely to form a step-up trend, so it's recommended to sell in steps.
As mentioned earlier, a step-up trend, like a step-down trend, means that the price is renewing its high.
Therefore, since a sharp decline is possible at any time, it's advisable to sell in steps at the appropriate time to secure profits.
-
In summary, if you encounter the DOM(-60) or HA-Low indicators, you should focus on finding the right time to buy and consider how to execute the split purchase.
Furthermore, if you encounter the DOM(60) or HA-High indicators, you should focus on finding the right time to sell and consider how to execute the split purchase.
This is the basic trading strategy.
If not, and you buy when the HA-High ~ DOM(60) range supports and rises, or sell when the DOM(-60) ~ HA-Low range resists and falls, it's best to maintain your stop loss.
-
Thank you for reading to the end.
I wish you successful trading.
--------------------------------------------------

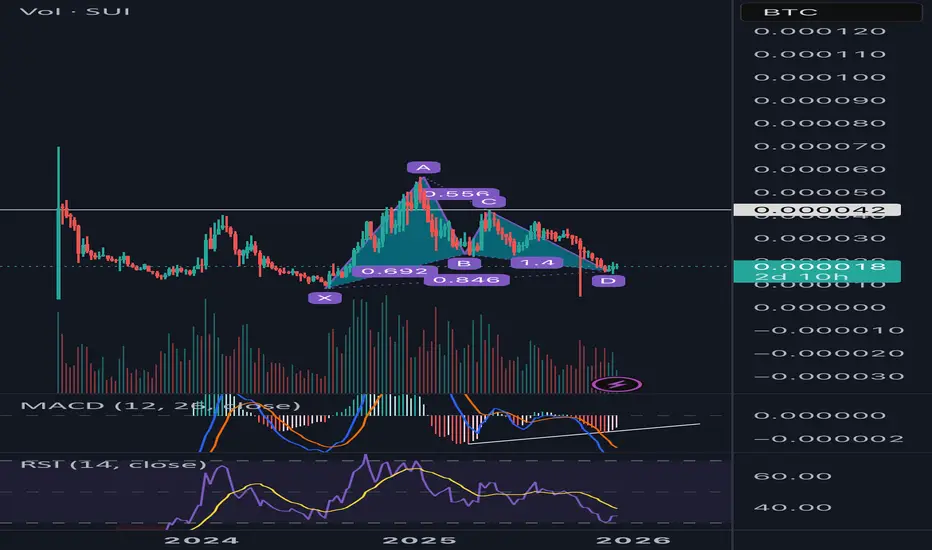
SUI/BTC Weekly: One of the Cleanest Bullish Bat PatternSUI/BTC has just completed a textbook Bullish Bat harmonic exactly at the 0.886 XA retracement while simultaneously finishing a 7-month falling wedge. This is rare high-timeframe confluence that historically leads to violent altcoin outperformance against Bitcoin — exactly the type of setup that kicks off altseason rotations.Chart Overview (1W SUI/BTC) Multi-month falling wedge since July 2025 high
Price has respected the lower wedge boundary 4 times
Exact completion of a Bullish Bat at the 0.886 retracement (PRZ = 0.0000138–0.0000142)
Current price sitting at ~0.000018 (rejection candle off the PRZ)
Bullish Bat Measurements (all ratios within tolerance) XA: base leg
AB = 0.692 retracement of XA
BC = 0.556 retracement of AB
CD = 1.40 extension of BC
XD = 0.846 (target 0.886 hit with <5% error) → perfect Bat completion
Additional Confluence MACD histogram flipping positive + bullish crossover forming
RSI broke its multi-month downtrend at the exact low
Volume spike at the PRZ + declining volume on the pullback = exhaustion
Pattern sits inside the larger $OTHERS/BTC falling wedge that is also approaching apex
Narrative Fuel (already in motion) Sui TVL exploding past $2.6B
USDS stablecoin (Stripe-backed), wBTC integration, ETF filings
Highest fees & real revenue among new L1s
Institutional products launching (Grayscale Trust, 21Shares/Bitwise filings)
Conclusion
This is not just another altcoin setup — it’s a weekly harmonic reversal inside a multi-month falling wedge with momentum and fundamentals aligning perfectly.
Setups like this have preceded the strongest alt/BTC moves of previous cycles.
SUI is positioned to lead the next leg of altseason when Bitcoin dominance finally cracks.Risk management: Keep invalidation tight, but conviction can be high.
This is the type of structure you look back on and say “that was the bottom.”Position: Long SUI (spot or responsible leverage)
Timeframe: 2–12 weeks for initial move, potential multi-month runner Let the wedge break and the Bat fly.
SUI/USDT - Market StructurePrice is attempting a reversal via a double bottom.
The key resistance at the moment is the prior low zone at $1.70–1.90.
RSI is also capped near the 50 level, preventing a move into bullish territory.
On the weekly chart , the only potential reversal signal so far is extreme RSI oversold conditions — no other confirmations yet.
Current structure allows for a long setup with clearly defined risk:
— stop-loss below $1.50.
Since price is trading inside a channel, the majority of the position should be taken off just below the channel midline.

SUI/USDT : LIMITHello friends
As you can see, after the resistance level we set was broken, the price has grown well, and now with this bullish trend, there is a sign of sellers entering, and there is a possibility of price correction, and the price can grow again from these areas and move to our targets.
This analysis is technically reviewed and is not a buy or sell recommendation, so please follow risk and capital management.
*Trade safely with us*

SUI Second Entry for Target 2$The Shape That formed for Sui Show us it will explode like before wave . Really fast rising that you can't wait retracement for another entry . Risk management Is very necessary for Entering.
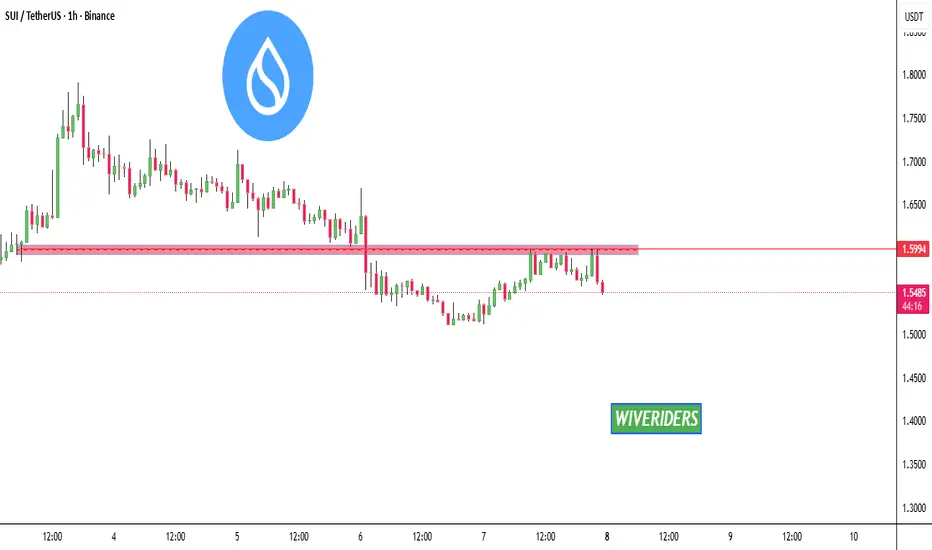
SUI failed to break out above the red resistance zone🚨📊 SUI Update
SUI failed to break out above the red resistance zone 🔴
and got rejected, confirming strong seller presence.
As long as price stays below this level,
upside remains limited.
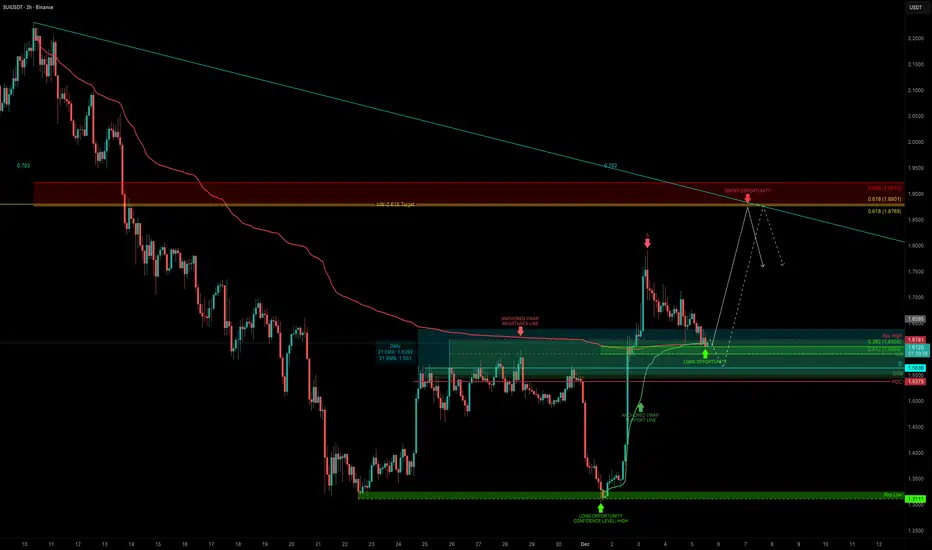
SUI: The Power of ConfluenceSUI just delivered one of the cleanest moves. After sweeping the liquidity low at $1.3111, price launched nearly +40% in under two days, ripping through a full 5-wave impulse and breaking market structure. Now that the fast move is done, the real question is:
Where’s the next high-probability setup?
To answer that, we break down the support/resistance zones, VWAP structure, Fibonacci levels, and market cap confluence that are now forming.
1. The Key Support Cluster at $1.60
To map the next setup, we first look for strong support. And right now, $1.60 is loaded with confluence:
Anchored VWAPs from both the swing low ($1.3039) and swing high ($2.231) meet at roughly $1.60
Fibonacci Retracement
The 0.382 retracement of the entire impulse sits exactly at $1.60. After fast moves, holding the 0.382 is typically what you want to see for bullish continuation.
Dynamic EMAs & SMAs: Daily 21 EMA → $1.64, Daily 21 SMA → $1.55.
These are dynamic tools, so they shift over time, but both are already closing in on the same zone.
Daily level at $1.5636
POC of the previous range at $1.5375.
Both overlap with the daily order block, adding confidence.
Monthly Anchored VWAP.
Currently around $1.5782, giving this area even more weight.
Market Cap Confluence
$1.60 ≈ 6B market cap
$1.87 ≈ 7B market cap
I like using market caps as macro support/resistance, and these levels line up beautifully. All in all, $1.55–$1.60 is shaping up as the main demand zone.
2. Upside Target → the 0.618 Fib
Using the retracement from the downward move
($2.231 → $1.3039), the 0.618 Fib sits at $1.8768.
This also lines up with the 7B market cap and previous resistance structure.
That makes it the main target for the next leg up.
3. Risk Management
An entry between $1.60-$1.55 with an SL below the POC / order block allows for:
R:R between 1:4 and 1:6 (depending on how you ladder)
Clear invalidation
Strong structural backing
Multiple layers of confluence
Summary
SUI swept a major low, completed a sharp impulse, and broke market structure. Now it’s retracing into what looks like a high-confluence long zone around $1.55–$1.60. If this support zone holds, the next target is $1.87, giving a clean and logical long setup with solid R:R.
🔍 Indicators used
Multi Timeframe 8x MA Support Resistance Zones → to identify support and resistance zones such as the daily 21 EMA/SMA.
➡️ Available for free. You can find it on my profile under “Scripts” and apply it directly to your charts for extra confluence when planning your trades.
_________________________________
💬 If you found this helpful, drop a like and comment!