TradeCityPro | SUIUSDT Is the best time to buy ?👋 Welcome to TradeCityPro Channel!
Let's analyze and review one of the most popular coins in the market, sui, and update our previous analysis and find new triggers
🌐 Overview of Bitcoin
Before starting the analysis, I want to remind you again that we moved the Bitcoin analysis section from the analysis section to a separate analysis at your request, so that we can discuss the status of Bitcoin in more detail every day and analyze its charts and dominances together.
This is the general analysis of Bitcoin dominance, which we promised you in the analysis to analyze separately and analyze it for you in longer time frames.
Very briefly, we are going to take a look at the SUI chart in a nutshell so that we don't miss the triggers
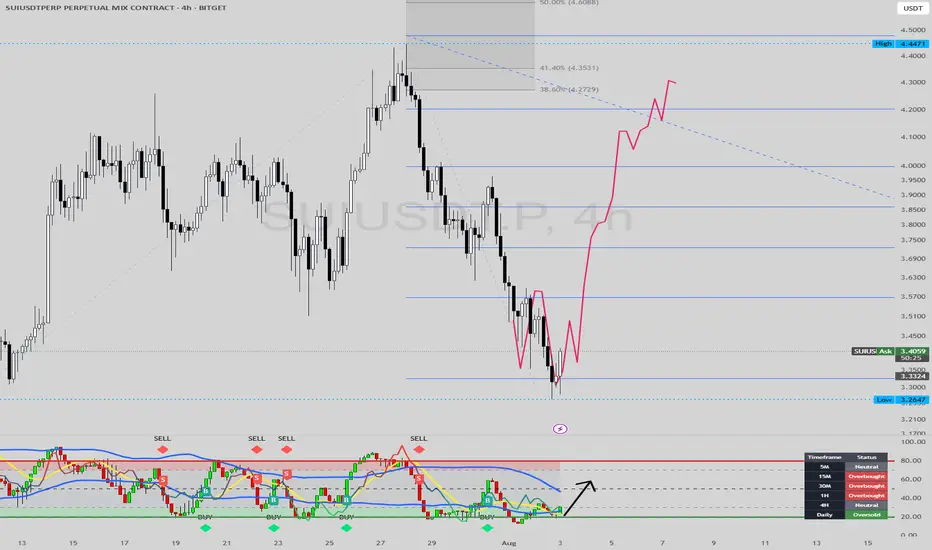
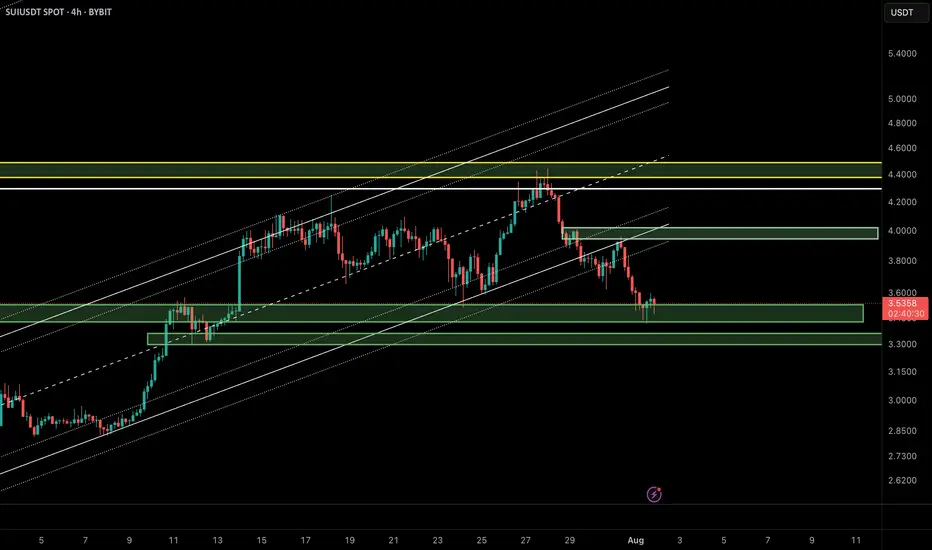
We are currently inside our 4-hour range box and are fluctuating between 3.31 and 3.59
After the 3.59 break or the 3.31 fake breakout, I will definitely try to open a long position and I also need volume confirmation for this.
For short positions, the 3.31 break is a very good trigger, but try to pay more attention to other charts. If you open with the failure of this trigger, try to save your profit very quickly.
📝 Final Thoughts
Stay calm, trade wisely, and let's capture the market's best opportunities!
This analysis reflects our opinions and is not financial advice.
Share your thoughts in the comments, and don’t forget to share this analysis with your friends! ❤️
SUIUST trade ideas

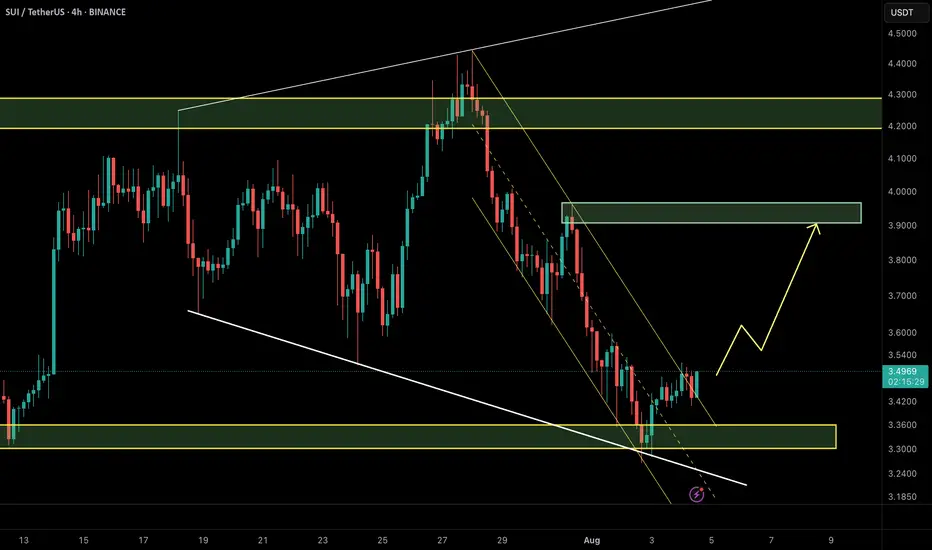
SUI/USDT – Price Outlook (2H TF)🔍 Updated Aug 4, 2025 | SMC + NeoWave
SUI has broken out of the descending channel and is currently holding above the strong demand zone around $3.35–$3.40. This zone overlaps with a bullish order block and prior trendline support.
📌 Bullish Scenario (preferred):
Price confirms support → Push toward $3.90–$4.00 supply zone.
📌 Invalidation:
A close below $3.35 invalidates the setup and suggests continuation of the correction.
💡 Tip: A breakout of structure (BOS) + mitigation of OB = solid confluence for long setups.
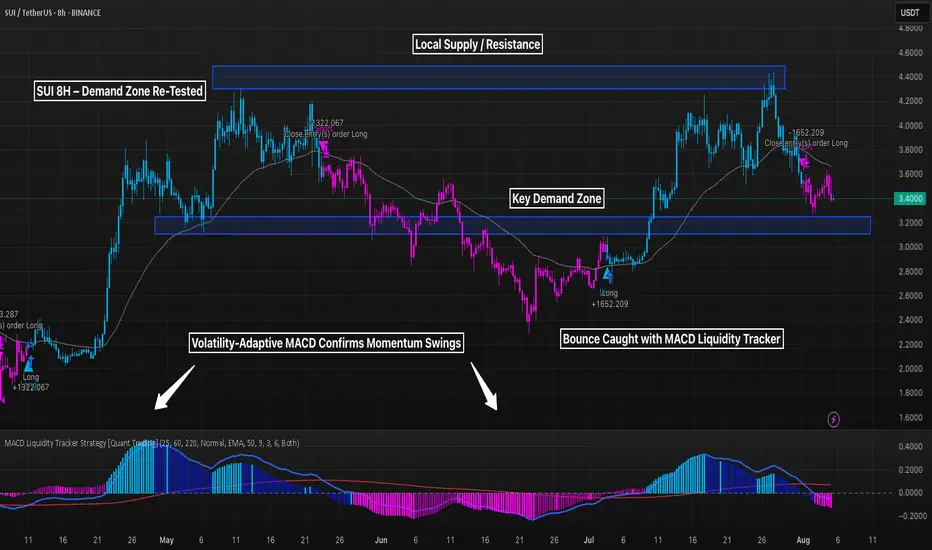
SUI 8H – Demand Zone Re-Tested, Will Strategy Fire Again Soon?SUI is approaching a major demand zone after rejecting from local highs near $4.60 — and the MACD Liquidity Tracker Strategy just closed its most recent long position. With momentum fading and price nearing structure, the next signal could be pivotal.
🔹 Strategy Settings
MACD: 25 / 60 / 220
System Type: Normal
MA Filter: EMA 50, VIDYA smoothing (9)
This configuration has historically excelled on volatile pairs like SUI — catching high-RR reversals from demand zones.
🔹 Price Structure
Key support sits between $3.10–$3.30 — a previous breakout base.
If price retests this zone and MACD curls, we may get another high-conviction entry.
Resistance remains at $4.50+, where the last major exit was triggered.
🔹 Momentum Check
MACD histogram flipped bearish, but flattening — suggesting weakening downside.
Strategy will likely stay flat until a new trend forms, giving traders time to prep.
Will the bot strike again at support — or is SUI setting up for something deeper?
Let’s analyze 👇
SUI Swing Buy / Long SetupSui is on Strong and decision Order block on 1 day Timeframe, If we break this then SUI will take correction till recent weekly low. If we hold this then new ath. Book some or 80% on mentioned area, rest hold till 6$.

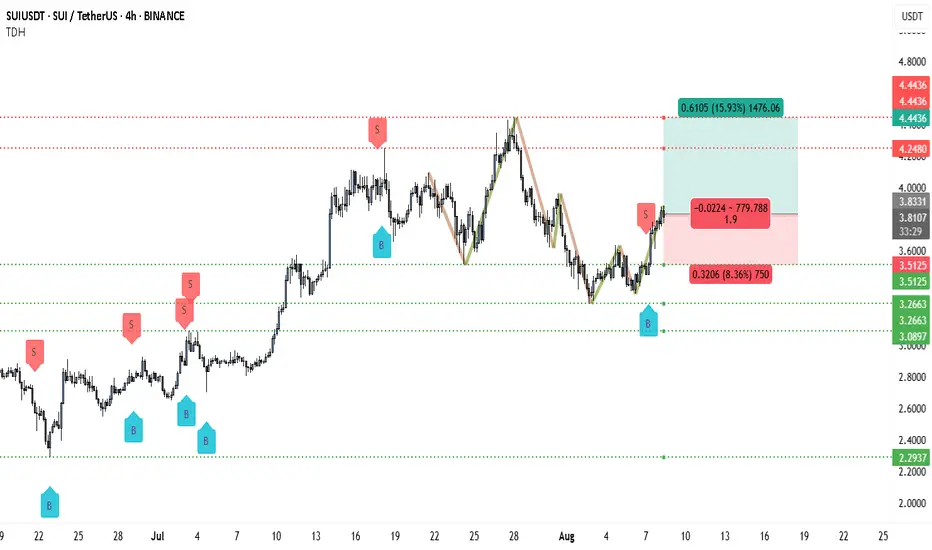
SUI Bulls Are Back – Target $4.44?SUI has rebounded strongly from the $3.089–$3.266 demand zone, establishing a clear higher low on the 4H chart. This bounce was followed by a decisive break above short-term resistance near $3.60, signaling renewed bullish momentum. Price is now around $3.83, just below the key $4 psychological barrier, where buyers appear poised to push toward higher resistance levels.
The structure favors continuation to the upside as long as $3.512 holds as support. A strong 4H close above $3.85–$3.90 could unlock the move toward $4.24 and potentially $4.44. Momentum indicators align with price action, suggesting the uptrend has further room to extend.
Trade Setup
• Entry: $3.83 (or pullback to $3.70–$3.75)
• Stop Loss: $3.512
• Target 1: $4.248 (~10.9%)
• Target 2: $4.443 (~15.9%)
• Partial Profit Plan: Take some profits near $4.24 to lock in gains, let the rest run toward $4.44 depending on momentum and your risk profile.
📌 It is recommended to book partial gains along the way and use trailing stops to protect profits while allowing the trade to capture extended upside moves.
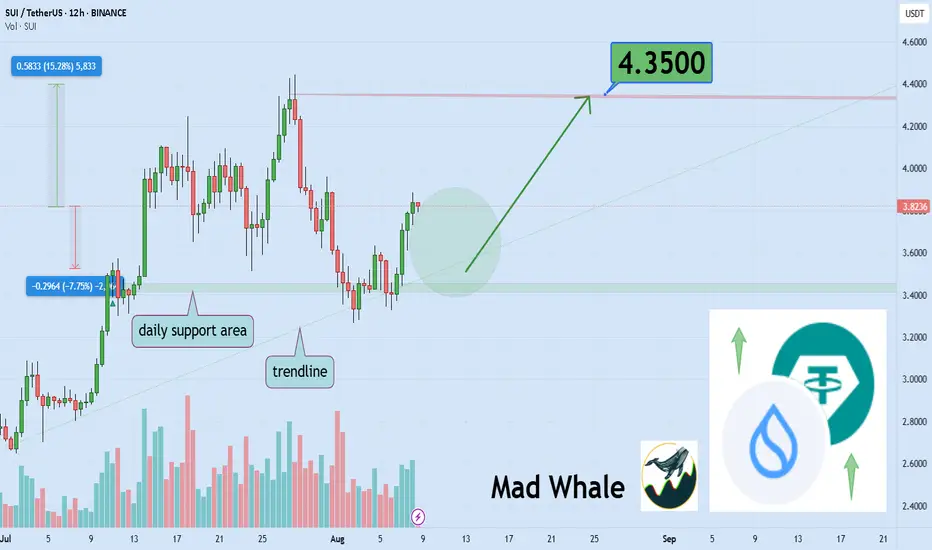
SUI Holds Final Support, Eyes 15% Rally Toward $4.35Hello✌️
Let’s analyze SUI’s price action both technically and fundamentally 📈.
🔍Fundamental analysis:
The SEC is looking at two SUI ETF proposals, with a decision expected by Jan 2026. Big banks and funds are getting involved, which could impact supply and demand.
📊Technical analysis:
BINANCE:SUIUSDT has lost all major Fibonacci supports, with daily support and trendline as final defenses 📉. If these hold and volume remains stable, a 15% rally toward \$4.35 is likely 🚀.
✨We put love into every post!
Your support inspires us 💛 Drop a comment we’d love to hear from you! Thanks, Mad Whale
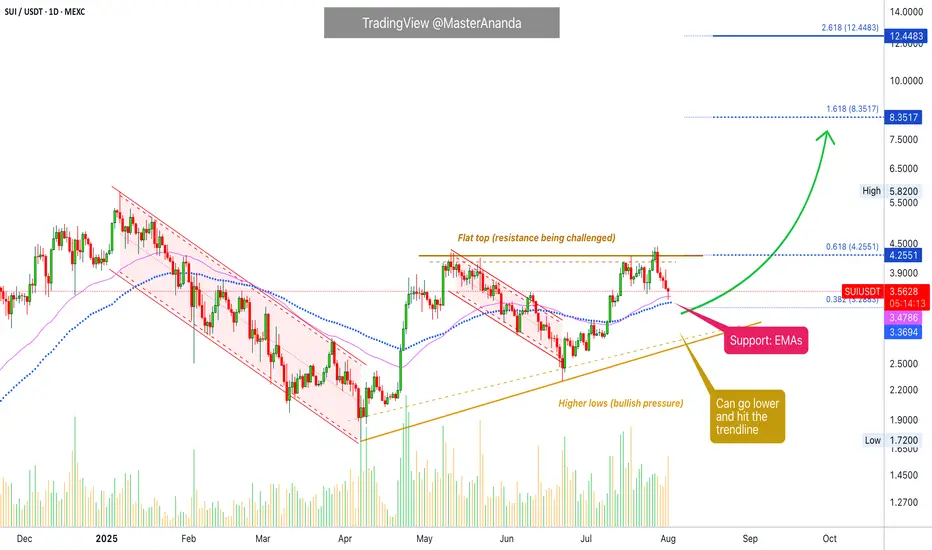
Sui Update · Support Found, Moving AveragesWe will focus solely on the chart. As a move happens, there are always fluctuations, down and up. What determines the trend is not the short-term but the broader market move. When a pair is producing higher highs and higher lows, we are growing and going up. If there is a drop short-term, this is nothing more than a retrace because prices (profits) are rising mid- and long-term. This is the current situation and has been true for many months.
Each time Sui retraces, it finds support and then continues to grow.
SUIUSDT peaked 28-July, now five days ago. A classic retrace because after this date all days are red. Facing resistance led to immediately to a test of support. A test of support tends to lead to a new challenge of resistance.
SUIUSDT is working support at EMA89 and EMA55 daily, the same levels we had active on the last update. These levels seen to be holding strong so far and if they hold, we can see growth right away. Normally, support tends to be pierced briefly and then the market turns. So anything goes.
We can see a reversal happen now, or it can take a few days at most. The action is already happening at support and within a higher low. It can move a bit lower, but we are getting ready for the next bullish jump. This one will be a surprise and it will bring the entire market up. No excuses, no reason, just up.
Namaste.
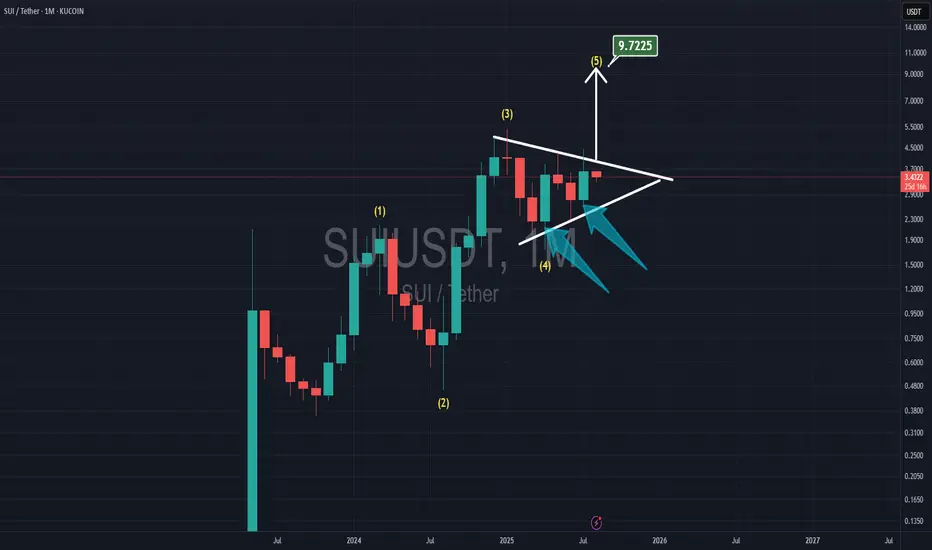
SUI TO $10.00With Elliot waves count, now SUI is in the 5th wave.
It has 2 bullish monthly candles for April & July, and SUI is playing inside the triangle which shows me with the breakthrough the resistance, the target is at $10
SUI LONGFollowing a significant decline, the asset will take support and bounce back from this point.
Disclaimer: This is not financial advice.
This algorithm provides highly precise buy and sell signals with alerts:
#SUI TRADE PLAN Closely monitoring the trade. Would update once a decision candle is formed.
Keep watching
SUI’s Next Big Move? Key Levels You Must WatchHey friends, it’s Skeptic 🩵
In this video, I’m diving into the current setup on SUI – whether to long or short, plus an update on market context and risk zones.
I broke down key levels, previous triggers, and what price action is hinting at next.
This one’s packed with insights, especially if you're in futures or looking for an entry on spot.
⚠️ Don’t forget about risk management – chasing pumps is a recipe for FOMO and mistakes.
💬 Let me know your thoughts on SUI in the comments, and let’s talk setups.

SUI 8H – Trendline Bounce Into Layered Supply ZonesSUI just respected a multi-week ascending trendline on the 8H chart — marking its third major touch since June. After a strong bounce from the $3.35 region, price is now moving with momentum, aiming toward two clearly defined supply zones stacked above.
The structure sets up a textbook bullish continuation play, with confluence from Stoch RSI flipping upward and trendline support staying intact.
🔍 Key Zones:
– Trendline Support: Untouched since mid-June
– First supply zone (~$3.95–$4.10): Initial retest target
– Second supply zone (~$4.40–$4.65): Key breakout trigger zone
– Stoch RSI just reset and is now pushing upward = momentum confirmation
A clean rejection at the first box would suggest chop or potential fakeout — but a break and retest could open the door to retesting highs above $4.80+.
This chart tells a simple story: trend is still intact, and bulls are in control — unless proven otherwise.
👇 Bullish? Bearish? Let’s hear your take.

#SUI/USDT Update – Bounce Setup from Demand Zone?#SUI
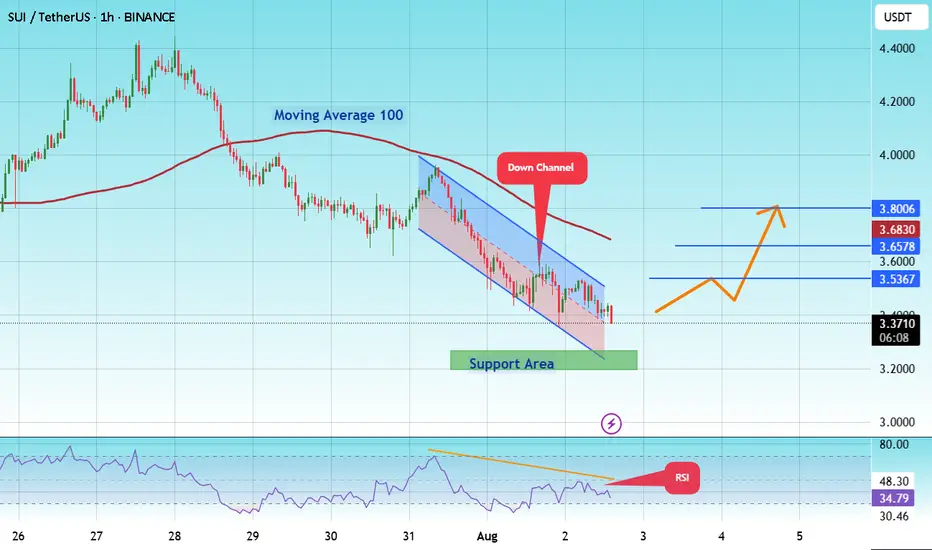
The price is moving within a descending channel on the 1-hour frame and is expected to break and continue upward.
We have a trend to stabilize above the 100 moving average once again.
We have a downtrend on the RSI indicator that supports the upward break.
We have a support area at the lower boundary of the channel at 3.27, acting as strong support from which the price can rebound.
We have a major support area in green that pushed the price higher at 3.20.
Entry price: 3.38
First target: 3.58
Second target: 3.65
Third target: 3.80
To manage risk, don't forget stop loss and capital management.
When you reach the first target, save some profits and then change the stop order to an entry order.
For inquiries, please comment.
Thank you.
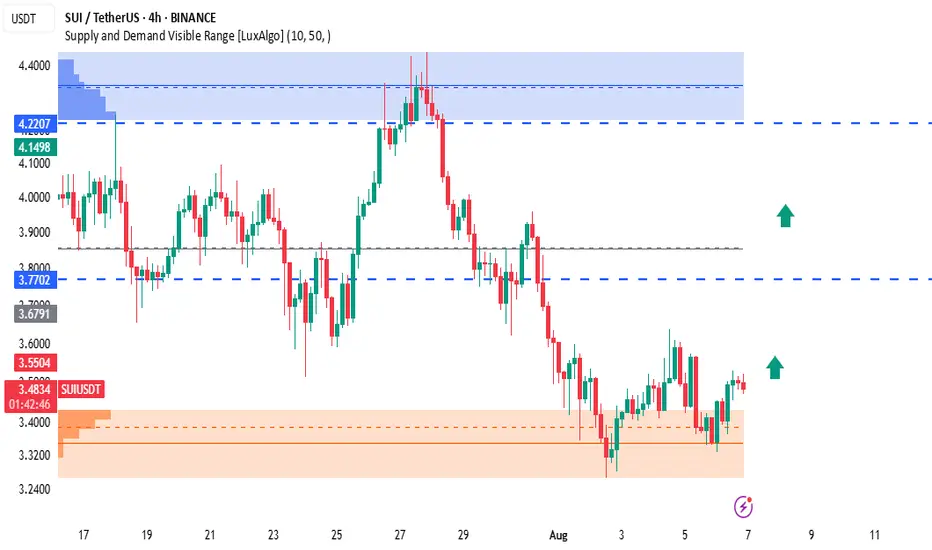
SUI/USDT Bullish Setup – Strong Rejection from Demand Zone!SUI is showing early bullish momentum after rebounding from a solid demand zone between $3.24 – $3.40. Buyers are defending this zone strongly, and price is now forming a higher low on the 4H timeframe, signaling potential upside continuation.
🔍 Technical Breakdown:
Demand Zone (Support): $3.24 – $3.40 (Highlighted in orange)
Current Price: $3.48 (Trading slightly above demand zone, showing bullish structure)
First Resistance (TP1): $3.7702 (prior support turned resistance)
Final Target (TP2): $4.1498 – $4.22 (major supply zone with historical selling pressure)
✅ Bullish Confluences:
Price formed double bottom at the demand zone
Bullish candle structure building up
Visible volume cluster supports bounce (LuxAlgo VRVP)
Clear upside imbalance toward $4.22
📌 Trade Setup:
If price continues to hold above $3.40 and breaks recent highs:
Entry: $3.45 – $3.50 (current breakout range)
SL: Below $3.24 (beneath the demand zone)
TP1: $3.7702
TP2: $4.1498
TP3 (extended target): $4.2207
🧠 Notes:
Watch for breakout above $3.55 for stronger momentum confirmation
Scaling out partially at $3.77 is wise due to previous resistance
Supply zone at $4.22 is a critical decision point
🟢 Bias: Bullish until $3.24 is broken
SUI | Sui Network - Swing Long Idea - Altcoin
📊 Market Sentiment
Market sentiment remains bullish, supported by expectations of a 0.25% rate cut at the upcoming FOMC meeting. The weakening USD and rising risk appetite across global markets are favoring crypto assets in particular.
📈 Technical Analysis
SUI recently gained bullish momentum, largely following Bitcoin's strength.
We’re now seeing a healthy retracement, which is expected after a strong move.
The break of the LTF bullish trendline suggests potential for a deeper pullback toward HTF confluence zones.
📌 Game Plan
I'm eyeing the HTF demand zone around $3.06, which aligns with the 0.5 Fibonacci retracement—a key discount zone.
Just below this, we also have a higher time frame bullish trendline, which could offer dynamic support.
These overlapping levels provide a strong confluence for a swing long idea.
🎯 Setup Trigger
I’ll wait for a 4H bullish break of structure and the formation of an LTF demand zone before entering.
📋 Trade Management
Stoploss: Below 4H demand swing low
Target: Up to $4.44
I’ll trail my stop to lock in profits aggressively along the way.
💬 Like, follow, and comment if this breakdown supports your trading!
More setups and market insights coming soon — stay connected!

SUI/USDT: Prime Long Setup from LSOB Demand & Daily OversoldHello traders,
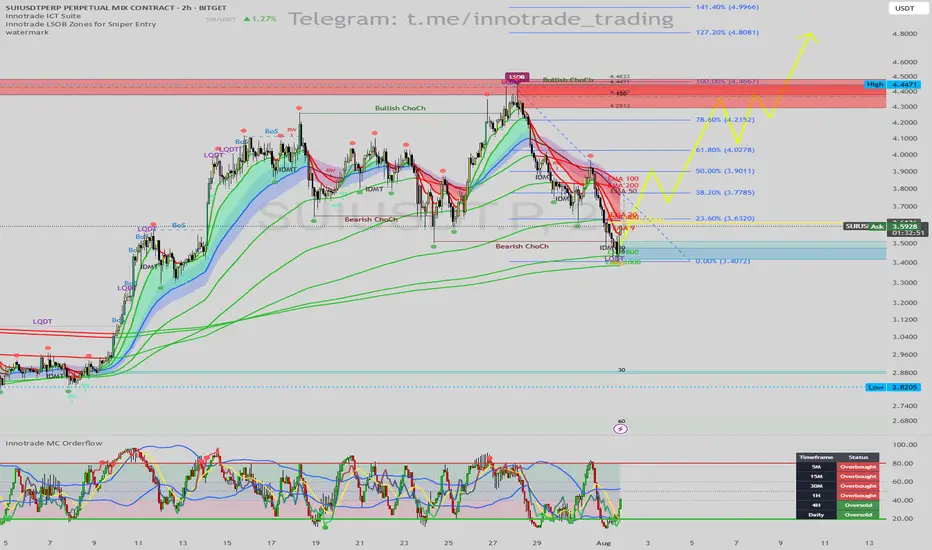
This analysis highlights a high-probability long setup on SUI/USDT (2H Chart). The current price action presents a classic institutional-style reversal pattern, strongly confirmed by momentum indicators signaling a bottom may be in.
1. Trend & Context (The "Why")
While the short-term trend has been corrective after a "Bearish ChoCh," price has now entered a major area of interest where a powerful bullish move could originate.
Here is the confluence checklist:
Primary Signal (LSOB Zone): Price has tapped into a key Bullish LSOB (Liquidity Sweep Order Block). This is a critical demand zone where smart money is likely to absorb selling pressure and initiate long positions.
Liquidity Sweep Confirmation: The price action confirms this with a clear Liquidity Sweep (LQDT), where the price wicked down to take out stops below the previous lows before reversing. This is a very strong bullish signal.
Momentum Exhaustion (MC Orderflow): This is where the setup gains its highest conviction:
The MC Orderflow oscillator is in the EXTREME OVERSOLD territory, indicating that sellers are exhausted.
CRITICAL MTF CONFLUENCE: The Multi-Timeframe Cycle Table is showing that both the 4H and Daily timeframes are "Oversold." This alignment of higher timeframe momentum with our 2H demand zone is the most powerful confirmation for this trade.
2. Entry, Stop Loss, and Targets (The "How")
This confluence provides a clear and structured trade plan with excellent risk-to-reward potential.
Entry: An entry around the current price ($3.50 - $3.58) is ideal, as we are in the LSOB demand zone. For a more conservative entry, one could wait for the 2H candle to close bullishly.
Stop Loss (SL): $3.38. This places the stop loss just below the low of the liquidity sweep wick. If this level is broken, the bullish setup is invalidated.
Take Profit (TP) Targets:
TP1: $3.90 (Targeting the cluster of short-term EMAs and the recent swing high).
TP2: $4.28 (The next major structural resistance).
TP3: $4.45 (The major swing high, which is also a Bearish LSOB supply zone).
Conclusion
This trade presents a superb opportunity due to the powerful combination of a price-action sweep into a key demand zone (LSOB), confirmed by severe multi-timeframe momentum exhaustion. This alignment across indicators points towards a high-probability bullish reversal.
Disclaimer: This is not financial advice. This analysis is for educational purposes only. Always conduct your own research and manage your risk appropriately.
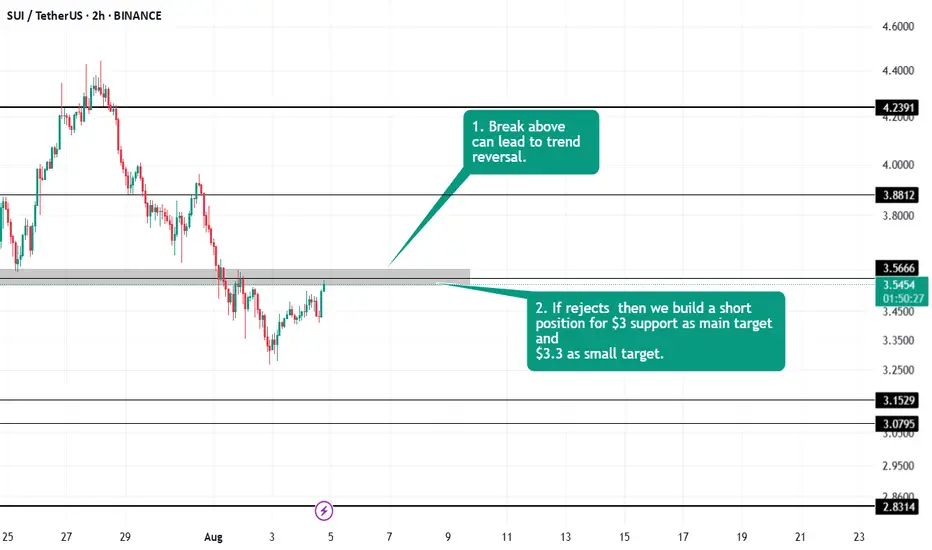
SUI/USDT Update – Bounce Setup from Demand Zone?In the previous analysis, we highlighted a short opportunity near $4.20, which played out perfectly. Now, SUI has reached a key demand zone around $3.40–$3.55, overlapping with the lower boundary of the ascending channel and a previously defined bullish order block.
🔹 Market Structure:
After breaking the bullish structure, price is now revisiting a major liquidity zone between $3.40 and $3.55.
🔹 Price Behavior:
Wicks to the downside suggest buy-side absorption and potential for short-term reversal.
🔹 Possible Scenario:
If the $3.40 zone holds, we could see a corrective move up to the supply zone around $3.90–$4.00.
📌 Key Levels:
• Support: $3.40–$3.55
• Resistance: $3.90–$4.00
❗️If the $3.40 support fails, bullish momentum will likely be invalidated in the short term.
🧠 Pro Tip (SMC-based):
When a demand zone aligns with liquidity sweep and channel support, it often becomes a high-probability area for institutional re-entries. Wait for a clear confirmation like BOS or bullish engulfing candle before entering.
⸻
🔗 Like, share, and follow for more Smart Money & Elliott Wave-based insights!
SUI Bullish Breakout Confirmed- $8 Target In sight! Hey everyone,
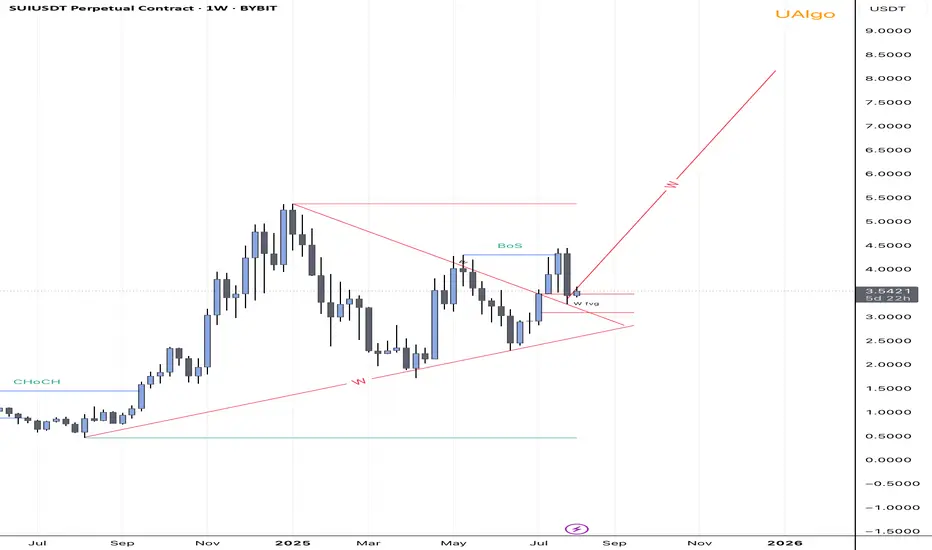
Today marks an important moment for SUI. We’ve just witnessed a clean breakout from a long-term symmetrical triangle on the weekly timeframe, supported by a confirmed Break of Structure (BoS) and a weekly Fair Value Gap (FVG) acting as strong support.
Price respected the FVG zone and bounced, showing clear bullish intent. With strong structure forming and momentum building, I’m targeting the $8 region as the next major level of interest. Market structure is bullish, and the confluence of trendline support, FVG, and the breakout gives me confidence in this move.
Key Highlights:
• Weekly CHoCH followed by BoS 🚀
• Price broke out of triangle and retested FVG🚀
• Bullish continuation structure (W formation)🚀
• Targeting $5.5 → $8 range if momentum holds🚀
SUI 4H – Rejected From Resistance, But Fib Golden Pocket NearSUI just cleanly rejected from a major supply zone near $4.40 — now pulling back into a deep retracement zone that’s historically acted as support.
The 0.5–0.786 Fibonacci levels align perfectly with a previous structure zone, making this a key area for potential bounce setups.
🔹 0.5 = $3.09
🔹 0.618 = $2.77
🔹 0.786 = $2.31
Momentum indicators like Stoch RSI are also rotating downward, suggesting room for a full reset.
⚠️ If buyers step in at the golden pocket, expect volatility. If not — we could revisit May’s lows.

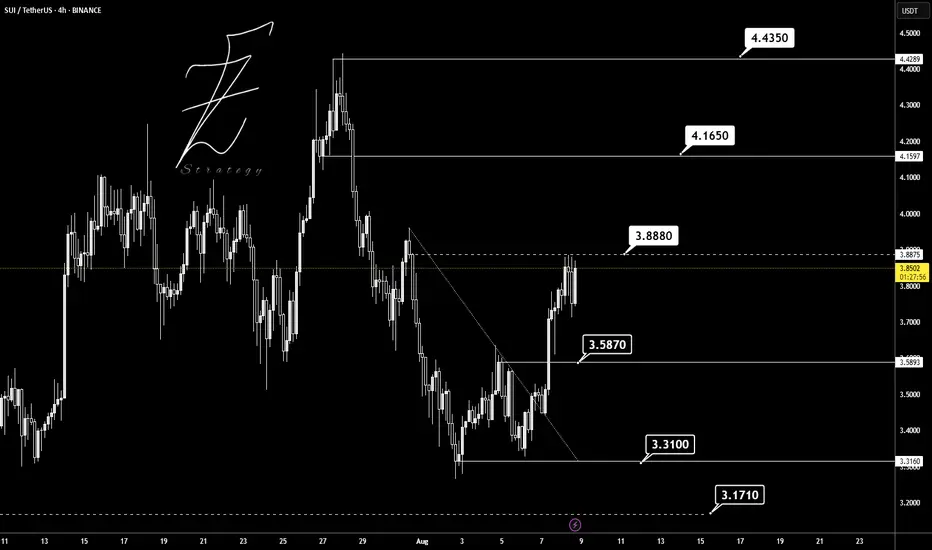
SUIUSDTI think will be bullish BINANCE:SUIUSDT if breaks above 3.88 $ and reach to 4.16 and 4.43 as the next target.
Supports: 3.58 - 3.31 - 3.17
Resistance: 3.88 - 4.16 - 4.43
Please control risk management ⚠️
SUI 1H – Trendline Break Confirmed, But Will 3.66 Hold Support?SUI broke above its descending trendline with strong momentum, confirmed by an EMA cross and clean breakout retest. Price pushed into the 3.75–3.80 range before pulling back toward the 3.66 support area.
If buyers hold this zone, the breakout structure remains intact and could fuel another leg higher. However, a break back below 3.66 would weaken the bullish bias and put the EMAs back under pressure.
Key watchpoints:
– Trendline break + EMA cross as bullish confluence
– 3.66 as immediate support
– Stoch RSI oversold, suggesting possible bounce potential

$suilong this bubba
weekly close might sweep liquidity so keeping some for there
targeting ATH
shall post HTF chart

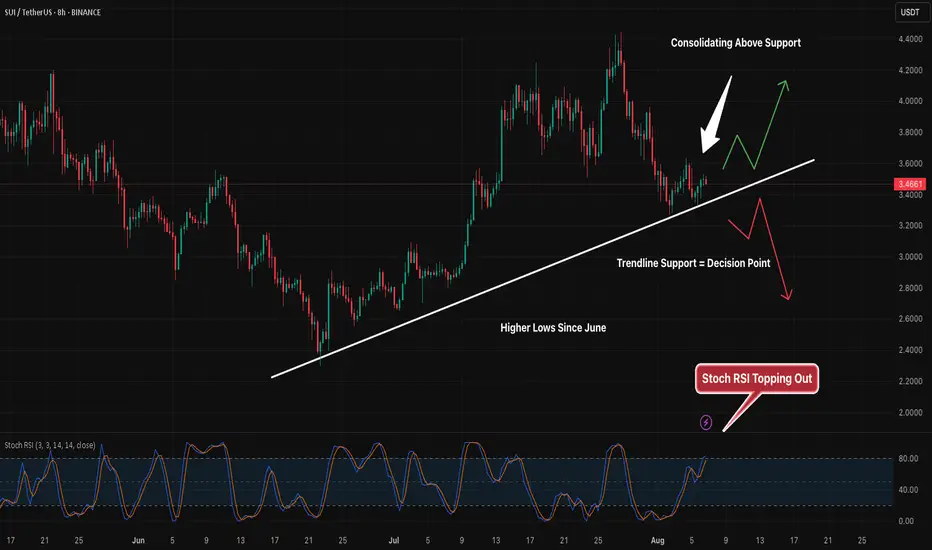
SUI 8H – Compression at Trendline, But Which Side Snaps 1st?SUI has been climbing a steady series of higher lows since mid-June — respecting this ascending trendline cleanly through every corrective phase. Now, price is pressing right into that same support again, but this time with bearish momentum behind it.
What makes this different?
Stoch RSI is topping out — suggesting we’re nearing short-term exhaustion
Recent candles are hugging the trendline, not bouncing off it with strength
Volume is low, structure is tight — this is where big moves are born
We’re compressing into the apex of this rising support line. If SUI holds and breaks north, the upside target sits above $4, retesting recent swing highs. If this trendline gives out, however, the next clean support is around the psychological $3.00 level — right in the middle of July’s accumulation range.