SUIUST trade ideas

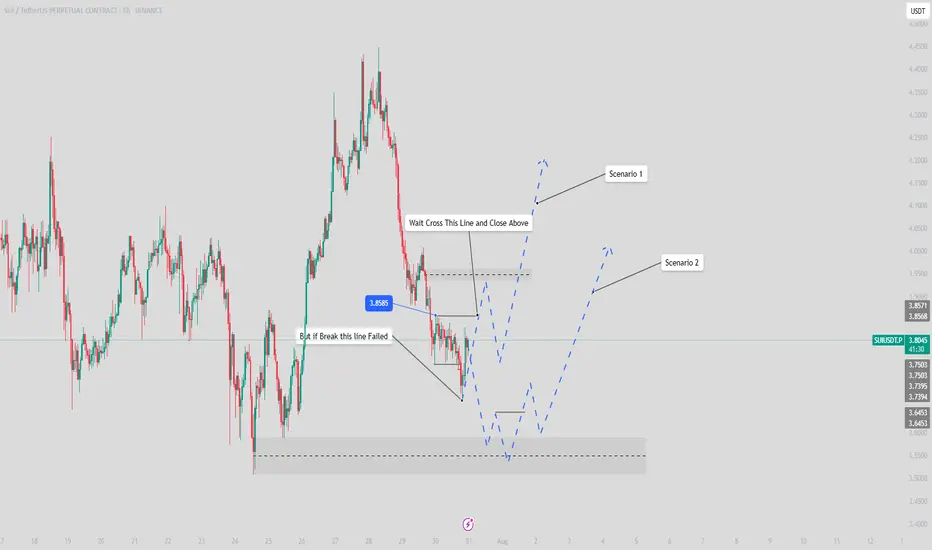
Last trade Explanation $SUITrade Setup: Liquidity Sweep / Manipulation Entry
Pair: SUI/USDT
Timeframe: 15-Minutes
Platform: Binance
Chart Type: Candlestick
Trade Concept
This trade is based on a liquidity sweep/manipulation trap, where the price fakes a breakdown below a key support to trap sellers before reversing.
Entry Rules
Identify Liquidity Zone:
Mark key support levels where multiple lows have formed (acting as liquidity pool).
Wait for a clear sweep below this level (price makes a lower low, triggering stop losses/sell orders).
Wait for Confirmation:
Do not enter on the sweep candle.
Wait for the next candle to close back above the broken support, confirming the reclaim.
Entry Point:
Enter after reclaim of the support (confirmation candle).
This confirms the seller’s trap/manipulation.
Stop Loss & Target
Stop Loss: Just below the sweep wick (to protect against actual breakdown).
Take Profit: Based on structure or previous resistance zones.
In this chart, a strong impulse followed the reclaim, allowing for a favorable risk-to-reward ratio.
Remarks
Risk Management: Only enter after confirmation to avoid false breakouts.
Psychological Note: This setup works on exploiting retail stop hunts and institutional reclaims.

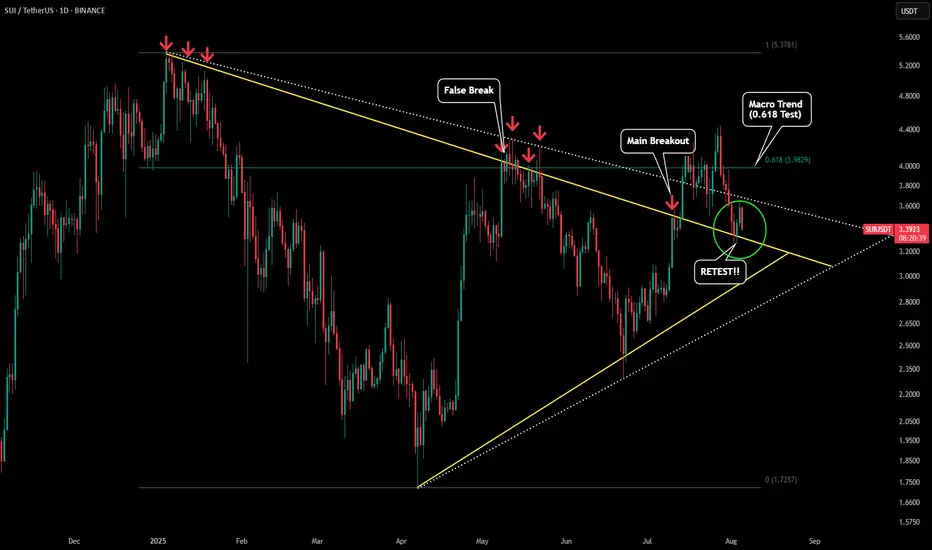
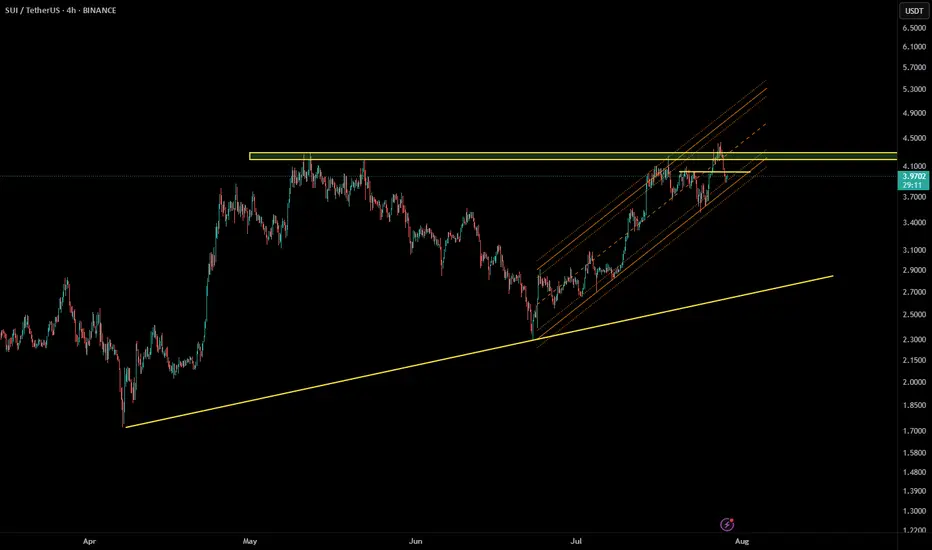
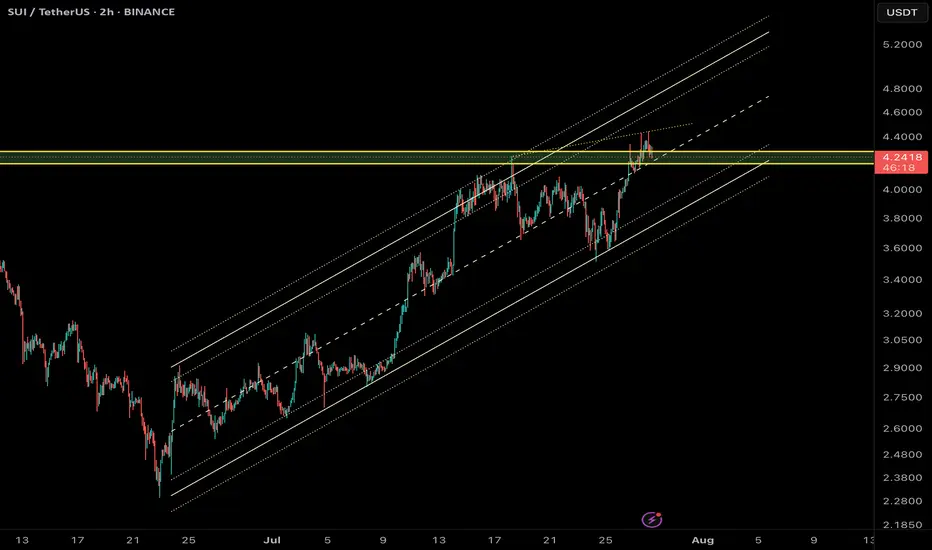
SUI - Retest in ProgressPlease refer to our previous post:
What we stated in this post from over three weeks ago was "If we get a retest and hold of that yellow trendline that will be the confirmation we need for a full blown breakout for SUI."
Current day we just got that retest! As you can see (green circle) both daily candles held the body above the yellow line giving us our first confirmation of a successful retest. If this retest remains successful we should see a continued move to around $5.50.
However due to BTC's current state we cant rule out the bearish scenario. If BTC starts to close below $112k then most likely SUI will fall below our triangle pattern. If SUI falls below and starts closing below the yellow line that would signal a false break. At the moment this is the less likely scenario given the market structure built, but something to watch closely.
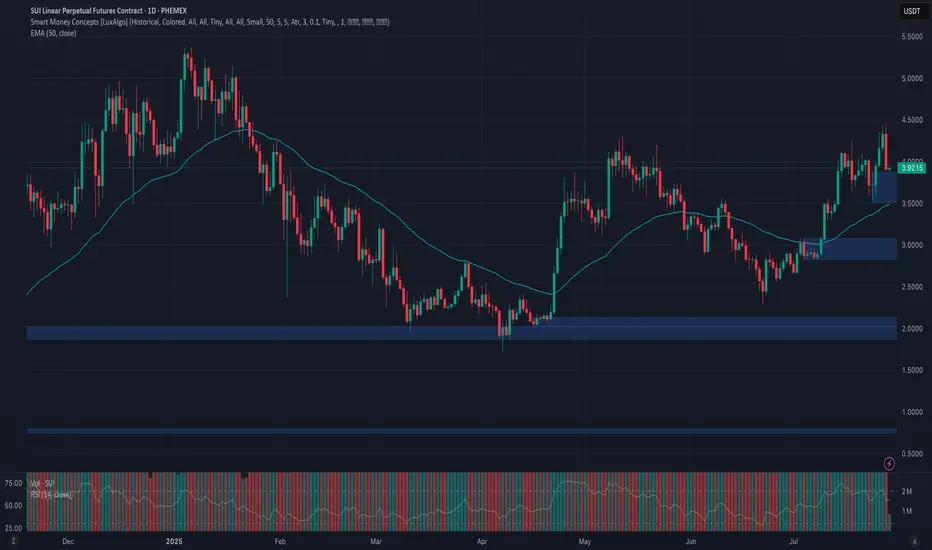
Phemex Analysis #100: Pro Tips for Trading Sui (SUI)Sui ( PHEMEX:SUIUSDT.P ) has swiftly emerged as one of the most promising Layer 1 blockchains, well-known for its focus on scalability, high throughput, and developer-friendly infrastructure. Recently, Sui has attracted significant attention thanks to its growing DeFi ecosystem, strategic partnerships, and community enthusiasm.
Over the past 2 weeks, SUI showed robust bullish activity, rising more than 30% to break key resistance around $4.3, and it’s now trading at around $3.9. The current price action indicates a potential continuation of bullish momentum, yet traders remain cautious about possible retracements and volatility.
Let’s carefully examine a few likely scenarios for SUI and determine how traders can capitalize strategically.
Possible Scenarios
1. Short-term Retracement (Healthy Pullback)
Following the recent rapid price rise, SUI might experience a short-term correction toward previous resistance-turned-support near $3.6. A low-volume retracement to this level could represent a healthy pause before the next bullish leg.
Pro Tips:
Buying the Dip: Closely watch support around $3.6; a successful retest on lower volume could present an ideal buying opportunity.
Volume Monitoring: Pay close attention to volume levels during the pullback—a low-volume dip indicates healthy profit-taking rather than bearish reversal.
2. Bullish Breakout (Pushing Higher!)
If SUI maintains bullish momentum and successfully holds above recent support around $3.8, it may continue to target higher resistance levels. Strong buying volume accompanying further gains could send SUI towards key resistance zones around $5.0 and potentially breaking previous all-time-high $5.37.
Pro Tips:
Entry Signals: Consider buying positions on a high-volume breakout confirmation above $4.45, signaling bullish continuation.
Profit Targets: Plan partial profit-taking around $5.0 and $5.37 resistance zones to lock in gains.
3. Bearish Scenario (Deeper Correction)
If broader market sentiment turns negative or if buying volume significantly weakens, SUI could break below $3.6, signaling bearish pressure. In this scenario, deeper corrections towards support levels at $2.8 or potentially $2.3 may occur.
Pro Tips:
Short Opportunities: Experienced traders could consider shorting or reducing exposure if SUI decisively breaks below the key $3.6 support level on increased selling volume.
Accumulation Strategy: Long-term investors can strategically accumulate positions near stronger support zones around $2.8 and $2.3 after confirming price stabilization.
Conclusion
Sui (SUI) currently offers compelling trading opportunities driven by recent bullish activity and increasing ecosystem growth. Traders should stay alert for critical breakout levels ($4.45) and monitor essential support areas ($3.6) closely. By applying disciplined trading approaches, setting clear profit targets, and managing risk prudently, traders can navigate SUI’s volatility with greater confidence and potentially maximize gains.
🔥 Tips:
Armed Your Trading Arsenal with advanced tools like multiple watchlists, basket orders, and real-time strategy adjustments at Phemex. Our USDT-based scaled orders give you precise control over your risk, while iceberg orders provide stealthy execution.
Disclaimer: This is NOT financial or investment advice. Please conduct your own research (DYOR). Phemex is not responsible, directly or indirectly, for any damage or loss incurred or claimed to be caused by or in association with the use of or reliance on any content, goods, or services mentioned in this article.
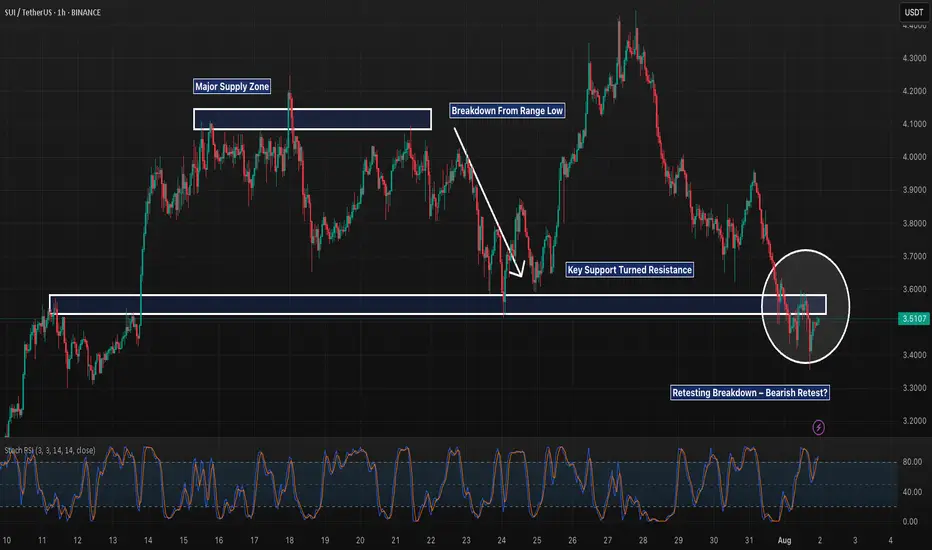
SUI 1H – Breakdown & Retest of Key Support, But Will It Reject?SUI 1H – Breakdown & Retest of Key Support, But Will It Reject or Reclaim?
Description:
SUI just completed a textbook range breakdown after weeks of sideways chop between ~$3.60–$4.10. The prior support floor has now flipped into resistance, and the recent bounce appears to be retesting that structure. If this retest gets rejected, continuation toward lower support zones (potentially $3.30 and below) becomes likely.
However, reclaiming and holding above $3.60 could trap late shorts and fuel a squeeze. Structure still favors bears for now, but it’s decision time.
📌 Breakdown structure
📌 Bearish retest
📌 Eyes on confirmation or invalidation
This is the battle zone — stay sharp.
SUI | Spot Buy Zone for PullbackPrice has pulled back after a local top and is heading toward a clear demand zone.
Key buy area sits around $3.12, aligned with 0.618 retracement and recent consolidation.
Strong structure below—if majors keep retracing, this is where risk/reward for new spot buys becomes attractive.
Plan:
Waiting for price to reach the green zone to accumulate spot.
Invalidation below $2.80, targeting a move back toward $4.45 and higher if momentum returns.

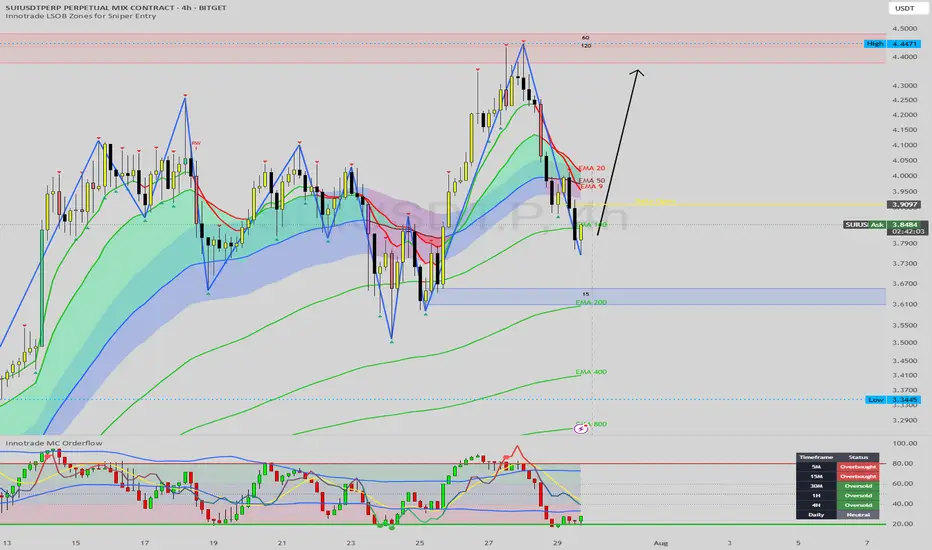
SUI Approaching Major Buy Zone: A High-Confluence Long SetupHello, traders. Today, we're putting SUI under the microscope as it undergoes a sharp but healthy correction following an impressive rally. The price has recently broken below its short-term moving averages, and is now heading directly towards a powerful cluster of technical support. This is a classic "buy the dip" scenario unfolding.
This analysis will provide a step-by-step breakdown of why the $3.60 - $3.70 zone represents a high-probability area for this corrective move to end, and for the primary bullish trend to resume.
The Analysis: A Convergence of Powerful Signals
The strongest trade ideas are not based on one signal, but on multiple, independent factors aligning. Here is the powerful confluence we are observing on the SUI 4H chart:
1. The Primary Bullish Structure:
First, let's establish the market context. The Zig-Zag indicator confirms that the primary market structure is firmly bullish, with a clear series of higher highs and higher lows. The current move is a textbook corrective pullback within this uptrend. Our goal is not to fight the trend but to identify the most logical point for it to continue.
2. The Key Support Cluster (Order Block + EMA 200):
The price is approaching a major floor of support. This floor is composed of two critical elements:
Demand Zone / Order Block: There is a significant demand zone (the blue-shaded box) sitting between $3.60 and $3.70. This is an area where strong buying pressure previously entered the market, and it's likely to act as a solid support level.
The EMA 200: Flowing directly through this demand zone is the EMA 200. This long-term moving average is one of the most significant dynamic support levels in an uptrend. The confluence of a static order block with the powerful EMA 200 creates an incredibly strong support cluster.
3. Multi-Timeframe Momentum Exhaustion (The Key Timing Signal):
This is the crucial timing component. While the price is dropping, our momentum dashboard reveals that sellers are becoming exhausted.
MC Orderflow: The oscillator in the sub-chart is plunging towards the green "Oversold" area, signaling that the downward momentum is getting stretched.
The Dashboard: This gives us a panoramic view of momentum. The 30M, 1H, and 4H timeframes are all simultaneously flashing "Oversold". This is a critical piece of information. It tells us that selling pressure is exhausted across multiple key timeframes, precisely as the price is about to hit a major support cluster. This is a classic recipe for a sharp reversal.
The Potential Trade Plan
Based on this powerful alignment of signals, here is a potential trade plan:
Entry Zone: The support cluster between $3.60 and $3.70 is the ideal zone to look for entries.
Stop Loss: A logical stop loss could be placed just below the demand zone and the EMA 200, around $3.55. A break below this level would invalidate the bullish structure.
Potential Targets:
Target 1: A reclaim of the Daily Open at $3.91.
Target 2: The intermediate resistance and recent swing high in the $4.15 - $4.25 area.
Target 3: A full retest of the major high at $4.45.
Conclusion
We are witnessing a textbook technical setup on SUI. The price is correcting within a confirmed uptrend and is now approaching a massive confluence of support (Order Block + EMA 200), all while multi-timeframe momentum indicators are signaling widespread seller exhaustion. This presents a compelling, high-probability case for a long position.
Disclaimer:
This analysis is for educational purposes only and is not financial advice. Trading cryptocurrencies involves a high level of risk. Always conduct your own research and consult with a licensed financial advisor before making any trading decisions.
Sui (SUI): Looking For Breakout | Potential Move To $5.40!SUI is still hovering near our local resistance line, where since last time we had one breakout but failed one, which led the price back to EMAs, where we bounced off from.
We still see upside potential here so if we get another breakout attempt, most likely it will be the last one, before going for the $5.40 zone.
Swallow Academy

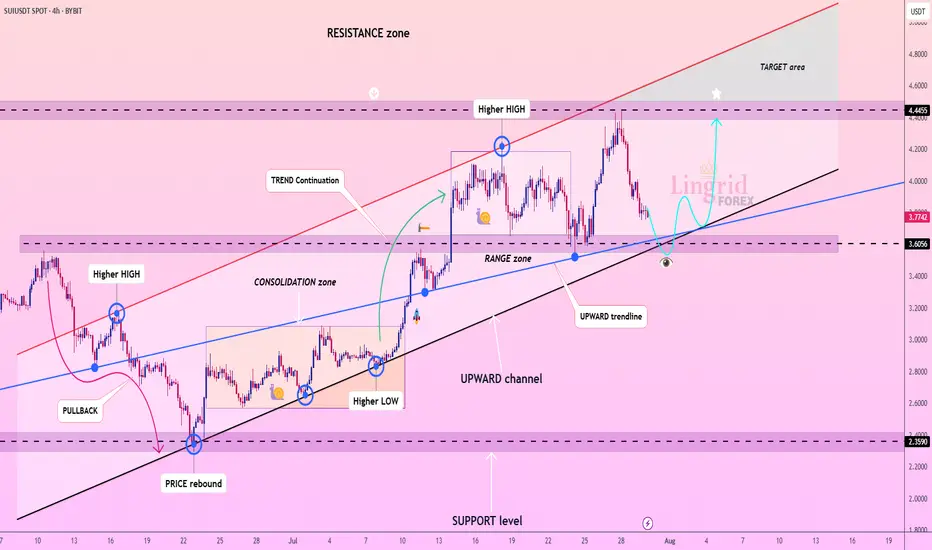
Lingrid | SUIUSDT Approaching Key Level for Potential LongBINANCE:SUIUSDT has pulled back from the 4.44 resistance but remains within a well-defined upward channel, holding above the 3.60 support zone. The structure shows higher lows with price hovering around the blue upward trendline, indicating ongoing bullish momentum. As long as 3.60 holds, buyers may regain control and push price back toward the 4.44 resistance and beyond. Momentum favors continuation as the consolidation phase near support suggests accumulation.
📉 Key Levels
Buy trigger: Break and close above 3.85
Buy zone: 3.60–3.70
Target: 4.44
Invalidation: Drop below 3.26
💡 Risks
Failure to hold above 3.26 could trigger deeper pullback.
Resistance near 4.44 may cause rejection.
Low market volume could delay breakout attempts.
If this idea resonates with you or you have your own opinion, traders, hit the comments. I’m excited to read your thoughts!
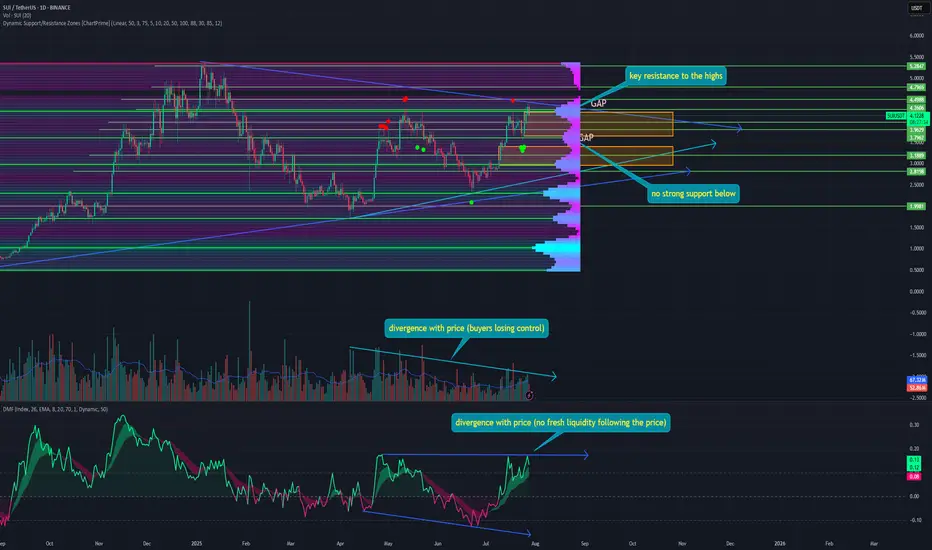
SUI is currently the most overvalued token, and here's whyOne of the main beneficiaries of the cycle is once again close to its highs. However, it does not appear that the token is ready to update them, and here's why:
➡️ The first thing that catches the eye is the divergence in purchase volumes. The higher the growth, the lower the purchase volumes, which signals a depletion of purchasing power as growth continues. This could soon lead to bears taking control.
🔹 Second, this is why even a minor takeover by the bears could be critical. As can be seen from the dynamic support and resistance levels, there are no strong support levels in the immediate range. They only start at $2.29. Meanwhile, right now, the token has hit resistance at $4.25.
🔹 Third, two gaps have formed at the bottom at the levels of $4.20 - $3.64 and $3.39 - $2.95. And as we know, 99% of gaps close sooner or later, pulling the price with them.
🔹 Fourth, the Money Flow indicator also shows divergence with the price. The current high is higher than in May 2025, but the amount of liquidity is the same. So there are not more buyers, just fewer sellers, at least for now.
But with each decline, liquidity is increasingly leaving the token, forming new lows on the indicator.
📌 What is the result?
SUI is currently moving upward purely in line with the overall market movement. But the structure looks very fragile, and when the correction in BTC and, in particular, ETH begins, SUI will be one of the first to fall.
So, I am only considering shorts in the token right now; longs will become attractive no earlier than at the $2.28 level of the market structure.
🔥 Subscribe so you don't miss out on the latest market analysis!
SUI/USDT Update – Bearish Structure Confirmed📉 SUI/USDT Update – Bearish Structure Confirmed
Yesterday, we shared a bearish outlook for SUI from the $4.2 region, anticipating a potential rejection from that key supply zone. Since then, price has respected the resistance and shown early signs of weakness.
Here’s what we’re seeing now:
🔹 Elliott Wave Perspective
Price seems to be completing a Wave C of a larger Zigzag structure.
This upward move is forming an Ending Diagonal (ED)—a terminal pattern usually marking exhaustion.
The diagonal is weakening near the top of a multi-month resistance, adding confluence to the bearish setup.
A break below the lower channel could trigger a deeper correction toward:
$3.35 (first support)
$3.00 (major structural demand)
🔸 ICT / Smart Money Outlook
Price swept the liquidity above previous highs (~$4.2), creating a buy-side liquidity grab.
A Bearish Order Block is active around $4.05–$4.15.
📊 Analysis by @CryptoPilotAI
🔔 Follow for more smart market updates.
Signs of a Market Structure Shift are emerging as lower highs begin forming.
Watch for price to revisit the Fair Value Gap (FVG) near $3.65–$3.35, a likely target for rebalancing inefficiency.
✅ Conclusion
Unless bulls reclaim $4.15 with strength, this looks like a distribution phase with downside continuation expected.
📌 Short Bias Active – Waiting for channel break and confirmation.
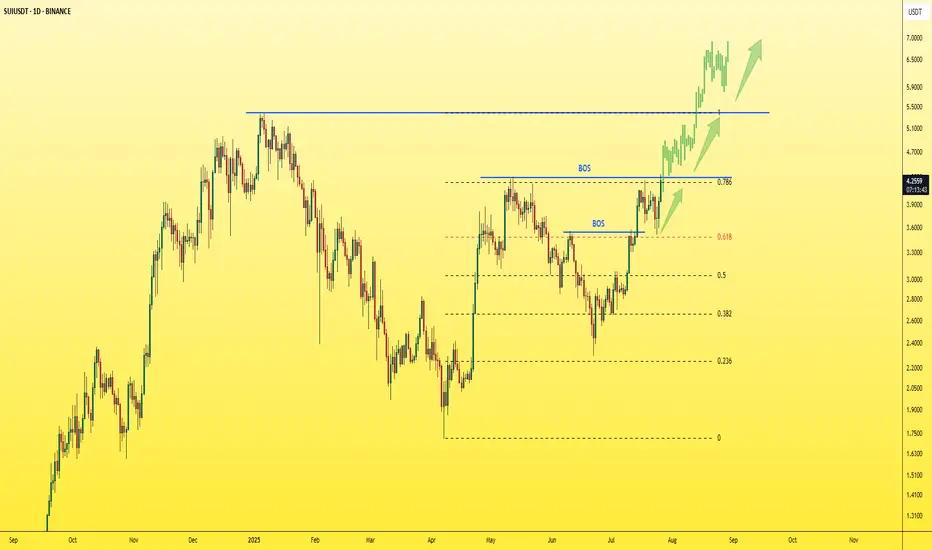
SUI - Just one step away from the explosion!The last candle on the daily chart just confirmed a BOS (Break of Structure) — a clear and strong sign of bullish continuation for the asset.
✅ This is a textbook entry for a long position.
🎯 Next target: $5 — and so far, no bearish signs in sight.
Best regards,
Ceciliones 🎯
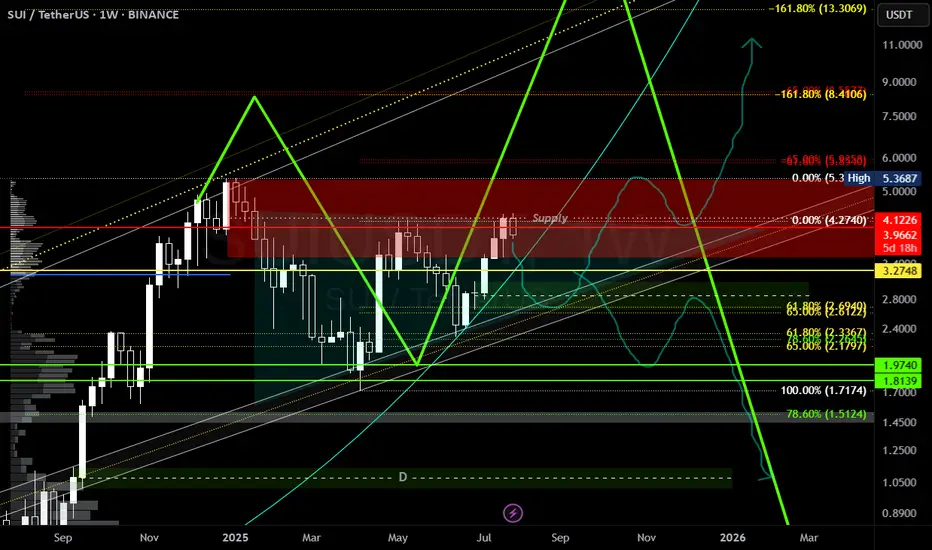
#SUI HTF Update Major update on #SUI after 6 months or so...
We have been tracking this idea since 2024, i am still biased with entire market & not looking at 2026 for ONE MORE run up, we just have few months left now & with august coming up i believe we will see one final dip before blasting everything in September. Majors topping around September & other alts like sui probably in October.
I have already updated about my positions before do check if you haven't yet.
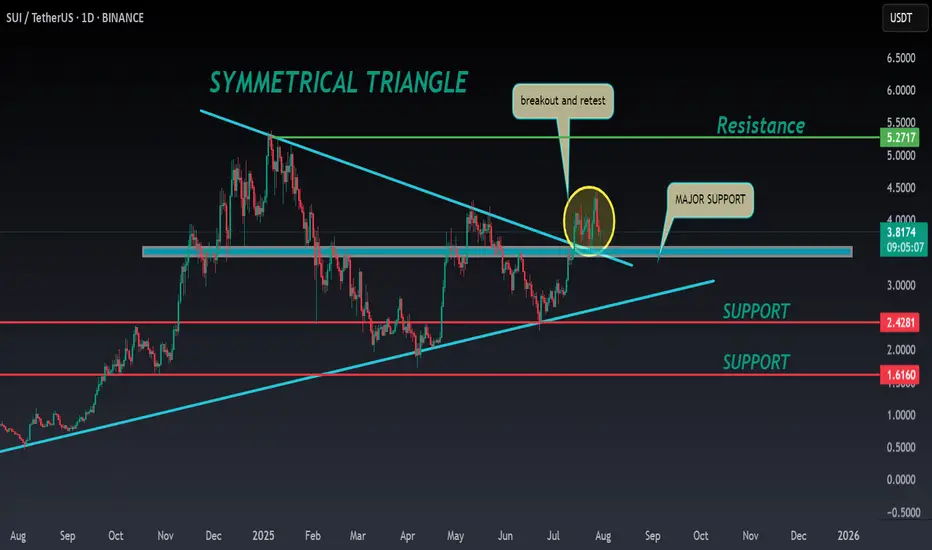
SUI ANALYSIS🔮#SUI Analysis 💰💰
#SUI is trading in a symmetrical triangle in a weekly time frame and if it breakouts with high volume then we can see a bullish momentum in #SUI. Before that we will see little bit bearish movement towards its support zone and that a bullish movement.
🔖 Current Price: $3.81
⏳ Target Price: $5.27
⁉️ What to do?
- We can trade according to the chart and make some profits in #SUI. Keep your eyes on the chart, observe trading volume and stay accustom to market moves.💲💲
🏷Remember, the crypto market is dynamic in nature and changes rapidly, so always use stop loss and take proper knowledge before investments.
#SUI #Cryptocurrency #Pump #DYOR
#SUI Update #2 – July 31, 2025#SUI Update #2 – July 31, 2025
SUI has completed the correction of its last impulsive move and has started another upward movement. Although it currently appears to be a weak move, I believe it will provide around a 10% profit. As shown in the chart, I have opened a long position.

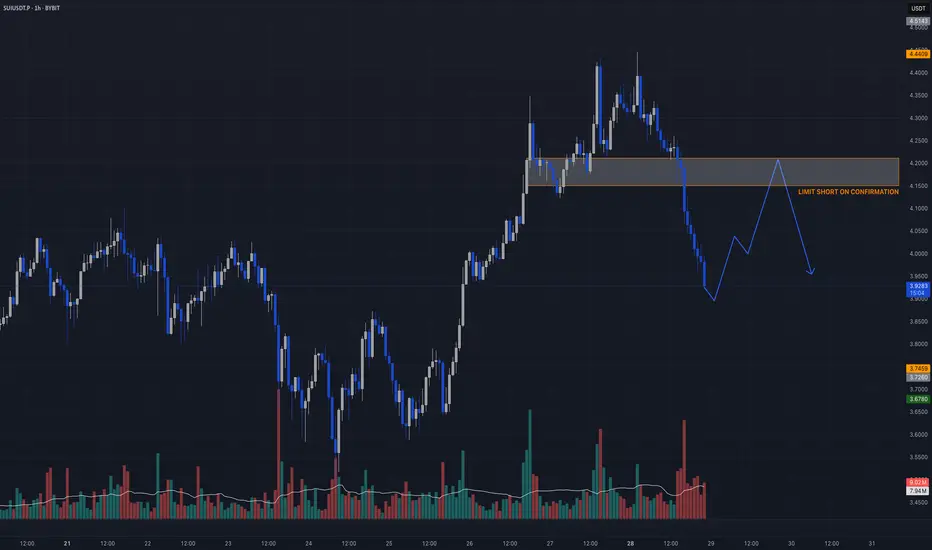
$SUIUSDT.P – INTRADAY SHORT IDEAAfter the impulsive sell-off, we’re eyeing a short entry on a potential rally into the FVG + prior support zone between $4.10–$4.20. No need to chase — let price return to our level of interest and confirm weakness.
🎯 Direction: Short
📍 Entry Zone: $4.15–$4.20
🩸 Stop Loss: $4.50
💸 Take Profits:
TP1: $3.20
TP2: $2.80
🧠 Setup Logic:
– Price broke down impulsively, leaving inefficiency behind
– $4.10–$4.20 = prior support + fair value gap
– Watching for M5–M15 CHoCH/BOS on retest
– Funding spike on bounce = ideal short trigger
This is not a blind short — wait for structure shift confirmation on the LTFs.
Candle Craft | Signal. Structure. Execution.
Sui short 3.7 or lowerjust hopped into a sui short
sl: $3.8452
tp area: $3.7043 and lower
Anticipating an impulsive push down tonight before spike back up

SUI Hits Key Liquidity Zone After – Correction Ahead?SUI has been climbing steadily inside a well-structured ascending channel for the past few weeks. The recent breakout above the $4.30 resistance zone – which was a key liquidity level – seems to have swept stop-losses and trapped late buyers.
🔎 Here's what we're watching:
- Price broke out of the ascending channel briefly and rejected from the upper parallel.
- The breakout above $4.30 was likely a liquidity grab (buy-side liquidity taken).
- Price is now pulling back, showing signs of distribution below resistance.
📉 Expecting a correction toward the lower channel line as price seeks rebalancing.
🧠 Strategy Notes:
- No reason to long here unless price reclaims $4.35 with volume.
- Ideal buy zone is near the midline or lower channel.
- A break below the channel could signal deeper correction toward $3.60 or lower.
📊 Always respect risk – don’t chase after price in these zones.
📡 Analysis by CryptoPilot – navigating the market with precision.
#CryptoPilot #SUI #SmartMoney #LiquidityGrab #CryptoTrading #TrendChannel #Altcoins
SUI 8H – Liquidity Tracker Signals a Third Major Leg Higher?The MACD Liquidity Tracker Strategy continues to deliver precise trend entries and exits on SUI, with another textbook setup potentially forming. The system has already caught two clean long cycles since April — each triggered after MACD histogram reversal and confirmed trend structure.
What stands out is how well the system avoids chop: during the magenta (bear-biased) zone from May to early July, no long entries were triggered despite volatile bounces. This highlights the strategy’s strength — it filters noise and only fires when true momentum aligns with structural breakout zones.
We're now in what could be the early stages of a third bullish cycle. The latest long entry (circled) followed a deep reset in both price and MACD, similar to April and July before the last rallies. Price has now cleared its EMA filter and is attempting to hold above $3.80–4.00.
MACD histogram shows early signs of momentum rebuilding, and if price holds this level, there’s potential for continuation toward $4.80+. If momentum fades here, a retest of $3.50 remains possible before any further upside.
📊 Strategy Settings Used:
– MACD: 25 / 60 / 220
– EMA Filters: 50 & 9 (Normal Mode)
– Entry Logic: MACD momentum + trend alignment
– Visual Bias: Blue = Bullish, Magenta = Bearish
⚠️ Key to this system is patience — waiting for full signal alignment instead of anticipating. So far, this strategy has rewarded discipline with high-conviction moves.

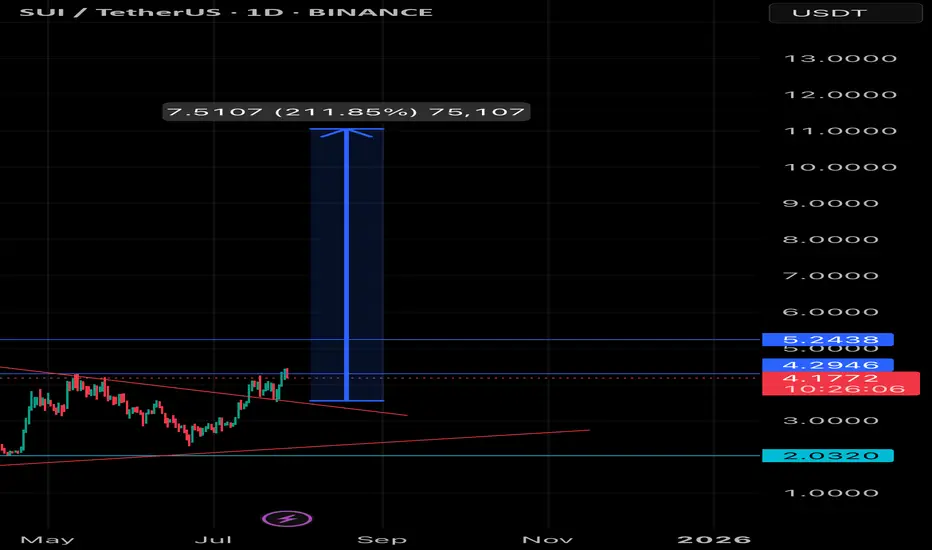
SUI/USDT – Ready for a Major Breakout (211% Potential🚀 SUI/USDT – Ready for a Major Breakout (211% Potential)
🔍 Analysis:
SUI is testing the upper resistance of a long-term symmetrical triangle.
• Price broke above descending trendline
• Strong bullish momentum and volume
• Next resistance zone: $4.29 – $5.24
• Measured move suggests a target near $12
Trade Setup:
• Entry: $3.54-$4
• Stop-Loss: $3.45 (below structure)
• Target: $7.50–$12 (based on pattern projection)
Conclusion:
This breakout could lead to a 211% rally if confirmed. Watching for continuation above $5.25.
📌 Bias: Strongly Bullish ✅
#SUIUSDT #CryptoBreakout #Altcoins #TechnicalAnalysis #SUI
SUI to $5.31? Chart Says It’s 22% Away!SUI is shaping up beautifully on the daily chart. After spending weeks in a consolidation zone, the price has finally broken out with strong momentum and reclaimed bullish territory. The CM_EMA TrendBars are showing green, which confirms a positive directional shift. This indicates the bulls are now back in control.
The most recent breakout has pushed SUI above a key structure level near $3.93, turning previous resistance into new support. What’s impressive is that price didn’t just break this level — it retested it and bounced sharply, suggesting strong buyer interest. This kind of price action is typically seen before continuation moves.
Currently, the setup shows a clean bullish structure. Price is holding firmly above the moving average and is supported by recent higher highs and higher lows. If this momentum continues, SUI could be on its way toward the next major resistance zones, clearly marked on your chart as Profit Target 1 ($5.014) and Profit Target 2 ($5.312).
Volume seems steady, not explosive, but enough to support a sustainable climb — which is ideal for swing setups. This gives the chart a healthy look, especially in the context of the wider altcoin recovery theme.
Now, let's talk about risk. The Stop-Loss is logically placed at $3.602, just below the most recent breakout level and the prior base structure. If the price breaks below this zone, it would likely invalidate the current bullish setup.
🎯 Trading Idea Based on Chart Setup:
• Entry: $4.213 (current zone)
• Stop-Loss: $3.602
• TP1: $5.014 — near-term resistance
• TP2: $5.312 — full extension target
• Risk-to-Reward: ~2.36 on TP2 💹
This is a favorable setup for swing traders with clear levels and a clean chart structure. The EMAs are aligned bullishly, and the breakout has followed a strong trend resumption. If the market conditions continue supporting altcoins, SUI has the potential to outperform in the coming weeks.
In summary, SUI is in a confirmed uptrend, riding strong momentum after a clean breakout. As long as price holds above $3.93 and especially above the stop at $3.60, the path of least resistance remains upward.

