SUNUSDT – One Chart, Three Opportunities☀️ In SUN/USDT, three distinct blue box zones stand out. Each offers its own kind of opportunity — but only if you approach them with structure and discipline.
🎯 Here's How to Use Them
📍 Zone 1 → potential for short-term gains
📍 Zone 2 → better suited for medium-term positioning
📍 Zone 3 → promising long-term risk:reward
But don’t place blind orders — instead:
✅ Set alerts for each zone
✅ When price reaches one, switch to 1H chart
✅ Look for an upward breakout
✅ Confirm with positive & rising CDV
If these conditions align, then — and only then — execute a trade.
"The market pays those who are patient and prepared — not those who guess."
Without confirmation, you're trading hope, not setup.
Let’s stay smart. Let’s stay strategic.
UmutTrades 💙
📌I keep my charts clean and simple because I believe clarity leads to better decisions.
📌My approach is built on years of experience and a solid track record. I don’t claim to know it all but I’m confident in my ability to spot high-probability setups.
📌If you would like to learn how to use the heatmap, cumulative volume delta and volume footprint techniques that I use below to determine very accurate demand regions, you can send me a private message. I help anyone who wants it completely free of charge.
🔑I have a long list of my proven technique below:
🎯 ZENUSDT.P: Patience & Profitability | %230 Reaction from the Sniper Entry
🐶 DOGEUSDT.P: Next Move
🎨 RENDERUSDT.P: Opportunity of the Month
💎 ETHUSDT.P: Where to Retrace
🟢 BNBUSDT.P: Potential Surge
📊 BTC Dominance: Reaction Zone
🌊 WAVESUSDT.P: Demand Zone Potential
🟣 UNIUSDT.P: Long-Term Trade
🔵 XRPUSDT.P: Entry Zones
🔗 LINKUSDT.P: Follow The River
📈 BTCUSDT.P: Two Key Demand Zones
🟩 POLUSDT: Bullish Momentum
🌟 PENDLEUSDT.P: Where Opportunity Meets Precision
🔥 BTCUSDT.P: Liquidation of Highly Leveraged Longs
🌊 SOLUSDT.P: SOL's Dip - Your Opportunity
🐸 1000PEPEUSDT.P: Prime Bounce Zone Unlocked
🚀 ETHUSDT.P: Set to Explode - Don't Miss This Game Changer
🤖 IQUSDT: Smart Plan
⚡️ PONDUSDT: A Trade Not Taken Is Better Than a Losing One
💼 STMXUSDT: 2 Buying Areas
🐢 TURBOUSDT: Buy Zones and Buyer Presence
🌍 ICPUSDT.P: Massive Upside Potential | Check the Trade Update For Seeing Results
🟠 IDEXUSDT: Spot Buy Area | %26 Profit if You Trade with MSB
📌 USUALUSDT: Buyers Are Active + %70 Profit in Total
🌟 FORTHUSDT: Sniper Entry +%26 Reaction
🐳 QKCUSDT: Sniper Entry +%57 Reaction
📊 BTC.D: Retest of Key Area Highly Likely
📊 XNOUSDT %80 Reaction with a Simple Blue Box!
📊 BELUSDT Amazing %120 Reaction!
📊 Simple Red Box, Extraordinary Results
📊 TIAUSDT | Still No Buyers—Maintaining a Bearish Outlook
📊 OGNUSDT | One of Today’s Highest Volume Gainers – +32.44%
📊 TRXUSDT - I Do My Thing Again
📊 FLOKIUSDT - +%100 From Blue Box!
📊 SFP/USDT - Perfect Entry %80 Profit!
📊 AAVEUSDT - WE DID IT AGAIN!
I stopped adding to the list because it's kinda tiring to add 5-10 charts in every move but you can check my profile and see that it goes on..
SUNUSDT trade ideas

SUN Bearish DivergenceBINANCE:SUNUSDT
Trade Setup:
Target 1: 0.01978 (0.50 Fibonnaci Golden Zone).
Target 2: 0.01883 (0.618 Fibonnaci Golden Zone).
Target 3: 0.01747 (0.786 Fibonnaci Golden Zone).
Target 4: 0.01574 (1 Fibonnaci).
Stop Loss: 0.02382 (above recent high, ~25% above current price).
RSI Analysis: The RSI shows a bullish divergence (price making lower lows while RSI makes higher lows), suggesting potential upward momentum. Current RSI is around 82.23, nearing overbought territory (>70), so caution is advised.

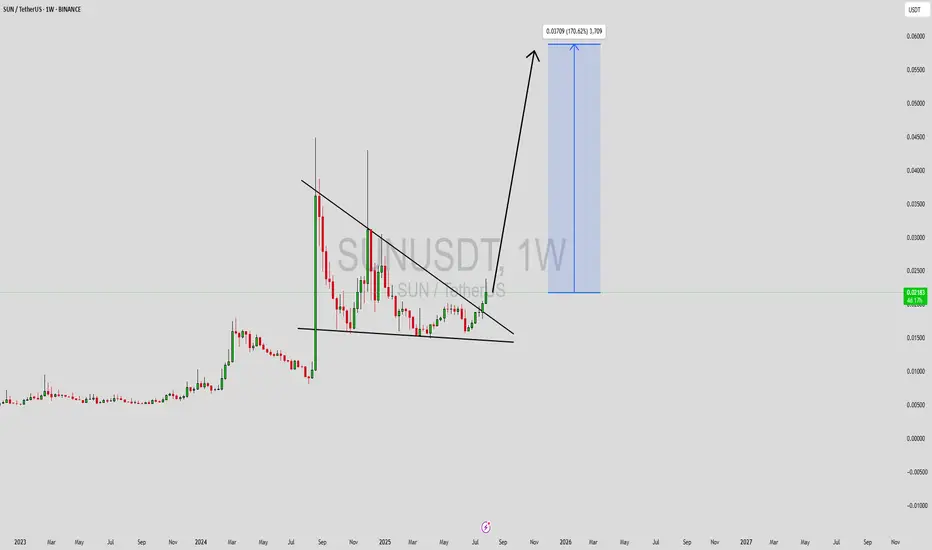
SUNUSDT Forming Potential BreakoutSUNUSDT is currently forming a promising potential breakout pattern that traders and investors should closely watch. The price action has shown a period of consolidation near key support zones, building a strong base for a potential explosive move. With volume gradually increasing and bulls taking control, the pair appears primed to break past resistance levels, signaling the beginning of a new uptrend phase.
The technical structure supports a bullish bias, with the potential to achieve a gain of 140% to 150%+ if the breakout materializes fully. Historical price behavior and recent candle formations suggest that SUNUSDT is gearing up for a rally, especially as it approaches a crucial trendline. If confirmed, this breakout could lead to a parabolic move, driven by renewed market interest and buying pressure.
SUN, being part of the TRON ecosystem, benefits from a solid foundation and increasing usage in DeFi applications. The token has seen growing investor interest, further fueling positive sentiment and long-term potential. The fundamentals are aligning well with the current technical outlook, providing additional confidence to bullish traders eyeing high-reward setups.
Given the momentum and improving market dynamics, SUNUSDT has become a high-potential watchlist candidate for both swing traders and long-term investors. A confirmed breakout above the current range could open the door to significant upside gains.
✅ Show your support by hitting the like button and
✅ Leaving a comment below! (What is You opinion about this Coin)
Your feedback and engagement keep me inspired to share more insightful market analysis with you!
Bearish Head and Shoulders Pattern Confirmed 🚨 NYSE:SUN
Bearish Head and Shoulders Pattern Confirmed 🚨
NYSE:SUN
has formed a bearish head and shoulders pattern and has been rejected from the neckline. The target for this bearish move is the green line level.
📈 Technical Overview:
Pattern: Bearish Head and Shoulders
Neckline: Rejection confirmation
🎯 Target: Green line level.

SUNUSDT // Prices are above the Kaufman indicator after a long time. Our take profit point is the wedge indicator on the weekly time frame. Take loss is the closings that may be below the wedge on the daily time frame.

Sun Token's Correction Is Over, 267% Target MappedThe correction is over. This is what you need to know first.
The end of the correction signals the start of the next bullish phase.
The correction ended right below the 0.786 Fib. retracement level relative to the last bullish wave. This is also near the peak price around March 2024, once resistance turned support.
There was a low first in October 2024 and now multiple sessions in 2025 produced a long-term double-bottom. This signal supports the one mentioned above. So this is a strong chart.
Support is good and confirmed.
The action is starting to turn green. From this point forward, there will be massive growth.
» An easy target can be seen on the chart. It goes to 267% short-term, can be mid-term, within 1-3 months. After that, there will be additional growth.
This chart is meant to alert you of great prices and entry timing.
Thanks a lot for your continued support.
Namaste.

#SUN/USDT#SUN
The price is moving within a descending channel on the 1-hour frame and is expected to continue upward.
We have a trend to stabilize above the 100 moving average once again.
We have a downtrend on the RSI indicator that supports the upward move with a breakout.
We have a support area at the lower limit of the channel at 0.01560.
Entry price: 0.01610
First target: 0.01632
Second target: 0.01660
Third target: 0.01700

SUN Rebuy Setup (12H)It is one of the assets owned by the creator of TRON.
It appears to be completing a large triangle and may move upward from the green zone to complete wave E.
The target could be the red box.
A daily candle closing below the invalidation level will invalidate this analysis.
For risk management, please don't forget stop loss and capital management
Comment if you have any questions
Thank You

SUN/USDT 4H Chart AnalysisCurrently observing SUN/USDT on the 4-hour timeframe with Heikin Ashi candles:
1️⃣ Price Action & Trend
The price remains below the 200-period SMA, currently acting as a dynamic resistance at approximately 0.01677 USDT.
Clear short-term bearish trend structure, with lower highs visible since the recent spike.
The recent price action indicates consolidation, but bearish momentum persists.
2️⃣ Key Levels:
Resistance: Immediate resistance around the 200 SMA (0.01677). Any break above this line could trigger bullish momentum.
Support: Local support established near 0.01615. A breach below could signal further bearish continuation towards 0.01550.
3️⃣ Indicators:
MACD (Ultimate MTF) shows negative momentum with MACD lines below the zero-line, indicating ongoing bearish sentiment.
Histogram bars remain negative, underscoring the bears' control over the current market condition.
📌 Trading Idea:
Short Scenario: If the price rejects clearly from the 200 SMA, consider short positions targeting 0.01615 and potentially 0.01550.
Long Scenario: Wait for a confirmed breakout and retest above the 200 SMA (0.01677) for bullish confirmations, targeting upwards towards 0.01750 initially.
⚠️ Recommendation: Maintain tight stop-losses around key levels, especially given the potential for volatility in the current consolidation phase.
👉 Conclusion: Currently leaning bearish with cautious optimism if resistance at the 200 SMA is overcome. Monitor closely for decisive price action to determine direction.
💬 Let me know your thoughts below! Like & follow for more updates! 🚀📈

SUNUSDT 5DSUN ~ 5D Analysis
#SUN Trading is very high risk. Buy from here if you have a Conviction on this coin with a short -term target of at least 15%+.

SUN can pump 6 to 7x from hereThe SUN.io platform is TRON's first one-stop platform that supports stablecoin swap, token mining and self-governance. After the redenomination, the new SUN token, as a multifunctional governance token on the SUN platform (similar to the CRV token of Curve DAO and the EPS token of Ellipsis), will grant token holders various rights and benefits such as the voting and governance right in the community, value capture, staking rewards, etc..

SUN/USDTKey Level Zone : 0.026400 - 0.026600
HMT v4.1 detected. The setup looks promising, supported by a previous upward/downward trend with increasing volume and momentum, presenting an excellent reward-to-risk opportunity.
HMT (High Momentum Trending):
HMT is based on trend, momentum, volume, and market structure across multiple timeframes. It highlights setups with strong potential for upward movement and higher rewards.
Whenever I spot a signal for my own trading, I’ll share it. Please note that conducting a comprehensive analysis on a single timeframe chart can be quite challenging and sometimes confusing. I appreciate your understanding of the effort involved.
Important Note :
Role of Key Levels:
- These zones are critical for analyzing price trends. If the key level zone holds, the price may continue trending in the expected direction. However, momentum may increase or decrease based on subsequent patterns.
- Breakouts: If the key level zone breaks, it signals a stop-out. For reversal traders, this presents an opportunity to consider switching direction, as the price often retests these zones, which may act as strong support-turned-resistance (or vice versa).
My Trading Rules
Risk Management
- Maximum risk per trade: 2.5%.
- Leverage: 5x.
Exit Strategy
Profit-Taking:
- Sell at least 70% on the 3rd wave up (LTF Wave 5).
- Typically, sell 50% during a high-volume spike.
- Adjust stop-loss to breakeven once the trade achieves a 1.5:1 reward-to-risk ratio.
- If the market shows signs of losing momentum or divergence, ill will exit at breakeven.
The market is highly dynamic and constantly changing. HMT signals and target profit (TP) levels are based on the current price and movement, but market conditions can shift instantly, so it is crucial to remain adaptable and follow the market's movement.
If you find this signal/analysis meaningful, kindly like and share it.
Thank you for your support~
Sharing this with love!
HMT v2.0:
- Major update to the Momentum indicator
- Reduced false signals from inaccurate momentum detection
- New screener with improved accuracy and fewer signals
HMT v3.0:
- Added liquidity factor to enhance trend continuation
- Improved potential for momentum-based plays
- Increased winning probability by reducing entries during peaks
HMT v3.1:
- Enhanced entry confirmation for improved reward-to-risk ratios
HMT v4.0:
- Incorporated buying and selling pressure in lower timeframes to enhance the probability of trending moves while optimizing entry timing and scaling
HMT v4.1:
- Enhanced take-profit (TP) target by incorporating market structure analysis

Trading opportunity for SUNUSDTBased on technical factors there is a Sell position in :
📊 SUNUSDT
🔴 Sell Now
🪫Stop loss 0.02550
🔋Target 0.02050
📏 R/R 2
💸RISK : 1%
We hope it is profitable for you ❤️
Please support our activity with your likes👍 and comments📝

Huge $SUN cup&handle?NYSE:SUN is evolving to a cup&handle pattern. To be confirmed, it still needs a daily/weekly close above 0.05.
If confirmed the target is 0.35$. Insane!!!

Sun Token ($SUN): Strategic Entry into DeFi Ecosystem TokenI spend time researching and finding the best entries and setups, so make sure to boost and follow for more.
Sun Token ( NYSE:SUN ): Strategic Entry into DeFi Ecosystem Token
Sun Token (SUN) is a crypto in the CRYPTO market. The price is 0.02420828 USD currently with a change of -0.00058 (-0.02359%) from the previous close. The intraday high is 0.02517523 USD and the intraday low is 0.02232376 USD.
Trade Setup:
- Entry Price: $0.02197
- Stop-Loss: $0.00692
- Take-Profit Targets:
- TP1: $0.05232
- TP2: $0.08906
Fundamental Analysis:
Sun Token ( NYSE:SUN ) is integral to the TRON blockchain's decentralized finance (DeFi) ecosystem, facilitating governance and incentivization within the platform. Its role in promoting DeFi activities on TRON has garnered attention from investors seeking exposure to this growing sector.
Technical Analysis:
- Current Price: $0.02420828
- Moving Averages:
- 50-Day SMA: $0.02350000
- 200-Day SMA: $0.02200000
- Relative Strength Index (RSI): Currently at 55, indicating neutral momentum.
- Support and Resistance Levels:
- Support: $0.02250000
- Resistance: $0.02550000
Market Sentiment:
The DeFi sector continues to expand, with NYSE:SUN playing a pivotal role in TRON's ecosystem. Its integration into various DeFi protocols enhances its utility and appeal among investors.
Risk Management:
Implementing a stop-loss at $0.00692 helps mitigate potential losses, while the take-profit targets at $0.05232 and $0.08906 offer favorable risk-reward ratios. Given the token's volatility, strict adherence to these levels is crucial.
When the Market’s Call, We Stand Tall. Bull or Bear, Just Ride the Wave!
Disclaimer: This analysis is for informational purposes only and does not constitute financial advice. Traders should conduct their own due diligence before making investment decisions.


$SUN sun just signaled a break out of falling channelSET:SUN has been on a down trend for Months!
Current Price: 0.020
Price action has continued in it's falling Channel and recently just broke slightly out of it!
Expecting Price Action to continue upwards.
#SUN Targets: 0.024, 0.032, 0.041
This Idea Invalidates under 0.0189


TRON is the leading large altcoin this cycle!!TRX was especially strong this bear market. It was able to steady itself from falling too far. Similar more to Bitcoin then other alts like Solana. TRX fell around 74% in the bear market like BTC. SOL fell more like 94%.
TRX now 150% above old highs and SOL below old highs.
This is not to take anything away from SOL but comparing TRX to the other strongest alt this cycle. I suspect SOL might end up following TRX in a TRX like breakout from its old 2021 highs.
TRX has been able to capture a key part of the crypto market in being a chain for stablecoin transfers and is trying to expand into more typical defi areas.

Sunny side up?Relative to other alts that have made big moves in the past few days, this one is lagging a bit.
Looking at the 2 day chart on the left we have found clear support, we just have not made the explosive breakout, yet. We are primed right under multi day resistance right now, so this could be within the next set of alts to make a wave higher. Stops are clear right now on the hourly chart as we are resting on support as of typing. Solid RR. Lets stay above the purple and we'll see another 2day break higher.


Destiny SUNThe best entry position has been provided, the downward trend has been broken and a pullback has occurred, an upward movement will occur in the coming hours.

double bottom SUN/USDTmy last trades fauke. hope this will play out, looks like on the 4H timeframe that its forming a TEMPORARY double bottom.\
to the 618 fib. cheers!
