SUPERUSDT Forming Falling WedggeSUPERUSDT is forming a clear falling wedge pattern, a classic bullish reversal signal that often indicates an upcoming breakout. The price has been consolidating within a narrowing range, suggesting that selling pressure is weakening while buyers are beginning to regain control. With consistent volu
Related pairs

SUPBullish Scenario (medium–low probability)
If the price bounces from 0.25 or 0.16:
Target 1 → 0.568 USDT
Target 2 → 0.736 USDT
Target 3 → 0.974 USDT
To confirm a trend reversal, the weekly close should be above 0.568.
Bearish Scenario (medium–high probability)
If the price falls below 0.1614,

SUPERUSDT Forming Falling WedgeSUPER/USDT is showing a strong structural setup that’s catching attention in the market. The price action appears to be forming a falling wedge, which is typically a bullish reversal pattern. Given the recent pick-up in volume and the squeeze of price inside the narrowing range, the setup suggests t

LongAccording to the analysis of the waves and the help of the Gann method, it can be expected that the price will return to the green zone again.
This is my personal opinion. Please don't use it as your trading criteria. Good luck

SUPER – Heavy Trend with Strong Market Cap SupportSUPER is trending heavily today, showing strong momentum and buyer interest. With a market cap just under 500M, it steps into the range where bigger investors and institutions begin to take notice, suggesting that this is more than just a typical pump-and-dump scenario.
This trend looks promising fo

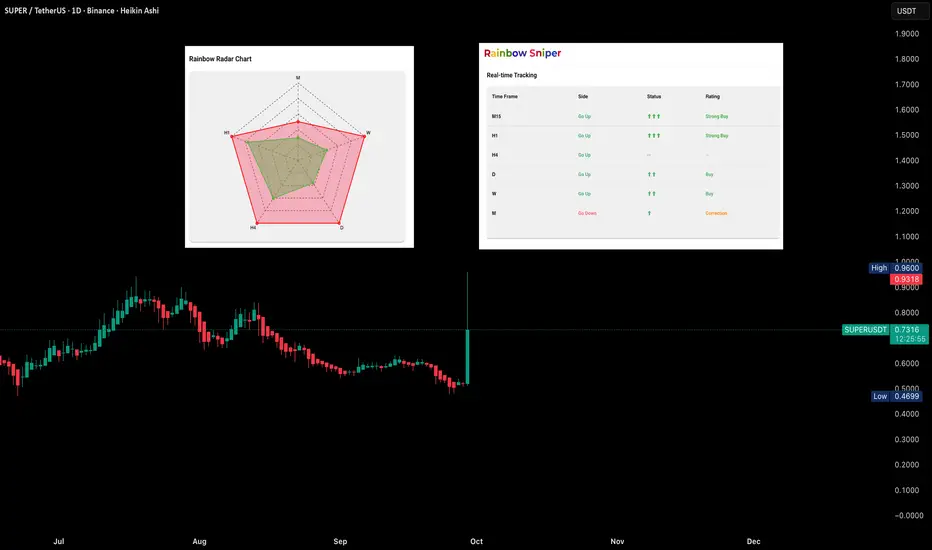
SUPERUSDT – Multi-timeframe Analysis (29/09/2025)📊 SUPERUSDT – Multi-timeframe Analysis (29/09/2025)
🔹 Realtime Tracking
Intraday (D1–H4): Both Daily and 4H show Go Up, reflecting short-term strength.
Weekly (W–D1): Weekly and Daily remain aligned on the upside, confirming mid-term support.
Monthly (M–W): Monthly still shows Correction, while W
#SUPER/USDT The End of Pullback ?#SUPER
The price is moving within a descending channel on the 1-hour frame, adhering well to it, and is heading for a strong breakout and retest.
We have a bearish trend on the RSI indicator that is about to be broken and retested, which supports the upward breakout.
There is a major support area

SUPERUSDT 1D#SUPER is moving within a symmetrical triangle on the daily chart. For the bullish scenario, it must first break above the daily SMA200 and then the triangle resistance. If this happens, the potential targets are:
🎯 $0.8490
🎯 $0.9976
🎯 $1.1461
🎯 $1.3577
🎯 $1.6271
For the bearish scenario, keep in

SUPER/USDT – Ready for a Massive Rebound or a Sharp Breakdown?Market Overview
SUPER is currently trading around 0.6025 USDT, sitting right above the 0.42–0.62 historical demand zone (yellow box). This area has acted as both accumulation and distribution since 2021 — a key battleground where long-term buyers and sellers fight for dominance.
---
Weekly Struct

SUPERUSDT Forming Bullish DescendingSUPERUSDT is currently showing strong potential as it forms a bullish descending channel pattern, a setup that often signals an upcoming breakout after a period of consolidation. This technical structure suggests that the recent downtrend may be approaching exhaustion, with a reversal on the horizon

See all ideas
Summarizing what the indicators are suggesting.
Oscillators
Neutral
SellBuy
Strong sellStrong buy
Strong sellSellNeutralBuyStrong buy
Oscillators
Neutral
SellBuy
Strong sellStrong buy
Strong sellSellNeutralBuyStrong buy
Summary
Neutral
SellBuy
Strong sellStrong buy
Strong sellSellNeutralBuyStrong buy
Summary
Neutral
SellBuy
Strong sellStrong buy
Strong sellSellNeutralBuyStrong buy
Summary
Neutral
SellBuy
Strong sellStrong buy
Strong sellSellNeutralBuyStrong buy
Moving Averages
Neutral
SellBuy
Strong sellStrong buy
Strong sellSellNeutralBuyStrong buy
Moving Averages
Neutral
SellBuy
Strong sellStrong buy
Strong sellSellNeutralBuyStrong buy
Displays a symbol's price movements over previous years to identify recurring trends.
Frequently Asked Questions
The current price of SUPER / TetherUS (SUPER) is 0.2172 USDT — it has fallen −1.57% in the past 24 hours. Try placing this info into the context by checking out what coins are also gaining and losing at the moment and seeing SUPER price chart.
SUPER / TetherUS price has fallen by −7.35% over the last week, its month performance shows a 7.82% increase, and as for the last year, SUPER / TetherUS has decreased by −86.57%. See more dynamics on SUPER price chart.
Keep track of coins' changes with our Crypto Coins Heatmap.
Keep track of coins' changes with our Crypto Coins Heatmap.
SUPER / TetherUS (SUPER) reached its highest price on Mar 31, 2021 — it amounted to 4.7700 USDT. Find more insights on the SUPER price chart.
See the list of crypto gainers and choose what best fits your strategy.
See the list of crypto gainers and choose what best fits your strategy.
SUPER / TetherUS (SUPER) reached the lowest price of 0.0698 USDT on Oct 19, 2023. View more SUPER / TetherUS dynamics on the price chart.
See the list of crypto losers to find unexpected opportunities.
See the list of crypto losers to find unexpected opportunities.
The safest choice when buying SUPER is to go to a well-known crypto exchange. Some of the popular names are Binance, Coinbase, Kraken. But you'll have to find a reliable broker and create an account first. You can trade SUPER right from TradingView charts — just choose a broker and connect to your account.
Crypto markets are famous for their volatility, so one should study all the available stats before adding crypto assets to their portfolio. Very often it's technical analysis that comes in handy. We prepared technical ratings for SUPER / TetherUS (SUPER): today its technical analysis shows the sell signal, and according to the 1 week rating SUPER shows the strong sell signal. And you'd better dig deeper and study 1 month rating too — it's sell. Find inspiration in SUPER / TetherUS trading ideas and keep track of what's moving crypto markets with our crypto news feed.
SUPER / TetherUS (SUPER) is just as reliable as any other crypto asset — this corner of the world market is highly volatile. Today, for instance, SUPER / TetherUS is estimated as 4.44% volatile. The only thing it means is that you must prepare and examine all available information before making a decision. And if you're not sure about SUPER / TetherUS, you can find more inspiration in our curated watchlists.
You can discuss SUPER / TetherUS (SUPER) with other users in our public chats, Minds or in the comments to Ideas.