S/USDT Potential UpsidesHey Traders, in today's trading session we are monitoring S/USDT for a buying opportunity around 0.5850 zone, S/USDT is trading in an uptrend and currently is in a correction phase in which it is approaching the trend at 0.5850 support and resistance area.
Trade safe, Joe.

SONIC/USDT – Breakout Setup (15m Chart)SONIC/USDT – Breakout Setup (15m Chart)
Price is testing the descending trendline resistance after forming a potential higher low. A breakout from this trendline with strong volume may signal a bullish reversal.
Entry: Around 0.5825
Stop Loss: Below 0.5650
Target: 0.6248 - 0.6663
Risk/Reward rati

S or old FTMAs a blockchain platform the price of S with a stable growth ecosystem must be over 2$ not such prices,and I dont understand the traders of this coinn vs Sui or others....lets push it to the Moon...

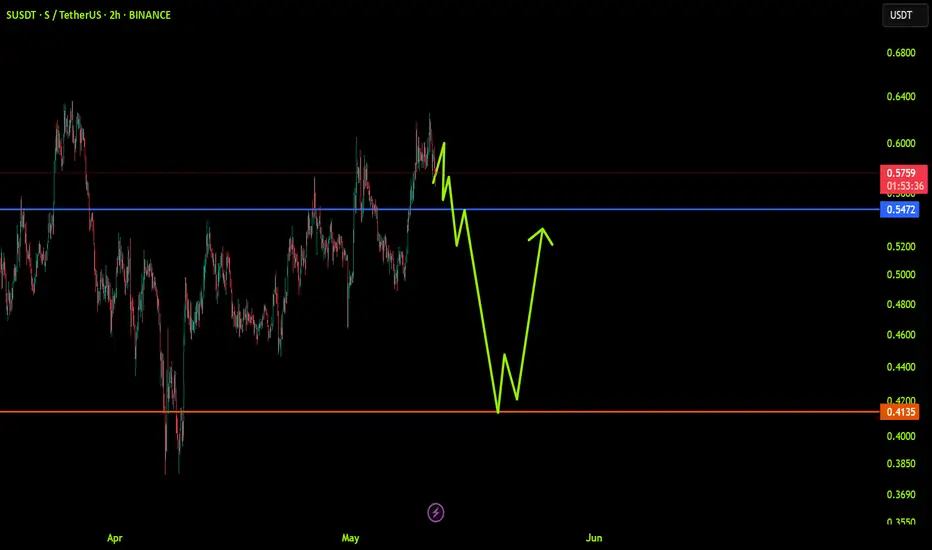
SUSDT: trend in 2H time framesThe color levels are very accurate levels of support and resistance in different time frames, and we have to wait for their reaction in these areas.
So, Please pay special attention to the very accurate trend, colored levels, and you must know that SETUP is very sensitive.
Be careful
BEST
MT

SONIC preparing for departure. SONIC is still within range and has not broken out. Price action is at the top of the range and is technically at resistance. Longing into resistance is not the best strategy; however, a breakout could happen anytime. Consider laddering in within the range, preparing for any possible BTD opportunit


S COIN READY FOR BUY LONGS coin sweept previous low liquidity and did internal MS while leaving behind FVG and OB. Will enter here after bullish confirmation.

S/USDT 4H1. Price Trend and Key Levels
The current price is around 0.5250, attempting to hold above that zone.
Key resistance levels:
0.5300 (first major resistance)
0.5900 – 0.5999 (strong resistance zone)
0.6450 (long-term resistance)
Key support levels:
0.4585
0.4010 (stronger support at channel

SUSDT , long opportunity
Sonic (SUSDT) is currently trading within a long-term ascending channel on the weekly timeframe, indicating a bullish macro structure. Price action has respected both the upper and lower bounds of the channel multiple times, showing strong trend continuation behavior.
On the daily timeframe, Sonic

See all ideas
Summarizing what the indicators are suggesting.
Oscillators
Neutral
SellBuy
Strong sellStrong buy
Strong sellSellNeutralBuyStrong buy
Oscillators
Neutral
SellBuy
Strong sellStrong buy
Strong sellSellNeutralBuyStrong buy
Summary
Neutral
SellBuy
Strong sellStrong buy
Strong sellSellNeutralBuyStrong buy
Summary
Neutral
SellBuy
Strong sellStrong buy
Strong sellSellNeutralBuyStrong buy
Summary
Neutral
SellBuy
Strong sellStrong buy
Strong sellSellNeutralBuyStrong buy
Moving Averages
Neutral
SellBuy
Strong sellStrong buy
Strong sellSellNeutralBuyStrong buy
Moving Averages
Neutral
SellBuy
Strong sellStrong buy
Strong sellSellNeutralBuyStrong buy