Siemens AG (1D) – Full Technical Analysis + Fundamental Analysis🔍 1. Price Action & Trend Structure
✔️ Strong long-term uptrend inside a rising channel
Siemens has been moving within a well-defined ascending channel for several years.
The price consistently respects both the upper resistance line and the lower support line of this channel.
Every pullback to the bottom of the channel has historically led to a new bullish wave.
✔️ Price currently near the upper-mid region of the channel
This suggests:
The trend is still healthy and bullish
But the stock is not at an ideal low-risk buy zone
Strongest buy opportunities typically occur near the channel’s lower boundary
✔️ Key support zone: ~138 €
This level, marked on the chart, acted as:
Major support during corrections
A psychological price floor
If the stock ever returns to this zone, it would be considered a high-value demand area.
🔍 2. MACD + RSI Combined Indicator
✔️ MACD is recovering from a recent bearish phase
The histogram is transitioning from negative toward zero → decreasing selling pressure
MACD and Signal lines are preparing for a possible bullish crossover
This usually indicates early momentum shift toward buyers
⚠️ However:
The momentum is not strongly bullish yet.
The MACD must cross above the Signal line with histogram turning positive for a confirmed buy signal.
➡️ We are currently in a transition phase, not a confirmed uptrend continuation.
🔍 3. Stochastic RSI (Stoch RSI)
✔️ Stoch RSI is near overbought levels (above 90)
This indicates:
A strong recent upward bounce
Potential for short-term pullback or consolidation
However, in strong long-term trends (like Siemens), Stoch RSI can stay overbought for extended periods without triggering a reversal.
✔️ Overall message from Stoch RSI:
Momentum is strong short term, but buying at this level carries increased risk of near-term correction.
🔍 4. Key Observations from RSI Strategy Buy/Sell Signals
The chart shows multiple automated RSI-based Buy (LE) and Sell (SE) signals.
Pattern:
Buy signals occur near channel support → extremely profitable historically
Sell signals occur near channel resistance → reliable for trimming or exiting
Right now:
Price is closer to the upper-middle zone, not near support
Therefore, no strong Buy signal is present
🔥 5. Bullish & Bearish Scenarios
Bullish Scenario (Primary Trend)
If price continues respecting the channel:
Next target: 240–250 € range
Break above 250 € → continuation toward 270–280 €, the projected top of the channel
This aligns with the stock’s strong long-term bullish structure.
Bearish Scenario (Less likely but important)
If momentum weakens and price breaks below the mid-channel line:
First support: 210 €
Major support: 138 € zone (historically very strong)
A break below 138 € would invalidate the rising channel, but this has a low probability given historical behavior.
⭐ Final Summary
Siemens remains in a strong multi-year uptrend inside a clean ascending channel.
MACD shows early signs of bullish momentum returning, but not confirmed yet.
Stoch RSI is overbought, signaling the possibility of a short-term pullback.
Price is not at the channel bottom, meaning risk is higher for new entries at current levels.
📌 Best buying opportunities historically occur at the channel’s lower boundary.
We are currently in the mid-to-upper area, which is not optimal for low-risk entry.
If you want, I can also provide:
✔ Entry/exit points
✔ Risk management plan
✔ Weekly & monthly timeframe confirmation
----------------------------------------------------------
Fundamental Analysis
🧾 1. Business & Structural Drivers
Siemens AG is a diversified industrial and technology group, with core businesses in:
Digital Industries (automation, industrial software)
Smart Infrastructure (building technologies, power distribution)
Mobility (rail and transportation solutions)
Management highlights electrification, transportation and industrial software as the main long-term growth drivers, with continued strong demand in these areas even while the automation environment has been more challenging.
Siemens
The company is also pushing its “ONE Tech Company” strategy – integrating hardware, software and services to lock in customers and grow recurring revenues.
Siemens
+1
📈 2. Recent Financial Performance
FY 2024 (year ended 30 Sept 2024)
Revenue: €75.9 billion, +3% year-on-year.
Net income: €9.0 billion – a record high at that time.
Free cash flow: €9.5 billion, described by management as “excellent”.
Siemens
+2
Siemens Press
+2
Demand remained strong in electrification, transport and industrial software, helping offset a tougher cycle in automation.
Siemens
FY 2025 (latest full year)
For fiscal 2025 (ended Sept 2025), Siemens extended this growth trend:
Q1 2025: revenue €18.4 bn (+3%); book-to-bill 1.09.
Siemens Press
Q2 2025: revenue €19.8 bn (+7%); orders up 10% to €21.6 bn; book-to-bill 1.10.
Siemens Press
Q4 2025: revenue €21.4 bn (+6% comparable); book-to-bill 1.02.
Siemens Press
+1
For the full fiscal 2025 year:
Net income: ~€10.4 billion, another all-time high (third year in a row).
EPS pre PPA: €12.95; excluding one-off gains, EPS pre PPA was ~€10.71 – in line with guidance (€10.40–11.00).
Siemens Press
+1
There was an earnings miss versus analyst expectations in Q4 2025 (EPS and revenue came in slightly below forecasts, which caused a short-term share price drop), but underlying growth remained solid.
Investing.com
Outlook
For fiscal 2026, Siemens guides for:
Comparable revenue growth: 6–8%
Book-to-bill: >1
EPS pre PPA: €10.40–11.00 (excluding special items).
Siemens
This shows management still expects profitable growth despite macro uncertainty and FX headwinds.
💰 3. Balance Sheet, Cash & Dividend
Free cash flow: around €9.5 bn in FY 2024 (and similarly strong in 2025), giving the company a lot of flexibility for dividends, buybacks and investment.
Siemens Press
+1
Net debt: Total net debt around €34.8 bn, but industrial net debt only about €7.9 bn, down ~27% vs 2022, with a solid liquidity position.
Creditreform Rating
Dividend: Proposed/paid dividend of €5.20 per share, with a yield roughly in the 2–3% range and a payout ratio around 40–45%.
Siemens Press
+2
Siemens
+2
Rating agencies and independent analysts generally view Siemens’ balance sheet as strong and conservative, which supports continued investment and shareholder returns.
Siemens
+1
📊 4. Valuation
Recent data show:
Trailing P/E: around 23–24x earnings.
Wisesheets
Forward estimates (2026–2027) imply a P/E in the low-20s and a dividend yield around 2.4–2.6%.
MarketScreener
Profit margin around 12% and decent returns on equity and invested capital compared with peers.
Yahoo Finance
+1
So the stock is not cheap, but for a high-quality, diversified industrial with strong cash generation and structural growth themes, the valuation is in a reasonable premium range rather than “bubble” territory.
⚙️ 5. Key Fundamental Positives
Structural tailwinds in electrification, grid upgrades, automation, digitalization and rail transport.
Siemens
+1
Consistent revenue and order growth with book-to-bill >1, showing a healthy pipeline.
Siemens Press
+2
Siemens Press
+2
Excellent free cash flow and disciplined capital allocation (dividends, buybacks, targeted acquisitions).
Siemens Press
+1
Strong balance sheet with manageable industrial net debt and solid credit ratings.
Creditreform Rating
+1
⚠️ 6. Main Risks & Caveats
Cyclical exposure: Parts of the business (especially automation) are sensitive to global industrial cycles and capex spending.
Siemens
Execution & portfolio risk: Strategy depends on integrating software, services and hardware; missteps in large projects (Mobility, infrastructure) or M&A could pressure margins.
FX and macro headwinds: Management already cites currency effects as a drag on EPS for 2026.
Siemens
Valuation risk: With a P/E in the 20s, any disappointment (like the recent Q4 2025 earnings miss) can trigger sharp short-term drawdowns.
Investing.com
+1
🧩 7. How This Fits Your Technical View
Technical picture: clear long-term uptrend in a rising channel, but currently not at the lower boundary (not a “deep value” technical entry).
Fundamentals: confirm Siemens as a high-quality, cash-generative company with solid growth guidance and a shareholder-friendly capital allocation policy.
So from a combined technical + fundamental perspective:
Long-term investors might see Siemens as a strong compounder but may prefer to buy on pullbacks toward the lower part of the channel to improve risk/reward.
Short- to medium-term traders should still respect the overbought readings and channel resistance, even though the underlying business is fundamentally strong.
⚠️ Disclaimer (as you requested)
This fundamental and technical analysis reflects only my personal view based on publicly available information. I take no responsibility for any of your buy or sell decisions.
Siemens Aktiengesellschaft
No trades
Market insights

Siemens (SIE) Rally in Full Swing | Supercycle Target Above 700+⚡️ Siemens – Supercycle Wave 3 Heating Up! 🌊
Siemens (SIE) is mid-flight in Wave (3) of the Supercycle Wave 5 — the most explosive leg of the macro move.
Momentum still looks 🔥 with upside potential toward the 3.618 Fib extension around 330 , where Wave 3 could complete before a healthy Wave 4 dip.
Smart money’s been quietly reloading through each consolidation 🧠 — structure stays bullish, trend intact, and sentiment still building.
Wave 4 = opportunity. Wave 5 = potential breakout zone 🚀
Is smart money really in? Drop your analysis below!
#Siemens #SIE #ElliottWave #SmartMoneyConcepts #FibonacciTrading #PriceAction #TechnicalAnalysis #WaveTheory #Investing #TradingView #BullMarket #GermanStocks #MarketCycle #TrendTrading

Flag Flutters Precariously: Navigating the Sky of Greed.The Siemens flag, once a symbol of ambition, now hovers in the sky of opportunistic buyers. Previously, it was plummeting toward the ground, but a swarm of butterfly-like buyers, armed with unwavering determination, managed to lift it back up using a sturdy candlestick.
However, in this latest turn of events, the flag now hangs precariously between two vast voids, abandoned by the overconfident grip of greedy crab buyers. Their hold appears too weak to keep the flag aloft, and it seems destined to fall from the lofty height of 214 euros—ironically referred to as the "golden level of the crab." It seems that gravity, much like the harsh reality of the market, inevitably prevails.

Effort of the Young Green Butterfly to Raise the Siemens Flagthe detail is shown in the above Chart.
I made this Idea based on Candlestick Analysis and Fibonacci Tool .
The Buyers' Crab could reach the highest point at the price of 167 euros.
The Bearish trend started and siemens flag is falling and approaching to the golden level of buyers crab .
The past trend of sellers' candles has formed a motivated green butterfly pattern
So we can expect this young Butterfly to raise the Siemens flag again.
Siemens Is Great .
Good luck.
Short, target 184.9Following Siemens in daily chart.
I am mostly bearish in German stocks. For Siemens, I got a weekly short call o Monday and today a short call again in daily chart.
TP1 188.6
TP2 186.2
TP3 184.9 - my main target.
You can stop above 195 daily candle close.

parallelChannel+Fib0.61: Siemensnice HH-HL forming at monthly level, curent price level is close to HL, 0.61 fib level and at monthly support. seems nice setup to trade with good R:R


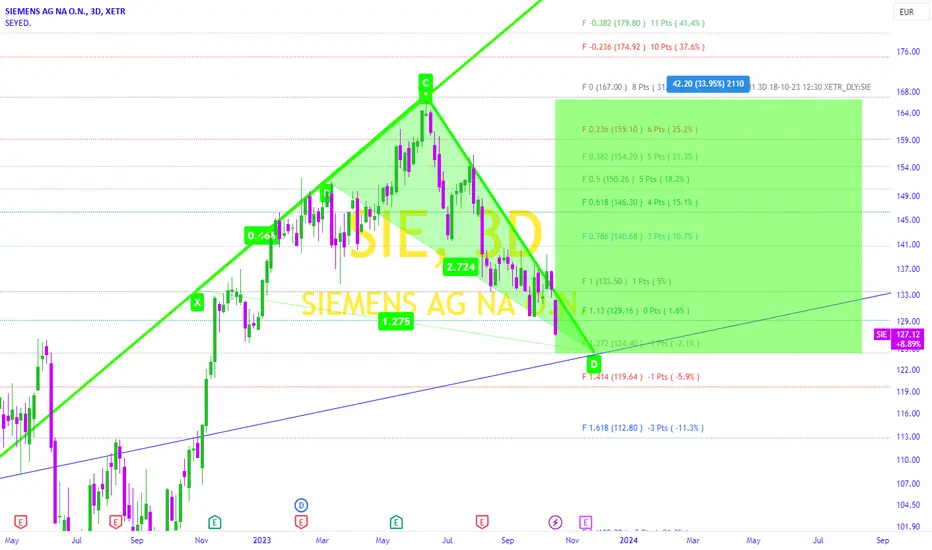
[S-004] Siemens AGIdea number S-004 | Siemens stock could fall toward support in the 126/124 EUR area.
The setup is negative, the stock is trading below the 20-day and 50-day moving averages. The MACD is negative and below its signal line. The RSI is trading below 30. This could mean that the stock is in a sustained downtrend or that it is simply oversold and therefore a rebound could take shape. In that case I would protect a possible bearish position with a tight stop loss on the pivot point as I show below:
📉 Short Entry at 134.8 EUR
💰 Take Profit at 124 EUR
💸 Stop Loss at 140 EUR

Siemens ,,, Buy opportunity Uptrend
It's a breakout and as you see the trend is favorable for getting a buy position be setting SL at a good place. Next target can be about 157 .


SIE // Inverted shoulder head shoulder formationAlthough there is an inverted shoulder head shoulder formation on the chart, pay attention to the wedge resistance in the weekly time frame. Targets are determined according to Fibonacci.

#SIEMENS long idea (+25%?)Hello dear Traders,
Here is my idea for #SIE
Price closed above yellow line (previous month high)
Price closed above purple trigger line to enter trade.
Targets marked in the chart (black lines)
Invalidation level marked with red line
Good luck!
❤️Please feel free to ask any question in comments. I will try to answer all! Thank you.
Please, support my work with like, thank you!❤️

Trading Idea - #SiemensAGMy trading idea for Siemens AG - SHORT
Target: EUR 89.00 (profit potential 12%)
The Siemens AG share is in an intact downward trend. In mid-June, there was a sharp drop below the support level of 114.00 EUR. The resistance around the EUR 109.00 mark was then confirmed several times. The next historical support at EUR 89.00 is expected to be targeted.
Like the entire industry, Siemens is also expected to be slowed down by weakening demand and an unfavourable price-cost ratio.
Analysts estimate a profit decline of up to 20% for 2023.

Long SiemensI am long on XETR:SIE
- 61.8% Retracement on the Weekly
- Supply & Demand zone
- Upcoming eanrings 11 Aug
entry @ $100
SL @ $98
TP @ 110
@Hendry2005


siemens FALLING WEDGESiemens is actually not a buy, there is a risk it will make a move till 120€, which could be buy area...


Short term bet that Siemens will fall from hereSiemens looks a bit overbought and so does the DAX, fingers crossed.

Long Entry Prediction SIE 20-07-2021Long entry for SIE predicted by our AI algorithm. The time horizon of the prediction is approximately 5 days.

place sell stop orderchannel breakout and pullback set an excellent opportunity for sell stop below resistant/support zone.

Siemens AG (SIE)This is one of the largest and best managed companies in the world. Over the last few years, the company has transformed itself significantly, dividing the management of many of the related companies and it is now branding itself as a digital technology company focused on factories and urban infrastructure. The Digital Industries division is already Siemens’ largest by sales, and operates at the highest profit margin. We believe that the support level of 120,00 euro, as shown in chart, is indeed a good entry point for a medium and long term investment, also considering the interesting dividend yield of 2.6%.
