$SXP opening a long leverage I'm opening a long leverage x10 for the imminent breaking of the resistance, with a possible TP at $0.25
SXPUSDT trade ideas

SXPUSDTSXP ~ 1W
#SXP Go back to this support block. if you have Conviction on this coin,. This is a great time to make purchases in stages.

Quick SPX Scenario for Retesting Lower Support zoneBINANCE:SXPUSDT
BINANCE:SXPUSDT
SL1 ---> Low-risk status: 3x-4x Leverage
SL2 ---> Mid-risk status: 5x-8x Leverage
👾The setup is active but expect the uncertain phase as well.
➡️Entry Area:
Yellow zone
⚡️TP:
0.2629
0.2596
0.2560
0.2510
🔴SL:
0.2783
🧐The Alternate scenario:
If the price stabilizes above the trigger zone, the setup will be cancelled.

#SXP Technical Analysis in a Daily TimeframeHello everyone, I’m Cryptorphic.
I’ve been sharing insightful charts and analysis for the past seven years.
Follow me for:
~ Unbiased analyses on trending altcoins.
~ Identifying altcoins with 10x-50x potential.
~ Futures trade setups.
~ Daily updates on Bitcoin and Ethereum.
~ High time frame (HTF) market bottom and top calls.
~ Short-term market movements.
~ Charts supported by critical fundamentals.
Now, let’s dive into this chart analysis:
The last 24 hours have been outstanding for SXP, with a massive 70% rally. The breakout from the resistance trendline led to a mega-pump toward the higher resistance without any retest.
Currently, SXP is facing rejection at the $0.3133 resistance. If it fails to close above this level on the daily timeframe, a correction is likely.
The primary support for SXP is at $0.2424, while the lower support or accumulation range is between $0.19 and $0.21.
Here are the key levels to consider:
- Primary Resistance: $0.3133.
- Primary Support: $0.2424.
- Crucial Point: A breakout above the $0.3133 resistance in a daily timeframe.
- Accumulation Range: $0.19-$0.21.
Note: Any changes in the accumulation range will be updated based on price movement.
DYOR, NFA.
Please hit the like button to support my content and share your thoughts in the comment section. Feel free to request any chart analysis you’d like to see!
Thank you
#PEACE

SXPUSDT.P LongSXPUSDT.P Long
Entry - 0.2890
TP - 0.3536
SL 1-2%
Use low lev and margin only!
DYOR
TYOR
NOT A FINANCIAL ADVISE!
Happy trading!

SXP superb After receiving multiple buy and Fbuys on the 15 min radar, SXP tried to break our sell point and couldn't and go exhausted. So a short is a sure short
Target1 : That blue line (May test and try to go up as it did before)
Target2: Lower green line
Target 3: Hell (Depends upon BTc)
for Indicator access message me

Solar Goes Bullish (High Volume Precedes Bullish Wave)Today, Solar (SXPUSDT) produced a very strong bullish breakout. This bullish breakout is supported by high volume. Really high volume precedes a major bullish wave. This can be confirmed by looking at past action (left side of the chart).
➖ We looked at Solar vs Bitcoin (SXPBTC) recently and this pair is also bullish.
What you are seeing is only the beginning of a major bullish wave for this pair that will be true also for the rest of the Altcoins market.
➖ The Altcoins are heating up? No!
➖ The Altcoins are growing strong now? Yes!
Thank you for reading.
Your support is appreciated.
Namaste.

SXPUSDT KEY LEVELSExplanation:
This is a very useful trading system. This means that you should not take a trade blindly, but rather that there is another confirmation to take the trade you can use this for perfect entry and perfect exit
This trading opportunity is based on volume, previous price, and price range , are included
Entry/Exit point's:
- It has very easy entry and exit points
- In this pair of lines with two colors are given (RED AND GREEN)
- In this the GREEN line is used to take long entry and the RED line is used to take short entry (But it is all based on a more conformation from your trading plan)
Stop Loss/Take Profit:
Stop Loss
- According to this, if you take a long trade, its stop loss will be the RED line just below ( A trade can exit either when the price crosses the RED line or the 5 minute candlestick crosses the RED line. (This can be done according to your preference) )
- A short entry should use the opposite rules to a long entry
Take Profit
-When you take a long entry according to the profit to be booked is on the next RED line above. ( Or if there are other reasons, it can be a safe exit )
- Opposite rules for booking profit on long entry are to book profit on short trade. ( The GREEN line above is the stop loss of short entry )
Timeframe:
According to this, the time frame you should use while taking trades is 15 minutes time frames . (15 minute time frame works well in this)
Risk Disclaimer:
Leave a comment if you like my entry setup. This share is for educational learning purposes only, and I am not responsible for your profit or loss. Note: For more details, check the chart.

Major Move Imminent for #SXP! Will It Breakout or Break Down?Yello Paradisers! Are you ready for what's next? #SXP is approaching a crucial point, and we need to be prepared for all possible scenarios.
💎Currently, #Solar is trading within a descending channel and nearing a key demand zone. The price is testing a critical level around $0.224, which could lead to a significant bullish breakout if sustained momentum is achieved.
💎Should this occur, we could see #SXPUSDT challenging the descending resistance and aiming for the major supply area at $0.3061.
💎A breakthrough above this supply zone could trigger a substantial bullish rally, potentially pushing the price toward a strong resistance level. However, we must also consider the possibility of rejection at this supply area.
💎If #SXP faces resistance here and loses momentum, we might witness a bullish rebound from the solid support at $0.195.
💎Falling below this support could indicate a prolonged bearish trend, with #SXP continuing to trade within the descending channel.
Stay focused, patient, and disciplined, Paradisers!
MyCryptoParadise
iFeel the success🌴

SXPUSDT Update:A technical analysis update on the TSX:SXP (Swipe) cryptocurrency!
So, you're seeing a breakout from a descending channel in the 1-day timeframe, which is a bullish signal. This suggests that the price may be preparing for a potential upward move.
- 1D timeframe: The breakout is occurring in the daily chart, which is a relatively short-term perspective.
- Expecting bullish wave: You anticipate a price increase in the coming days.

SXPUSDT 1DThe #SXP daily chart shows a falling wedge formation. Consider buying a small amount and holding. The targets are:
$0.2825
$0.3376
$0.3822
$0.4268
$0.4910
$0.5710

#SXP/USDT is only bullish untill it breaks the Diagonal Trendlin#SXP/USDT is only bullish untill it breaks the Diagonal Trendline in 4-Hour TF!
TSX:SXP must clear the PWH $0.2515 resistance level, and the local support level is PWL $0.195.

SXP upside targetWe just took a long position on SXPUSDT. The key resistance area is near the 61.8% Fibonacci level and the top of the ascending channel. Should the price reach our target, it will result in a solid 20% gain!

SXPUSDT 1WSXP ~ Update
#SXP Fulfill our Purchases. this is a very good buy in our opinion. Our target is at least 20%+ from here.

SNX/USDTSNX should be a short for now, invalidation is breaking and claiming supporting on trendline.

SXPUSD 12HSXP ~ 12H
#SXP Make purchases gradually after successfully breaking through the resistance line of this pattern. with a minimum target of 15%+

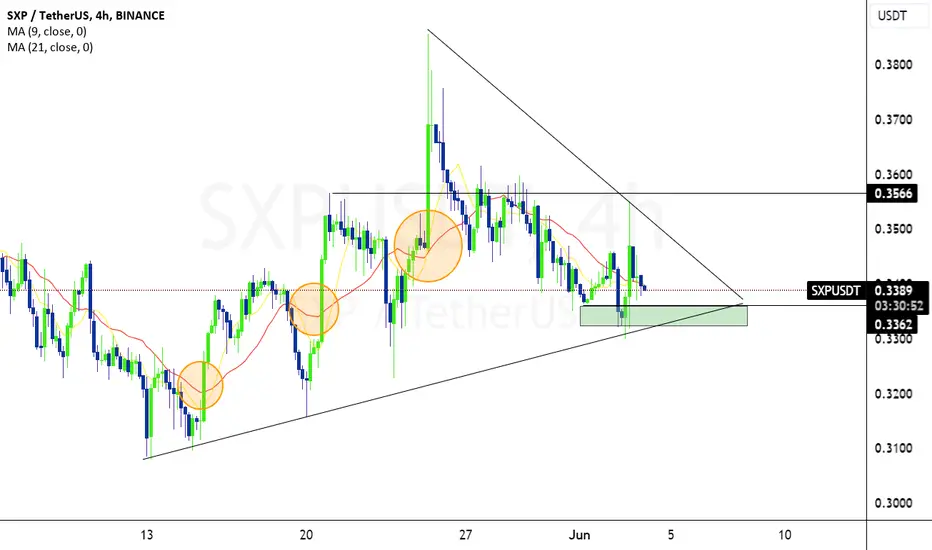
SXPThis cryptocurrency is at the support level of 0.3362.
Take a short-term swing with the first target at 0.3566.
SXP 4hI've always liked sxp.
First of all, due to its volatility and secondly, because it is very understandable for me and my trading assistant.
And the name is cool, it looks like the name of some sports Acura)

Swipe (Solar) new targets + Early SignalSXP is an older project as we know. From swipe they are now called Solar
SXP is the native utility token of the Solar blockchain. Users can stake it to secure the network and earn rewards, and pay transaction fees on the Solar blockchain. They can also help govern the Solar blockchain by proposing and voting on changes to the protocol, and earn rewards for providing liquidity.
Solar is a decentralised and energy-efficient delegated proof-of-stake (DPoS) blockchain network

SXPUSDT 1DFalling wedge pattern on the #SXP daily chart. We have a heavy resistance zone around the $0.3555 ~ $0.3754. Let's see how it will play with the falling wedge and resistance. Support is $0.2968
The targets are:
$0.3754
$0.4015
$0.4339
$0.4663
$0.5063
$0.5710


SXP Holders! FOLLOW ME~!Hey, guys.
This is ESS team.
We take this chart for you with a pro tip!
If it is supported by the ORANGE uptrend line, It is expected to break through the RED downtrend line.
After the break, It is going to reach the GREEN uptrend line.
Tip!
1. If Green uptrend line is broken through, It will go UP to the purple uptrend line.
2. Cash HOLDERS, After breaking through the BLUE order block, Check the retest confirm before entering.

#SXP/USDT#SXP
The price is moving in a bearish channel on a 12-hour frame and is adhering to it well. The price has rebounded from the green zone, which is expected to be retested at 0.300.
We have a tendency to stabilize above the Moving Average 100
We have a downtrend on the RSI indicator that is expected to break higher to support the rise
Entry price is 0.300
The first goal is 0.360
The second target is 0.4100
The third goal is 0.4666
