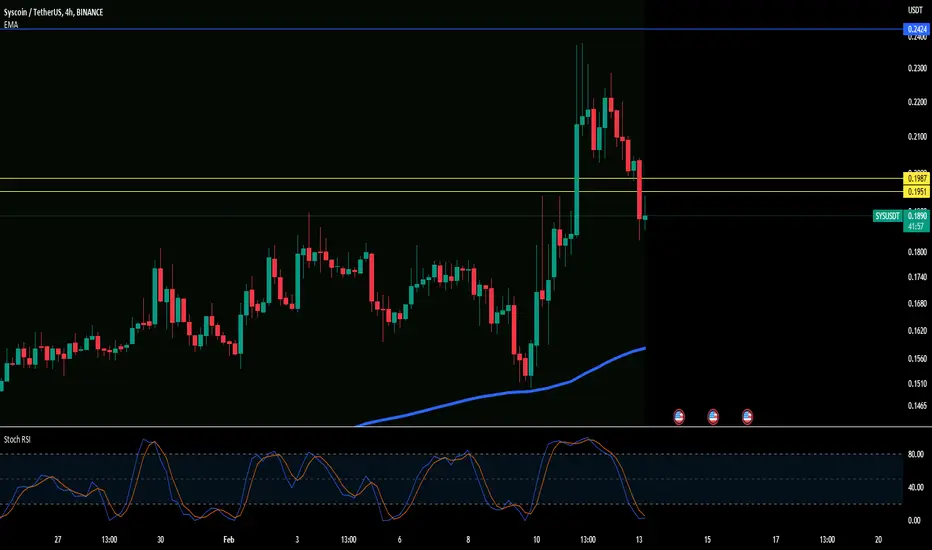
At least 2x coming for $SYS/USDTAfter my successful analysis for $PEPE/USDT, I took some profits from that trade and now I am going to invest in $SYS/USDT for the following reasons:
1. on the 28th of June there is going to be a new product of SYSLABS called Rollux, after launching this product there will be a buzz in the community, which will make the price go higher.
2. There is a nice bullish divergence, which you can also see on the screenshot.
3. After the market spike lately, sys stays calm, which makes me think that after the market calms down a bit, then sys will be the one making people talk about it.
Well, I indicate in the chart TP/SL, I am sure sys will do at least 2x from this price.
DYOR and invest on your behalf.
Cheers.
Trade ideas

SYS short targets inside the range.Radar registers buyer activity at the lower boundary of the range. Risk/return 1k3

#SYS/USDT - Long - Potential 8%Direction: Long
Market: Spot
Risk: 0.25% - 1%
#USDT_SYS
Exchange: BINANCE
Timeframe: 360
TP1: 0.1837
Entry: 0.1699
STOP: 0.1561
Entry Conditions:
| Broke FastMA
| Big volume confirmation

✴️ Syscoin | EW Bullish Impulse (5-Waves Up)Here we have a potential wave count for the developing bullish impulse based on Elliot Wave theory on the Syscoin (SYSUSDT) chart.
Two things are quite clear for us:
1) The drop from Dec. 2021 to June 2023 as a major move down.
2) The consolidation phase as a the extension of the correction.
After a correction, a new move develops.
Another things that is perfectly clear, is the first wave (Wave 1) in January 2023. We can see 6 green weeks.
Wave 2 is also quite clear but this will be confirmed only if we get wave 3 and that's the projection.
Elliot Wave Theory Conclusion
✔️ Since we have a corrective pattern after a major bearish move followed by a bullish breakout, we know that we are in a new move which in turn must be either an inverted correction (upwards zig-zag or flat) or a new bullish impulse.
Namaste.

Waiting for a SYS/USDT rise.If the market gives it a chance for rise, it may go up till $0.1890 it all matters how BTC and USDT.D will move. There is no buy or sell without SL.
Non financial advice.

SYSUSDT is tesating the key levelSYSUSDT is a cryptocurrency trading pair that has recently tested the 0.618 Fibonacci level inside a descending channel. The fact that the price tested this level suggests that there may be some support at this level, which could potentially lead to a price reversal.
Currently, the price is testing the breakout from the descending channel and the 4-hour supply level at the 0.18$ area. If the price breaks out above this level, it could be a signal for traders to go long on the asset.
According to Plancton's strategy , we can set a nice order
–––––
Keep in mind.
🟣 Purple structure -> Monthly structure.
🔴 Red structure -> Weekly structure.
🔵 Blue structure -> Daily structure.
🟡 Yellow structure -> 4h structure.
⚫️ black structure -> <= 1h structure.
–––––
Follow the Shrimp 🦐

SYS LONG 15M TIMEFRAMEEntry=current price
Stop loss=0.157
I will update you on progress
Have a good day

$SYSbought back some sys here
good FA should manage flipping this yellow zone soon enough
stoch reset on H4
IF anyone missed out makes sense to add some now though we may go back to 15 cents so add some and see what tomorrow brings !
sl.1988 if you fancy a short !
$SYS3rd attempt should flip resistance of 19 cents after which teleport to 24/26 zone
may not come back to retest breakout area so options are
buy now n hodl bid 1644( close above here would be bullish ) loose that 1374 my zone of interest.
buy on flip of yellow lines for a quickie and out
daily stoch curling up to cross to the upside

$SYS/#USDT [#Syscoin]: Super_TrendWe've detected a Super Trend pattern on the $SYS / $USDT chart. The Super Trend indicator is showing a bullish trend, indicating a potential trend reversal. The next resistance key levels are at 0.1862 | 0.2059 | 0.2417 and the major support zones are respectively at 0.1504 | 0.1343 | 0.0985. We may consider opening a trade position at the current price zone at 0.1769 and benefit from the trend continuation.
Technical Metrics :
Current price: 0.1769
24H Volume: 1,635,544.3380 ₮
24H Price change: 7.082%
- Pivot Points - Levels :
Resistance: 0.1862 | 0.2059 | 0.2417
Support: 0.1504 | 0.1343 | 0.0985
Indicators recommandation :
Oscillators: BUY
Moving Averages: STRONG_BUY
Technical Indicators Summary : STRONG_BUY
- In-depth SYSUSDT technical analysis on > Tradingview TA page

Syscoin (SYS) formed a bullish Cypher for upto 19% pump soonHi dear friends, hope you are well and welcome to the new trade setup of Syscoin ( SYS ) with US Dollar pair.
Previously in Dec 2022, we caught almost 90% pump of SYS coin as below:
Now on a 4-hr time frame, SYS has formed a bullish Cypher pattern for another price reversal move.
Note: Above idea is for educational purpose only. It is advised to diversify and strictly follow the stop loss, and don't get stuck with trade


Syscoin (SYS) forming bullish a Gartley for upto 20.50% moveHi dear friends, hope you are well and welcome to the new trade setup of Syscoin ( SYS ) with US Dollar pair.
Our last successful trade of SYS was as below:
Now on a daily time frame, SYS is very close to complete the final leg of a bullish Gartley pattern.
Note: Above idea is for educational purpose only. It is advised to diversify and strictly follow the stop loss, and don't get stuck with trade

SYSmmmmmm I think the chart is talking.
I still see more lower bottoms but u need to buy in parts according to plans and Financial management.
Stay safe


SYSUSDT | CONVERGING IN TRIANGLESYSUSDT has been converging with in a triangle. The price has sustained above 100MA. The price is holding horizontal support.
The bulls will only took control above break of triangle.
Manage your trade accordingly.

#sys on key resistance #sys its on resistance if it flips .2 level we can continue to .2114 and then .222 and on retest of .211 we may continue to .25
if stays below .195 we can short it to .1825 and after bounce, on rejection we can short it again to .1650

Syscoin (SYS) about to complete Shark | A good buy opportunityHi dear friends, hope you are well and welcome to the new trade setup of Syscoin ( SYS ) with US Dollar pair.
Previously we had a nice trade of SYS:
Now on a 4-hr time frame chart, SYS is about to complete the final leg of bullish Shark.
Note: Above idea is for educational purpose only. It is advised to diversify and strictly follow the stop loss, and don't get stuck with trade

SYSUSDT MACD is showing bullish EMAs showing a bullish moveRSI is bearish and We have a falling wedge pattern and a strong support that's give us a bullish move buy and hold it in swng trade
targets set at the chart

SYSUSDT
(SWING TRADE)
We have a falling wedge pattern and a strong support that's give us a bullish move buy and hold it in swng trade MACD is showing bullish
EMAs showing a bullish move
RSI is bearish
targets set at the chart

SYSUSDT | UPSIDE POTENTIAL SYSUSDT has been trading above the horizontal resistance. The price previously get rejected from same zone. The price has printed inverse head and shoulder pattern too on chart. The upside target can be 0.618 and 0.78 fib level. The bulls need to sustain above the 0.50 fib level. One can take long position with stop loss below the right shoulder . While failure to break the resistance zone will be all over for bulls.
Manage your trades accordingly.

$SYS - attempting to break badabout time this melted some faces , flip this yellow line should teleport quick to .24

SYS/USDT TRADE ENTEREDNice inverse head and shoulders formation on SYS with a close above resistance. Along with BTC & APE longs we have entered SYS to complete our swings here.
