SYS | Another Old School CoinSince all oldschool coins are pumping right now, Syscoin might be another good one for quick gains. Just remember this is only for short-term trading - don't hold these coins for long.
Market insights

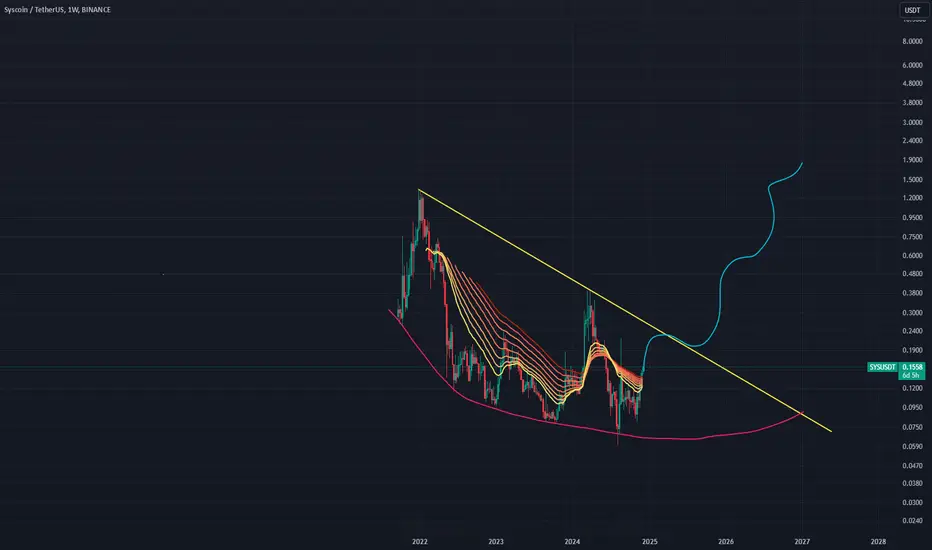
SYS USDT parabolic growth approachingSYS USDT pair are entering a parabolic growth stage. Upward movement can be violent and reach its prior ATH at 1.35 USD after which SYS can head into price discovery
SPOT SYS LONG 27.11.2024🎯Purpose:
0,1773
‼️We enter at 0.5% of the allocated money for spot trading.

Syscoin UpdateSyscoin initial bullish breakout was explosive. This pair, SYSUSDT, grew more than 265% in a matter of days after the early August bottom low. This initial breakout produced a correction and this correction ended in a higher low. In this higher low territory consolidation was taking place. We can say the consolidation is over because Syscoin is now moving above MA200 on the daily timeframe.
A new jump will produce a new high compared to August 19. That is because we have a higher low and higher lows lead to higher highs, and, of course, the Cryptocurrency market right now is ultra-bullish.
This opens up a new question: How far up will it go?
Long-term, it will go really, really high, but short-term, the next target can be seen on the chart.
I would say around 0.5800.
This is a quick and simple update.
Thank you for reading.
Namaste.

SPOT SYS LONG 24.11.2024🎯Purpose:
0,1476
‼️We enter at 0.5% of the allocated money for spot trading.

Trading opportunity for SYSUSDTBased on technical factors there is a Buy position in :
📊 SYSUSDT
🔵 Buy Now
🪫Stop loss 0.1000
🔋Target 1 0.1500
🔋Target 2 0.2000
🔋Target 3 0.2500
💸RISK : 1%
We hope it is profitable for you ❤️
Please support our activity with your likes👍 and comments📝

SYS Gold Buy opportunity, same Cycle with 0.22XX is loading SYSCOIN (SYS) has recently experienced a bounce from the bottom, but it's important to be cautious about its future direction.
Key Technical Analysis:
* Fakeout: The last pump was above the $0.117X level could be considered a fakeout, as the price has since retraced to the $.0970 Monthly support level.
* Potential Correction: A deeper correction towards the 0.08XX support levels is possible.
Remember:
* Do Your Own Research: Always conduct thorough research before making any investment decisions.
* Risk Management: Use stop-loss orders to protect your investments from potential losses.
* Diversification: Spread your investments across different assets to reduce risk.
Stay tuned for more updates on Radicle and other cryptocurrencies!
Disclaimer: This is not financial advice. Please do your own research before making any investment decisions.
TRY TO HAVE AN ADVENTAGE And DCA from here

Trade Signal for SYSUSDTAttention traders! A new trade opportunity has been identified for SYSUSDT, presenting a potential sell position. Please find the details of this recommendation below:
Direction: Sell
Enter Price: 0.1063
Take Profit: 0.10146667
Stop Loss: 0.11166667
This trade signal has been generated using the EASY Quantum Ai strategy, which leverages advanced algorithms to analyze historical price data, market trends, and volatility patterns. Our analysis shows a bearish trend forming in SYSUSDT, driven by a confluence of market factors.
The primary factor supporting this forecast is a significant resistance level observed around the current market range. The resistance suggests a likely downturn as the price tests this level. Additionally, momentum indicators such as the Relative Strength Index (RSI) and Moving Average Convergence Divergence (MACD) are signaling overbought conditions, indicating a potential price reversal.
Finally, our analysis includes recent market sentiment and macroeconomic conditions that may exert downward pressure on this pair, further supporting a decrease in price.
As always, ensure you conduct your own due diligence and align this signal with your risk tolerance and trading strategy. Happy trading!

#SYS/USDT is heading towards the Diagonal Trendline in 1-Hour TF#SYS/USDT is heading towards the Diagonal Trendline in 1-Hour TF!
MIL:SYS needs to clear the Trendline to turn bullish. The local resistance level is PWH $0.1054 and the support level is PWL $0.0947.


SYS buy/long setupWe have a bullish QM on the chart. Bullish QM features are well observed on the chart.
By maintaining the green range, it can move towards the targets.
Closing a daily candle below the invalidation level will violate the analysis
For risk management, please don't forget stop loss and capital management
When we reach the first target, save some profit and then change the stop to entry
Comment if you have any questions
Thank You

SYSUSDT Buy opportunitySYS/USDT is showing a strong megaphone pattern, with the price currently testing the support level, making this a potential accumulation zone for a long position. Following the profit path outlined on the chart is advisable, but be aware that this formation could break in either direction depending on the overall market conditions.
A stop-loss is recommended—trade cautiously.


Sys / Usdt BINANCE:SYSUSDT
Certainly! Here’s a simplified explanation of your analysis:
### **Current Situation:**
- **Price:** 0.1065
### **If the Price Holds:**
- **Next Resistance Level:** 0.1162
- If the price remains stable around 0.1065, the next significant level to watch is 0.1162. This is where the price might encounter resistance or struggle to move higher.
### **If the Price Falls:**
- **Support Levels:** 0.090 and 0.060
- If the price doesn’t hold at 0.1065 and starts to drop, 0.090 and 0.060 are key levels where the price might find support. These levels could act as a cushion, potentially preventing further declines.
### **Bullish Outlook:**
- **Potential Uptrend Targets:** 0.143 and 0.170
- If the price continues to rise and shows a bullish trend, the next target levels could be 0.143 and 0.170. These are higher levels where the price might aim to move if the bullish momentum persists.
### **Disclaimer:**
- **Note:** This is not financial advice; it’s an analysis based on current price levels and potential future movements.

$SYS.P$SUI.P
Long position with stop loss around -5.5% from 1st entry
Please DYOR before take a position.
Always use your stop loss and manage your own risk !!!

SYSUSDT(Syscoin) Updated till 19-08-24SYSUSDT(Syscoin) Daily timeframe range. it had a huge retrace from its local low. but selling pressure took over and failing to takeover above 0.1470 will trap above level bag holders. staying over 0.1470 can give PA another chance to push. recent support at 0.1006.

SYS / USDTBINANCE:SYSUSDT
Given the current price of 0.1621, it's essential to monitor key levels for potential market movements. If the price remains above 0.1621, the next significant resistance zone to watch is at 0.2103. Resistance levels are areas where selling pressure tends to increase, making it challenging for the price to continue rising. If the price approaches 0.2103 and struggles to break through, it might face a reversal or consolidation. A successful breach and sustained move above 0.2103 could signal a continuation of the upward trend and open the door for further gains.
On the other hand, if the price fails to hold above 0.1621 and begins to decline, it will test lower support levels. The first support level to monitor is 0.1333. Support levels are points where buying interest typically emerges, potentially halting the price decline. If the price falls below 0.1333, the next support to consider is 0.1111. A drop below 0.1111 would indicate significant bearish sentiment and could lead to further declines. Traders use these levels to gauge market direction and make informed decisions about buying or selling based on price action at these critical points.
Disclaimer : I am not Financial Adviser

Syscoin Massive Bullish Breakout Confirmed (Short-Term Move Map)Look at the volume on the last two candles... This is the start of a strong bullish wave. This high volume on the daily timeframe fully confirms so. We are looking at SYSUSDT.
You can find the SYSBTC trade-idea with 1,500% potential mapped —here .
Now, this is only a short-term move shown here but it can give much more. Seeing the strength of the correction, the fact that it went beyond 100% compared to the previous low, means that all weak hands have been removed and thus no sellers. (Now, after a rise corrections can always develop...)
Since an all-time low has been hit recently, 5-Aug., it is likely this is the start of a major bullish phase. Or it can turn out to be a strong bull-trap, a small wave to trap bulls before a major crash... It is early but trading opportunities will continue to develop. Timing and discernment is key.
The altcoins market is heating up.
We will see this pattern repeating all across, over and over, again and again.
Thank you for reading.
Namaste.

#SYS/USDT#SYS
The price is moving within a bearish channel pattern on a 4-hour frame and broke it upward after adhering to it significantly.
We have a downtrend on the RSI indicator, and it has been broken to the upside, and we have a trend to hold above
We have a major support level in green at 0.1020
We have a trend of domes above the Moving Average 100
Entry price is 0.1050
The first target is 0.1116
The second target is 0.1170
The third goal is 0.1220

Syscoin, to revolutionize the uses of BitcoinSYS/USDT (Syscoin)
Sector: Bitcoin Ñodular Execution Layer
Market Cap: $150M
The Syscoin project aims to revolutionize Bitcoin by using its security model to build an execution layer on top of it and make it possible to build decentralized applications on top of Bitcoin. The project dates back to 2015 and is highly technical, but the team has never stopped building since the launch, and the project has always managed to break its capitalization records with each new cycle.
Graphically, we are on very interesting levels as we are retesting resistance levels in the accumulation range that formed during the Bear Market. And we still had a nice surge at the beginning of the year, testifying that investors are interested in the project

#SYS/USDT#SYS
The price is moving in a descending channel on a 1-hour frame, about to break to the upside
With a strong support area in green at 0.2000, from which the price has already rebounded
We have a trend to touch the Moving Average 100
We also have an uptrend on the RSI on which the price rests and pushes it upward
Entry price is 0.2066
The first target is 0.2200
The second target is 0.2400
The third goal is 0.2567

Syscoin | The Same Pattern Repeats; 333% Is Easy!Can you see the similarity of this chart with the many other Altcoins I've been sharing with you?
Sometimes I repeat the same drawings so the similarities are easy to see.
➖ First, this tells us that the entire market is connected; what one does, the rest follows.
➖ Second, this confirms that many pairs are set to turn green. Super green.
Bullish signals
➖ Three consecutive green candles.
➖ Trading above EMA50.
➖ Bullish Altcoins market.
➖ After years of consolidation it is no surprise if we see growth.
➖ Bitcoin near its All-Time High is always bullish for the Altcoins.
Potential goes like this:
1) 120% (Easy)
2) 225% (Easy)
3) 329% (Easy)
It can easily go higher because these targets are all easy.
Namaste.

