Buy Trade Plan — National Agricultural Development Co. (6010)Yes in the daily timeframe here, a Dealing Range (DR) is clearly formed.
Price created a recent swing low, then pushed up, broke short-term structure, and is now consolidating just above that breakout point. This DR acts as your context area for the bullish continuation toward the previous swing h
Next report date
—
Report period
—
EPS estimate
—
Revenue estimate
—
2.59 SAR
774.63 M SAR
3.24 B SAR
219.36 M
About NATIONAL AGRICULTURAL DEVELOPMENT CO.
Sector
Industry
CEO
Sulaiman bin Abdulaziz Al-Twaijri
Website
Headquarters
Riyadh
Founded
1981
ISIN
SA0007879568
FIGI
BBG000H2RG10
National Agricultural Development Co. engages in agricultural and dairy food processing. Its products include dairy, milk, cheese, juices, desserts, and other related food. The firm operates through the Diary and Food, and Agriculture segments. National Agricultural Development was founded on August 18, 1981 and is headquartered in Riyadh, Saudi Arabia.
Related stocks

Long for Nadec The chart is bullish if we don’t close below 27. With possibility for new all time highs.
Disclaimer:
This is not a call to buy the stock

Different PatternsRecently made HH HL on Bigger TF.
Breakout Re-test possible around 21.50 - 22
Otherwise, Trendline Support around 24.80 - 26
Upside Targets can be around 28.50 - 29 & then 31+

Gann Analysis for NATIONAL AGRICULTURAL DEVELOPMENT Co. (TADAWUL1️⃣ Key Gann Levels Identified
The Gann levels shown in the chart act as support and resistance zones, where price movement often reacts. Below are the key levels:
Degree Price Level (SAR) Significance
720° 41.654 Major Resistance
630° 35.45 Strong Resistance
540° 29.746 Medium Resistance
450° 24.5

National Agriculture Company 6010
## **Trading Plan: National Agriculture Company**
#### **Concept**: SMC (Smart Money Concepts)
**Key Focus**: Perplution Order Block + Break of Structure (BOS)
---
#### **Market Context**:
1. **Daily/4H Analysis**:
- Identify a bullish/bearish **market structure**.
- Look for the

6010 NADECHello traders,
The National Agricultural Development Company (NADEC) is one of the clear companies in Saudi market.
Now: 29
with stop loss: 28
and the next target is 32.6 SAR.
Good luck for all

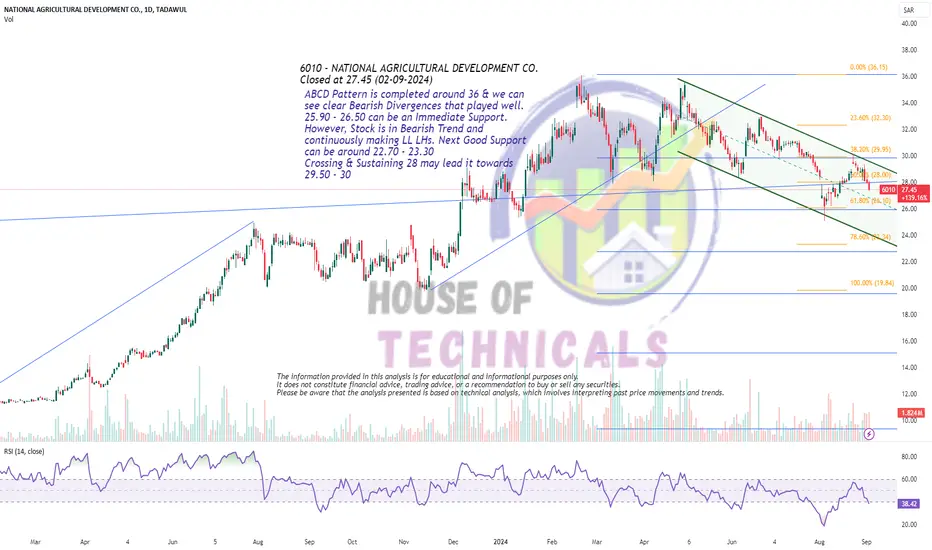
ABCD Pattern is completed around 36ABCD Pattern is completed around 36 & we can
see clear Bearish Divergences that played well.
25.90 - 26.50 can be an Immediate Support.
However, Stock is in Bearish Trend and
continuously making LL LHs. Next Good Support
can be around 22.70 - 23.30
Crossing & Sustaining 28 may lead it towards
29.5
LL on Daily TFTo Continue the Bullish Trend,
it should cross & sustained 36.10; the target
would then be around 44 - 45.
Recently, it made a LL on Daily TF.
Now 32.60 - 33 should be Sustained, otherwise
the price will move further down towards
29.80

Bullish on Bigger Time Frames
However, Bearish Divergence is also
Observed on Weekly TF
ABCD pattern completes around 35 - 36 along-with
bearish divergence makes this level bit shaky at the
moment for new entrants.
32 - 33 Levels may act as Support but we Need
some Confirmation there.
However, Crossing & Sustain 36 would m

6010| NATIONAL AGRICULTURAL DEVELOPNATIONAL AGRICULTURAL DEVELOP
Nadec
New ATH!
Next targets at 40> 55> 70>90>105 SR(250%)
Good luck!
Please dont forget to boost, comment and like!

See all ideas
Summarizing what the indicators are suggesting.
Neutral
SellBuy
Strong sellStrong buy
Strong sellSellNeutralBuyStrong buy
Neutral
SellBuy
Strong sellStrong buy
Strong sellSellNeutralBuyStrong buy
Neutral
SellBuy
Strong sellStrong buy
Strong sellSellNeutralBuyStrong buy
An aggregate view of professional's ratings.
Neutral
SellBuy
Strong sellStrong buy
Strong sellSellNeutralBuyStrong buy
Neutral
SellBuy
Strong sellStrong buy
Strong sellSellNeutralBuyStrong buy
Neutral
SellBuy
Strong sellStrong buy
Strong sellSellNeutralBuyStrong buy
Displays a symbol's price movements over previous years to identify recurring trends.
Frequently Asked Questions
The current price of 6010 is 21.29 SAR — it has increased by 0.95% in the past 24 hours. Watch NATIONAL AGRICULTURAL DEVELOPMENT CO. stock price performance more closely on the chart.
Depending on the exchange, the stock ticker may vary. For instance, on TADAWUL exchange NATIONAL AGRICULTURAL DEVELOPMENT CO. stocks are traded under the ticker 6010.
6010 stock has fallen by −0.75% compared to the previous week, the month change is a 1.77% rise, over the last year NATIONAL AGRICULTURAL DEVELOPMENT CO. has showed a −27.83% decrease.
We've gathered analysts' opinions on NATIONAL AGRICULTURAL DEVELOPMENT CO. future price: according to them, 6010 price has a max estimate of 29.80 SAR and a min estimate of 23.90 SAR. Watch 6010 chart and read a more detailed NATIONAL AGRICULTURAL DEVELOPMENT CO. stock forecast: see what analysts think of NATIONAL AGRICULTURAL DEVELOPMENT CO. and suggest that you do with its stocks.
6010 reached its all-time high on Feb 20, 2024 with the price of 36.05 SAR, and its all-time low was 3.38 SAR and was reached on Jan 1, 2004. View more price dynamics on 6010 chart.
See other stocks reaching their highest and lowest prices.
See other stocks reaching their highest and lowest prices.
6010 stock is 1.69% volatile and has beta coefficient of 1.33. Track NATIONAL AGRICULTURAL DEVELOPMENT CO. stock price on the chart and check out the list of the most volatile stocks — is NATIONAL AGRICULTURAL DEVELOPMENT CO. there?
Today NATIONAL AGRICULTURAL DEVELOPMENT CO. has the market capitalization of 6.36 B, it has increased by 3.43% over the last week.
Yes, you can track NATIONAL AGRICULTURAL DEVELOPMENT CO. financials in yearly and quarterly reports right on TradingView.
NATIONAL AGRICULTURAL DEVELOPMENT CO. is going to release the next earnings report on Oct 20, 2025. Keep track of upcoming events with our Earnings Calendar.
6010 net income for the last quarter is 115.26 M SAR, while the quarter before that showed 103.42 M SAR of net income which accounts for 11.45% change. Track more NATIONAL AGRICULTURAL DEVELOPMENT CO. financial stats to get the full picture.
No, 6010 doesn't pay any dividends to its shareholders. But don't worry, we've prepared a list of high-dividend stocks for you.
As of Aug 25, 2025, the company has 4.85 K employees. See our rating of the largest employees — is NATIONAL AGRICULTURAL DEVELOPMENT CO. on this list?
EBITDA measures a company's operating performance, its growth signifies an improvement in the efficiency of a company. NATIONAL AGRICULTURAL DEVELOPMENT CO. EBITDA is 702.18 M SAR, and current EBITDA margin is 22.10%. See more stats in NATIONAL AGRICULTURAL DEVELOPMENT CO. financial statements.
Like other stocks, 6010 shares are traded on stock exchanges, e.g. Nasdaq, Nyse, Euronext, and the easiest way to buy them is through an online stock broker. To do this, you need to open an account and follow a broker's procedures, then start trading. You can trade NATIONAL AGRICULTURAL DEVELOPMENT CO. stock right from TradingView charts — choose your broker and connect to your account.
Investing in stocks requires a comprehensive research: you should carefully study all the available data, e.g. company's financials, related news, and its technical analysis. So NATIONAL AGRICULTURAL DEVELOPMENT CO. technincal analysis shows the buy rating today, and its 1 week rating is sell. Since market conditions are prone to changes, it's worth looking a bit further into the future — according to the 1 month rating NATIONAL AGRICULTURAL DEVELOPMENT CO. stock shows the neutral signal. See more of NATIONAL AGRICULTURAL DEVELOPMENT CO. technicals for a more comprehensive analysis.
If you're still not sure, try looking for inspiration in our curated watchlists.
If you're still not sure, try looking for inspiration in our curated watchlists.