TAO CHARTThis is a simple chart share of a TAO chart so that I can upload it to chatgpt. Anyone else can use it for the same reason
Trade ideas
TAO CHARTThis is a simple chart share of a TAO chart so that I can upload it to chatgpt. Anyone else can use it for the same reason
TAO 1hr This is a tao 1 hr chart that can be used for uploading to chatgpt or any other technical analaysis AI

TAO BINACNE This is a TAO chart on Binance. I want to publish this chart so that anyone who would like to upload to chatgpt can do so

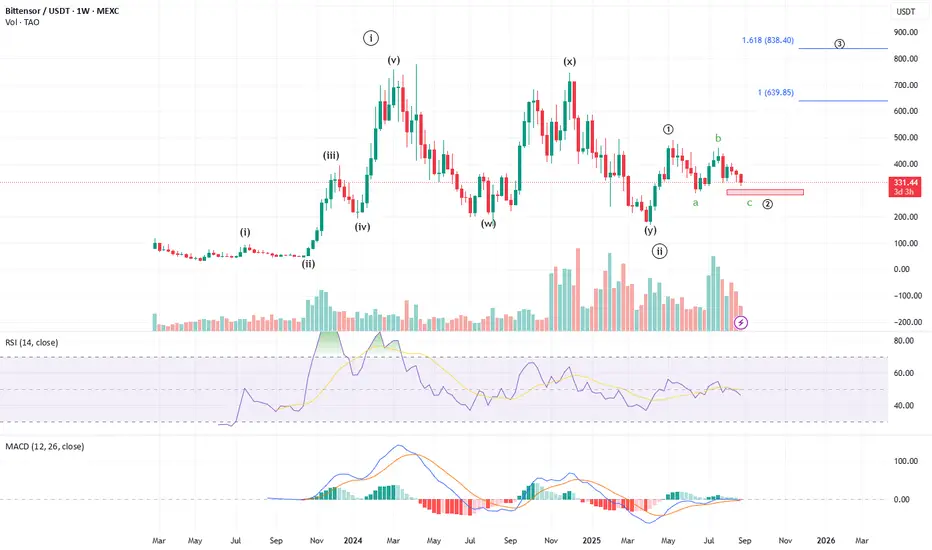
TAO Potential Final Dip Before BreakoutTAOUSDT is forming a potential inverse head and shoulders pattern after forming a strong double bottom around the macro low, confirming a major accumulation structure. The recent 5-wave rally into the neckline zone suggests early signs of bullish momentum, with the current pullback forming the potential right shoulder of the pattern.
It's expected the Price to revisit the immediate buy back zone, which sits just above the internal demand zone. A bullish reaction from this region could trigger the next impulsive wave toward the neckline breakout level and beyond.
Short-term target remains at $748, while the full structure projects a final setup target around $1,434. As long as price respects the internal demand zone, this correction is viewed as healthy within the larger bullish cycle.

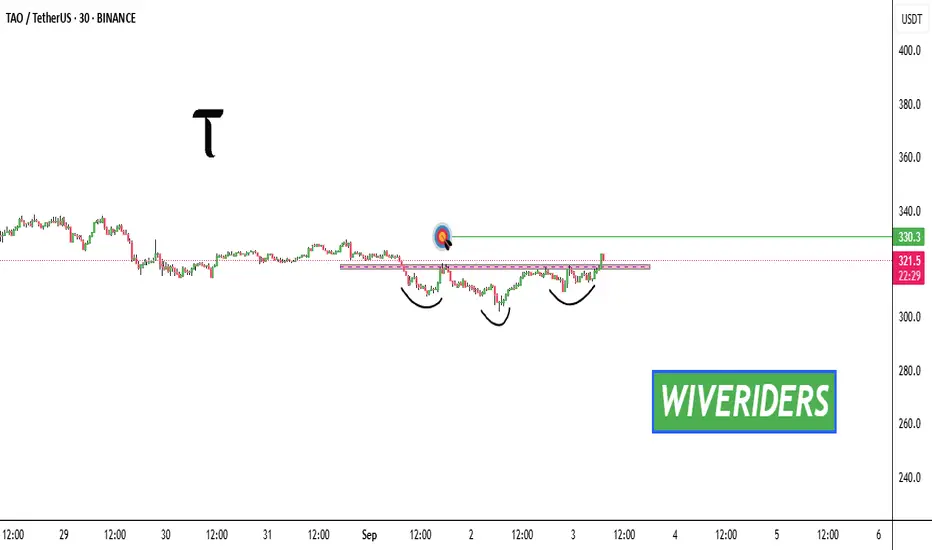
TAO Bullish Pattern Alert!🚨 GETTEX:TAO Bullish Pattern Alert! 🚨
GETTEX:TAO has formed an inverted Head & Shoulders pattern 🟢
👉 If it plays out, the first target will be the green line level 🎯
⚠️ Key point: Pattern confirmation is crucial — wait for breakout above the neckline.
👉 A confirmed move signals strong bullish continuation with buyers taking control ✅
TAO — Fade the Rips, Catch the Sweeps (300–345 Range)Bittensor is bleeding slowly around ~314, trapped between 300–305 support and 335–345 resistance. The 12H structure looks limp, and orderflow is painting the bears in bold.
Structure (12H)
• Weak trend drifting lower.
• Support: 300–305. Resistance: 335–345.
Orderflow + Derivatives
• OI heavy on Binance/Bybit.
• CVD sharply negative → sellers dominate.
• Funding mixed.
Scalp Scenarios
• Short Idea (Grade A): Reject 335–345 resistance → fade back to 320 → 310.
• Long Idea (Grade B): Sweep 298–305 lows, reclaim 308 → push to 335.
Conclusion
TAO’s script is clear: shorts at the ceiling, longs only if the floor gets a dramatic sweep. Otherwise, it’s a drip-drip market that rewards patience.
🐺 Trade safe, stay sharp, and remember: the market hunts sheep, not wolves.

TAO/USDT LONG BIAS COUNT EWT on the daily confluences using ewt if my count is correct
we are approaching on wave 3 at price key point around 316.95
conservative entry
with the stop loss @273 as acting my invalidation
targetting @924 preice level
but this is only my own projection for this pair your perspective and other count for this technical analysis is very welcome… t.y
by the way im not a financial advisor or any im just a student in this kind of market
BYBIT:TAOUSDT.P

TAO/USDT – Demand Zone: Potential Double Bottom or Breakdown🔎 Market Overview
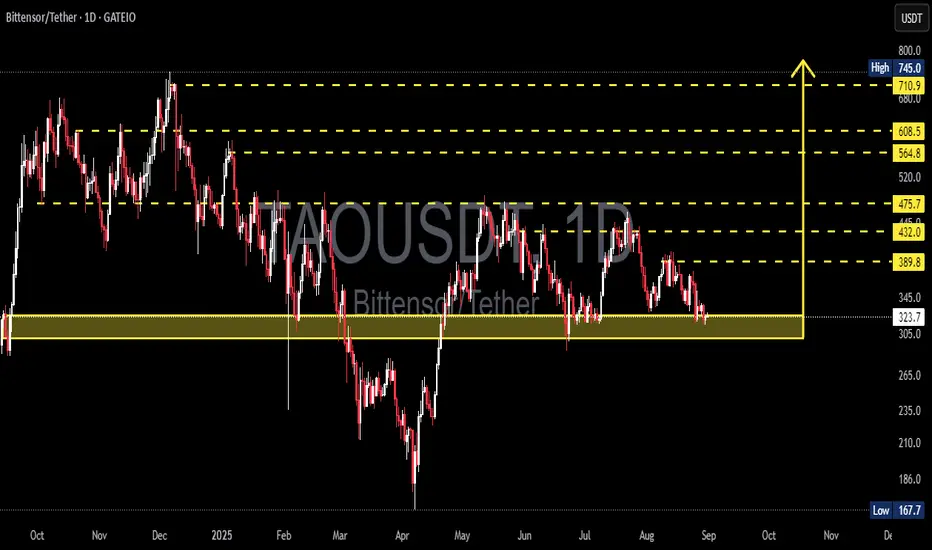
TAO/USDT is currently trading around 324 USDT, sitting right inside the key demand zone (305–345) that has been tested multiple times since late 2024. This area has repeatedly acted as a strong defensive wall for buyers, and once again the market is waiting for a big decision: bounce or breakdown.
From April to August 2025, the chart shows a series of lower highs, reflecting continued selling pressure. However, the repeated defense of this demand zone suggests accumulation is possible if a strong bullish reaction appears.
---
🧩 Price Structure & Pattern
Current pattern: Consolidation within the demand zone (305–345).
Key characteristics:
Buyers have successfully defended this level multiple times → potential accumulation area.
Larger structure still shows minor downtrend (lower highs).
A confirmed breakdown could trigger deeper sell-offs.
In short, this is the battle zone between bulls and bears that will determine the medium-term direction.
---
📈 Bullish Scenario
If price holds and bounces from the demand zone:
Confirmation: Daily bullish candle closing above 345–350 with strong volume.
Upside targets:
🎯 TP1: 389.8 (first resistance & short-term supply zone)
🎯 TP2: 432.0 (mid-term supply zone)
🎯 TP3: 475.7 (major resistance – key to shift medium-term trend)
🎯 Extensions: 564.8 – 608.5 – 710.9 – 745.0
➡️ A successful bounce could form a double bottom / base formation.
---
📉 Bearish Scenario
If price fails to hold the demand zone (daily close below 305):
Confirmation: Breakdown candle with strong volume + failed retest.
Downside targets:
🎯 265 – 235 (nearest supports)
🎯 167.7 (historical low – potential final target if strong selling pressure continues)
➡️ This would form a major support breakdown, potentially triggering a larger distribution phase.
---
⚖️ Technical Conclusion
Current bias: Neutral to Bearish – downtrend structure remains, but bulls are still defending.
305–345 is the make-or-break zone.
Bounce → potential rally towards 389–475.
Breakdown → possible drop to 235 or even 167.
---
🛡️ Risk Management Notes
Clear stop-loss levels:
Bullish setup: SL below 305.
Bearish setup: SL above 345–350 after breakdown.
Scale into positions rather than going all-in.
Watch for volume confirmation & momentum indicators (RSI/MACD) to avoid false breakouts.
---
📌 Extra Insights
The 305–345 zone is not only a technical level but also a psychological price floor, tested multiple times.
The structure of lower highs vs. strong support often resolves with a major breakout — meaning the next move could be very aggressive.
Patience is key: traders should wait for a clear daily close confirmation before entering to avoid being trapped in a fake move.
#TAO #Bittensor #TAOUSDT #CryptoAnalysis #TechnicalAnalysis #SupportResistance #Breakout #CryptoTrading #SwingTrading #PriceAction
Is TAO trying to enter in 3rd wave rally?A clear 5 wave upside and 3 wave downside which is a impulsive scenario next move of TAO is anticipated as 3rd wave rally.Price should maintain above 168.
TAO flagging out. TAO is forming a playable structure. A flag here will likely turn into a continuation. If not, invalidation his clear. The accumulation zone below is a BTD opportunity. Accumulation time is now.
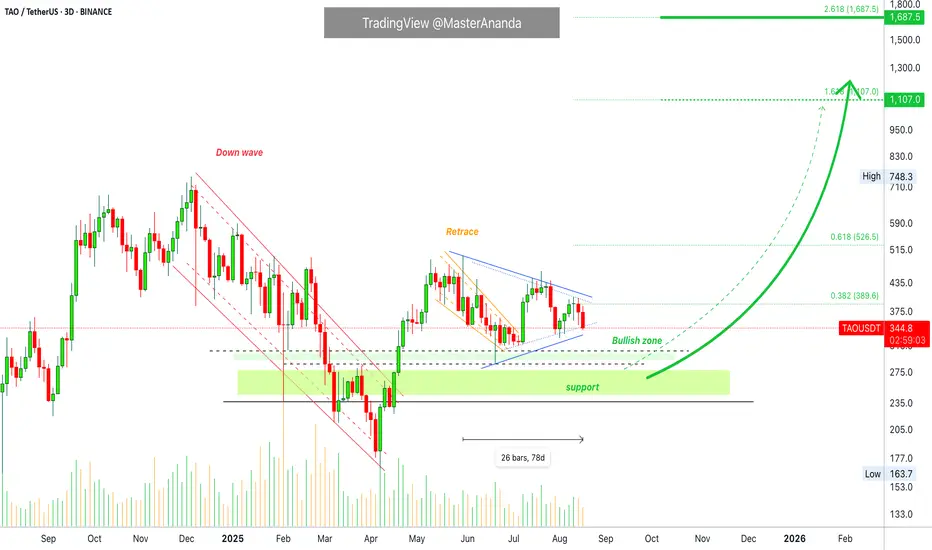
Bittensor (TAO) Update · Bullish Zone, Retrace & Higher HighBittensor peaked 31-May. This means the project has been sideways now for 78 days. First a retrace and now sideways.
The chart setup overall looks good. The main low happened in April and here the bulls enter the game. We see the end of the downtrend, no new lows. The current retrace has no bearish force and it seems to be running its end. When volume stars to dry and the action becomes flat, a strong breakout follows.
The breakout can be in any direction. We are bullish because the main move is the recovery from April and this recovery is being consolidated. When the consolidation ends we get a continuation which is an advance from my vantage point.
There can be a drop. The drop can be mild or small before growth. There is room for prices to fluctuate. Even with a small drop, or large, TAOUSDT will remain above support and within the bullish zone.
A sudden drop would signal the end of the sideways period and the start of the next bullish wave. If there is no drop the market starts to turn slowly and prints a very big green after 3-5 days up.
We are getting very close now to the next breakout, I am thinking between 5-7 days. Next week for sure we will see the market grow. It is already growing based on the bigger picture, but the last advance is still being consolidated marketwide. This is the phase that is coming to its end. Some pairs did move forward but took a pause with Bitcoin's retrace. This is a small pause. Growth follows next.
Namaste.
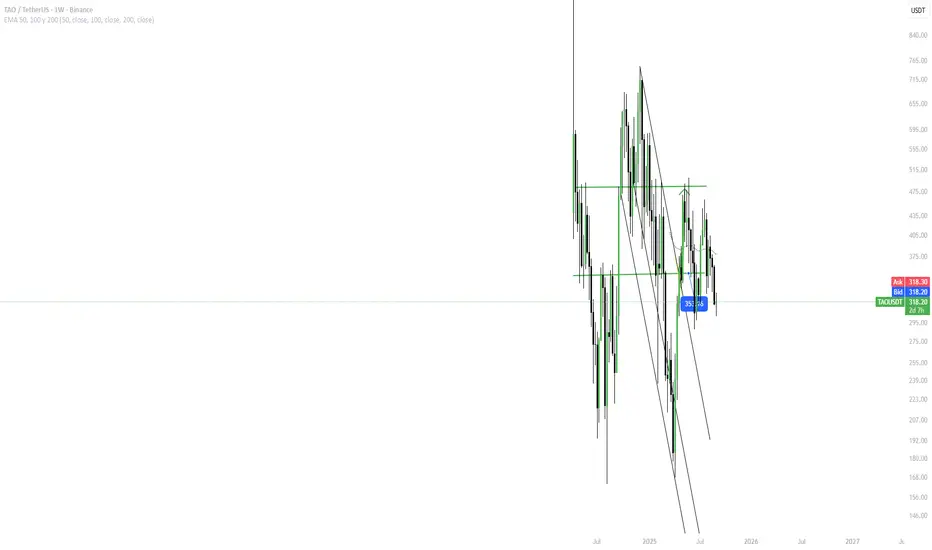
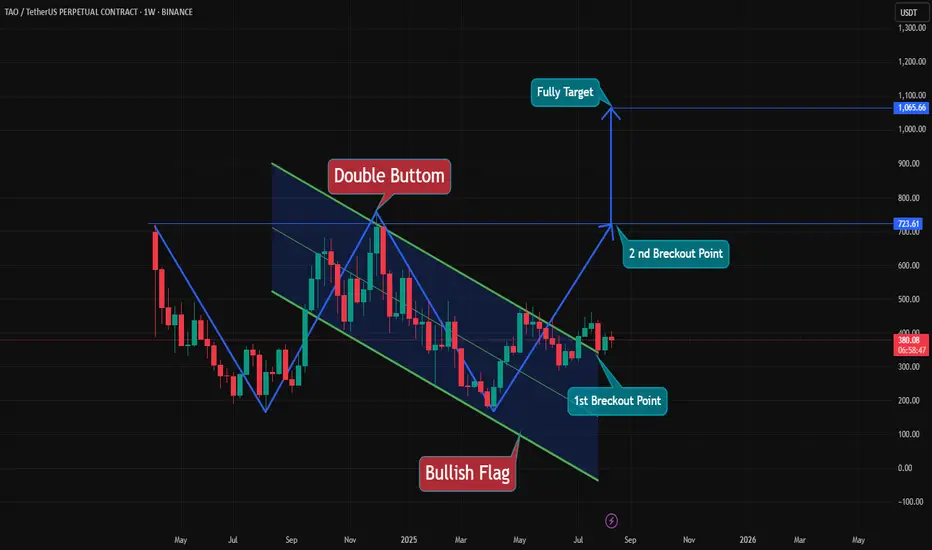
TAO 1W chart has a Bullish Flag pattern that has been broken#TAO 1W chart has a Bullish Flag pattern that has been broken. It is likely to rise to $723. 🔼🔼
👀 When the market reaches the $723 level, 👀 it shows a double bottom pattern. If it also breaks out, it can rise to $1060.🔼
💵 Tp 1 : $ 443
💵 Tp 2 : $ 499
💵 Tp 3 : $ 575
💵 Tp 4 : $ 723
💵 Tp 5 : $ 1060
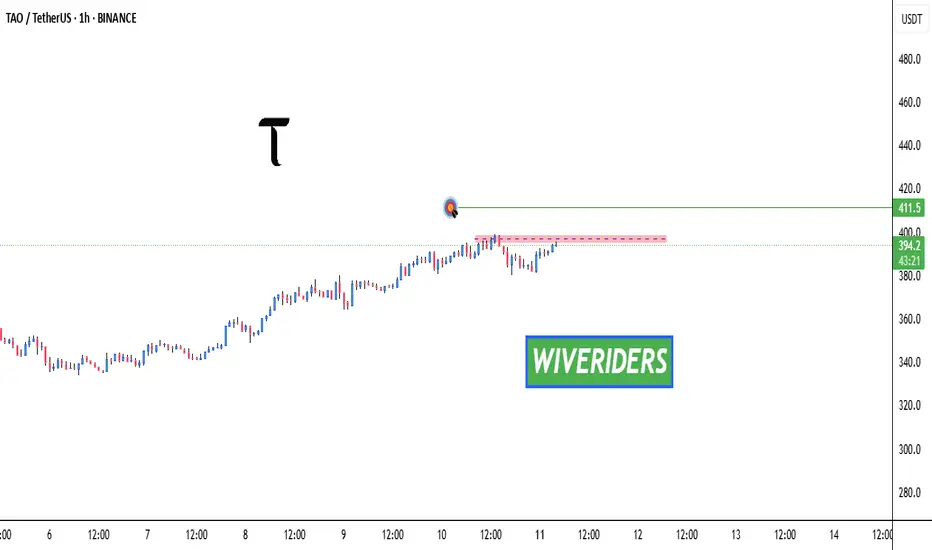
TAO Breakout Watch – Red Resistance Being Tested!🚨 TAO Breakout Watch – Red Resistance Being Tested! 🔴⏳
TAO is testing the red resistance zone.
📊 If breakout confirms, next move could target:
🎯 First Target → Green line level
A breakout could trigger bullish continuation and upside momentum.
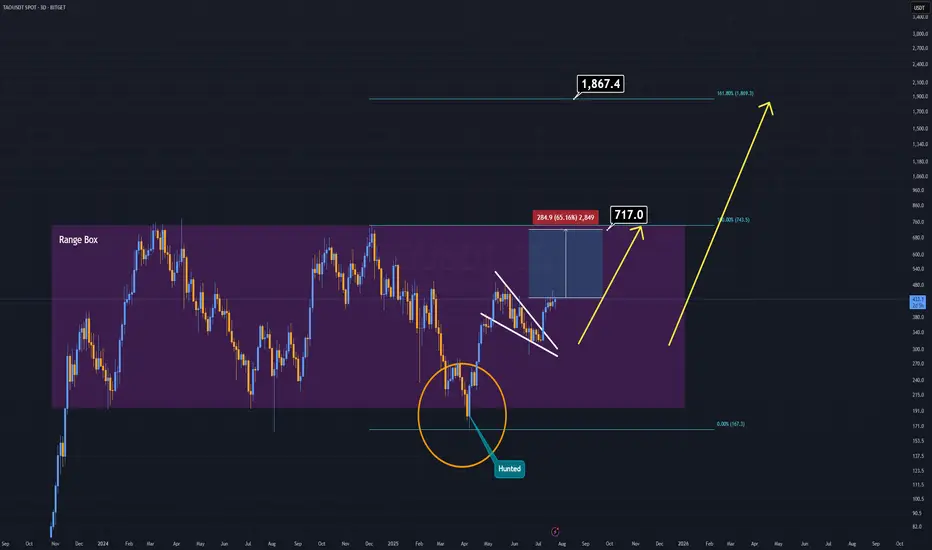
TaousdtThe volume profile on this chart along with other macro factors suggest we extend to the 1.618 at some point
(Probably q4)
~171%
There would be potential for price acceptance at these levels aswell and eventual continuation given the fundamentals of this one.. could easily be a multi cycle coin...

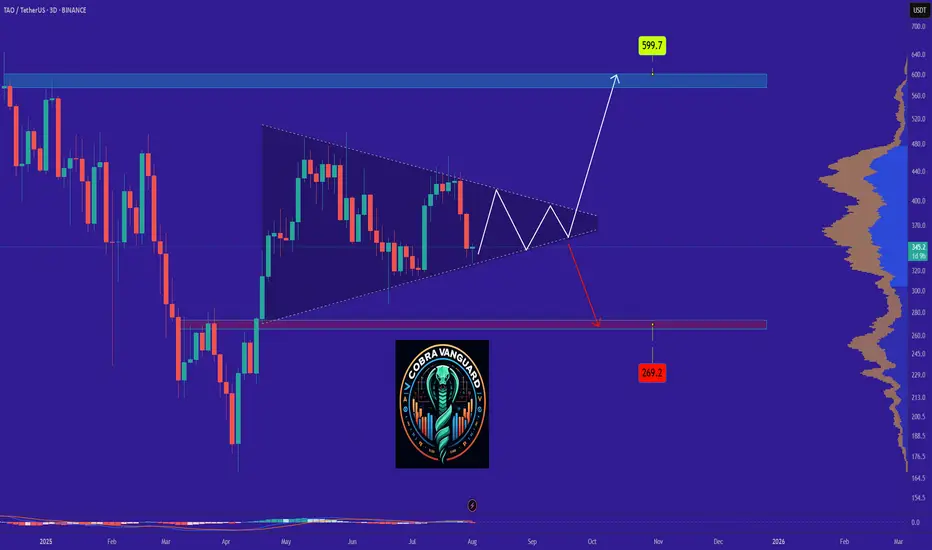
TAO - Time to buy again!The triangle pattern will break in the direction it is breached, and the price will move in that direction. In my opinion, the price could be bullish and may up to $600.
TAO LONGFollowing a significant decline, the asset will take support and bounce back from this point.
Disclaimer: This is not financial advice.
This algorithm provides highly precise buy and sell signals with alerts:

TAO | #1D — One More Leg Up Before Major CorrectionStep-by-Step Scenario:
Current Context:
Price is consolidating above the 373–382 support (blue box) after a strong impulse from June lows. This zone aligns with a major HTF demand and retest of the recent breakout.
Expected Move:
Base Case: Holding the 373–382 zone triggers a new leg higher toward the $500 supply area.
Upside Target: $500+ (main target), with interim resistance at $440–460.
Trigger: Look for strong 1D closes above 401 for confirmation, or a quick dip and reclaim of 382 for entries.
Timing:
Expect the final move up to play out into late August. Watch for momentum and trend exhaustion as we enter September.
Major Correction Risk:
If price stalls or forms an SFP at $500 or in upper supply, look to reduce exposure and prepare for a multi-week/month correction.
Breakdown below 373 (especially daily close) invalidates the bullish scenario and may accelerate a correction back to 320–260.
Why:
The market structure remains bullish above support.
Still running on strong narrative/momentum, but approaching key supply zones and cycle timing.
Macro risk: Many alts (including TAO) could top as Q3 ends, mirroring historical cycles.

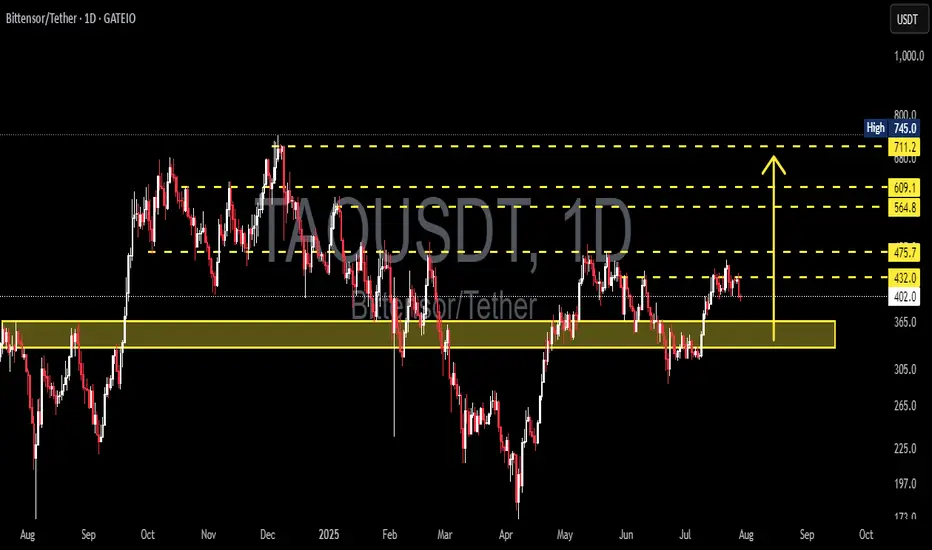
TAO/USDT: Price Likely to Retest Key Support Block 330–365 USDT?🟨 Key Zone: Yellow Support Block (330 – 365 USDT)
This zone has served as a major demand area since May 2025, acting as the base for the recent bullish move toward 475 USDT.
It represents a strong accumulation zone, where significant buying interest previously stepped in.
Given the current rejection from the 475 resistance, price is likely to revisit this block to test buyer interest and liquidity.
---
📉 Bearish Scenario: Breakdown Risk
After failing to break above 475.7 USDT, price shows signs of a short-term correction.
If bearish momentum continues:
🔽 A retest of the yellow support zone (330–365 USDT) is highly probable.
If this zone fails to hold:
📉 Next downside targets:
305 USDT – previous local low
265 USDT – next major demand level
A breakdown of the yellow block would invalidate the current bullish structure and open a new bearish leg.
---
📈 Bullish Scenario: Successful Retest and Bounce
If the price retests the yellow zone and forms a strong bullish reaction:
Confirmation signals:
Bullish reversal candles (hammer, bullish engulfing, etc.)
Increasing volume near the support zone
A successful retest could lead to:
✅ Continuation of the bullish trend
✅ Higher-low structure remains intact
Upside targets:
432 USDT – minor resistance
475.7 USDT – strong resistance zone
564.8, 609.1, and up to 711–745 USDT – extended targets
---
📌 Key Technical Levels:
Level Significance
330–365 USDT 🔲 Yellow Support Block / Demand Zone
432 USDT Minor Resistance / Previous Breakout
475.7 USDT Major Resistance (Recent Rejection)
564.8 USDT Mid-Term Resistance
609.1 USDT Next Key Resistance
711–745 USDT Long-Term Target / Supply Zone
305 USDT Support if Breakdown Happens
265 USDT Next Demand Zone Below
---
📊 Structure & Market Behavior:
No clear classic pattern (e.g., H&S or double bottom), but:
Current price is moving within a range-bound structure
Holding the 330–365 block would form a new higher low, strengthening the bullish outlook
Market is watching how price responds on retest of the yellow support
---
🧠 Notes for Traders:
Watch for volume and candle structure as price enters the 330–365 zone
This zone is a classic re-entry / reload area for institutional buyers
Conservative entry: Wait for bullish confirmation candle above 365
Aggressive entry: Ladder buys inside 330–365 with stop loss below 330
---
🏁 Conclusion:
TAO/USDT is undergoing a healthy pullback after rejection at 475.7 USDT. A retest of the yellow support zone (330–365 USDT) is highly likely. This area is crucial for the next move — either a bullish continuation with a strong bounce or a bearish breakdown signaling trend reversal.
#TAOUSDT #TAO #CryptoAnalysis #RetestSupport #DemandZone #BullishScenario #BearishScenario #AltcoinWatch #TechnicalAnalysis #PriceAction #TradingView #SupportAndResistance #GateIO #ReentryZone

TAO Analysis (3D)Sometimes, there's no need for complex patterns or heavy indicators — and TAO is a perfect example of that.
For years, TAO has been consolidating inside a clearly defined accumulation box. Before the current bullish breakout, it liquidated all weak hands by sweeping the lows — convincing many that the project was dead.
Now, on the daily timeframe, we’re seeing a broken and active pennant formation, which is already being validated.
This structure alone is a strong technical buy signal.
With the upcoming AI-driven bull run, TAO has the potential to outperform many of its AI-sector peers.
This one might just fly ahead of the pack.
#TAOUSDT #4h (ByBit) Ascending trendline near breakdownBittensor printed an evening doji star deviation, a retracement down to 200 MA support seems next.
⚡️⚡️ #TAO/USDT ⚡️⚡️
Exchanges: ByBit USDT
Signal Type: Regular (Short)
Leverage: Isolated (5.0X)
Amount: 5.0%
Entry Targets:
1) 430.38
Take-Profit Targets:
1) 362.01
Stop Targets:
1) 464.64
Published By: @Zblaba
GETTEX:TAO BYBIT:TAOUSDT.P #4h #Bittensor #AI #DePIN bittensor.com
Risk/Reward= 1:2.0
Expected Profit= +79.4%
Possible Loss= -39.8%
Estimated Gaintime= 1 week

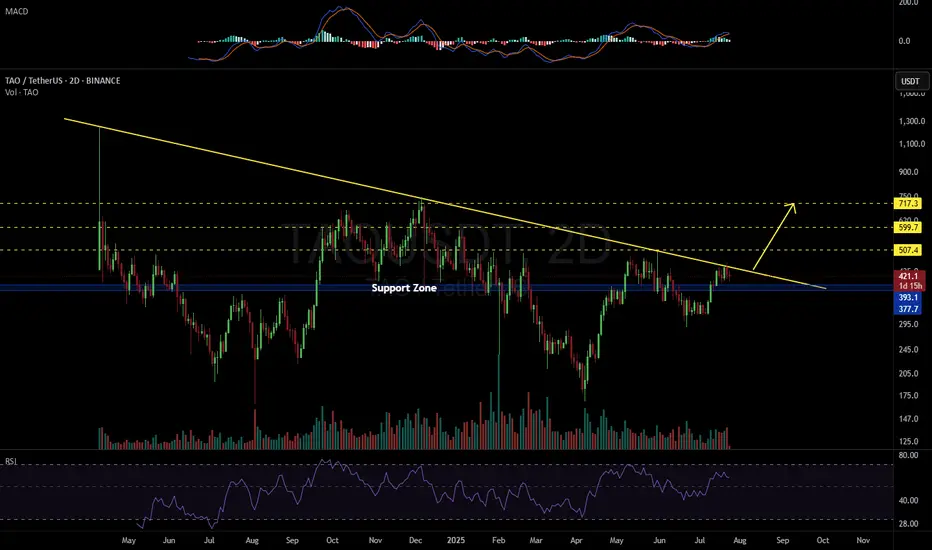
TAOUSDT 2D#TAO is currently testing the long-term descending resistance on the 2-day timeframe.
Partial accumulation at the current level may be considered, with additional entries near the key support zone:
🔹 $393.1 – $377.7
If the price breaks above the descending trendline with strong volume confirmation, the next potential upside targets are:
🎯 $507.4
🎯 $599.7
🎯 $717.3
⚠️ As always, use a tight stop-loss and manage your risk accordingly.