TAO RectangleBITGET:TAOUSDT has been trading in a well-defined rectangle for the last 16 months.
Key Levels
• $195 - Support, with demand zone extending to ~$260
• $470 - Midline, S/R band extending between $460-$490
• $745 - Resistance, with supply zone extending to $640
Despite a recent fakeout to the downside, TAO recovered support and might be headed for another move to the upside.
Targets
• $1300 in case of a sustained break above $745
• $50 in case of a sustained break below $195
TAOUSDT trade ideas

TAO: The Major Triangle#TAO has been moving sideways, possibly forming a major 4th wave triangle since its top back in April 2024.
This week’s bounce from key support was strong, forming a potential motive first wave.
Breaking $162 is the stop-loss and invalidates this idea.
#Bittensor

$TAO Limit Long SetupLooking for a potential bounce play on TAO. Price action shows a clear deviation below support followed by a strong recovery. Currently eyeing a retest of the demand zone around 195, where I’ve placed a limit long entry.
Entry: 195
TP: 270
SL: 160
Expecting a bit of chop in the mid-zone before continuation toward the 271 resistance zone. If the bounce plays out, this gives a solid 2.7R setup. Will monitor volume and structure confirmation around the entry zone.

TAO/USDT – Bullish Reversal Setup Taking Shape#TAOUSDT is showing early signs of a potential trend reversal following a prolonged downtrend. Price has recently rebounded from a key major support zone between $164 and $192, where a bullish divergence with the RSI has emerged—indicating a possible shift in momentum.
A well-defined descending trendline has been acting as dynamic resistance since the November 2024 high. Currently, price is approaching a critical resistance level around $284.7. A confirmed breakout above this area would be a strong signal that the market structure is beginning to shift in favor of the bulls.
If price breaks and holds above this resistance, the next upside targets are:
$468
$480
$495.9, in line with previous supply zones and structural highs.
Momentum is also improving, with RSI crossing back above the 50 level, supporting the bullish case. However, a clean breakout with sustained volume will be key to validating this setup.
Levels to Watch:
Support: $192.8 and $164.1
Resistance: $284.7, followed by $468–$495.9
Until we see a confirmed breakout, caution is warranted. Failure to clear the trendline may lead to another retest of support.
Summary:
#TAO is setting up for a potential bullish reversal, but confirmation above $284.7 is critical. A move beyond that level could open the door for a significant upside continuation. As always, manage risk accordingly and wait for confirmation.

TAOUSDT UPDATETAOUSDT is a cryptocurrency trading at $231.9, with a target price of $360.0. This represents a potential gain of over 60%. The technical pattern observed is a Bullish Falling Wedge, indicating a possible trend reversal. This pattern suggests that the downward trend may be coming to an end. A breakout from the wedge could lead to a significant upward movement in price. The Bullish Falling Wedge is a positive indicator, signaling a potential price surge. Investors are showing optimism about TAOUSDT's future performance. The current price may present a buying opportunity. Reaching the target price would result in substantial returns for investors. TAOUSDT is positioned for a potential breakout and significant gains.

TAO Analysis (1D)TAO appears to be forming a new corrective pattern from the point where we placed the red arrow, with its wave C potentially completing within the green box.
We are looking for buy/long positions in the green zone.
Targets are marked on the chart.
A daily candle closing below the invalidation level will invalidate this analysis.
invalidation level = 150$
For risk management, please don't forget stop loss and capital management
Comment if you have any questions
Thank You

[Update TAO]: $80-->$2000-->$160?I think we are completing a bearish trend for TAO. We will have a final wick at <100$ in the next 2-3 months and huge blow off top

Strong Long-term Trendline Support!The long-term upward trend line has been able to prevent the Tao from falling further. In addition, the bottom of the downward channel is its other support. If this level is maintained (~$200), it has a chance to pump to $355, and if this important support breaks, it will fall to at least $113 , and there, we shall look for reversal patterns.

TAO What will happen in the future?As you can see, the price has now formed an ascending wedge , which is promising. The price could rise to $280 after breaking this wedge...
Give me some energy !!
✨We spend hours finding potential opportunities and writing useful ideas, we would be happy if you support us.
Best regards CobraVanguard.💚
_ _ _ _ __ _ _ _ _ _ _ _ _ _ _ _ _ _ _ _ _ _ _ _ _ _ _ _ _ _ _ _
✅Thank you, and for more ideas, hit ❤️Like❤️ and 🌟Follow🌟!
⚠️Things can change...
The markets are always changing and even with all these signals, the market changes tend to be strong and fast!!

Bittensor at Make-or-Break Trendline — Bearish Targets Ahead?Bittensor is currently testing a key weekly trendline that’s held since mid-2023. A close below this level could confirm a break in market structure, opening the door to deeper downside targets.
⚠️ Key Levels to Watch:
- Holding the current trendline may lead to a short-term bounce.
- A breakdown targets the $168 – $136 zone, aligned with previous demand and Fib confluence (0.175 & 0.13 levels).

TAO at important levels... watch list materialTAO is revisiting previous lows and hoping to get support once again. There is a good chance that it does but a proper CHOCH would provide that evidence. Alternatively, the trend is still down and it could continue. The volume gap below could allow that to happen. This chart should be on a watch list. Time to DCA.
Full TA: Link in the BIO

Is TAOUSDT About to Dump Hard? Yello, Paradisers! Are you paying close attention to this subtle shift on TAOUSDT? Because what we’re seeing right now could easily trap late bulls before the real drop even begins…
💎TAOUSDT is currently displaying clear signs of a potential bearish reversal. We’ve observed a bearish Change of Character (CHoCH) developing from the 1H Fair Value Gap (FVG), which is a strong early indication of weakening bullish momentum. To add to this, price has also broken down below the 50 EMA, a technical signal that increases the probability of further downside movement. When both of these elements align, it’s often a precursor to a more significant pullback.
💎If TAOUSDT revisits the recent Fair Value Gap, the trade setup becomes even more attractive, offering a stronger risk-to-reward ratio. That would be the optimal level for entry. However, even from current price levels, the trade still offers a 1:1 risk-to-reward opportunity. While not ideal, it remains viable for more aggressive traders.
💎That said, the entire bearish setup becomes invalid if the price breaks out and closes a candle above the current resistance zone. In such a scenario, it would be wise to step back and wait for more reliable price action to develop before making any further decisions.
Strive for consistency, not quick profits. Treat the market as a businessman, not as a gambler.
MyCryptoParadise
iFeel the success🌴

This is the exact move for TAO before an aggressive rally up.TAO limit short trade (Swing)
Entry: 249
TP: 197 - 140
SL: 282
This is the exact move for TAO before an aggressive rally up.

This is the exact move for $TAO before an aggressive rally up.GETTEX:TAO limit short trade (Swing)
Entry: 249
TP: 197 - 140
SL: 282
This is the exact move for GETTEX:TAO before an aggressive rally up.

This is the exact move for $TAO before an aggressive rally up.GETTEX:TAO limit short trade (Swing)
Entry: 249
TP: 197 - 140
SL: 282
This is the exact move for GETTEX:TAO before an aggressive rally up.

This is the exact move for TAO before an aggressive rally up. GETTEX:TAO limit short trade (Swing)
Entry: 249
TP: 197 - 140
SL: 282
This is the exact move for GETTEX:TAO before an aggressive rally up.

TAOUSDTDisclaimer 👉 This is my personal analysis for educational purposes , Buy/Sell/Trade at your own risk. I am not a financial Advisor

$TAO Drop: Is $100 the Next Floor?The monthly timeframe chart shows a clear M-pattern and a double-top formation, both strong bearish indicators. if this pattern plays out, we could see a significant drop, potentially testing the $100 level as the next major support.
What's your take?
Do you think GETTEX:TAO will hold above $100, or will we see an even deeper drop?
Where do you see the true floor price forming?
Drop your thoughts below!
Please support this idea with a LIKE👍 if you find it useful🥳
Happy Trading💰🥳🤗

TAO SHORTDisclaimer 👉 This is my personal analysis for educational purposes , Buy/Sell/Trade at your own risk. I am not a financial Advisor

TAOUSDT Disclaimer 👉 This is my personal analysis for educational purposes , Buy/Sell/Trade at your own risk. I am not a financial Advisor
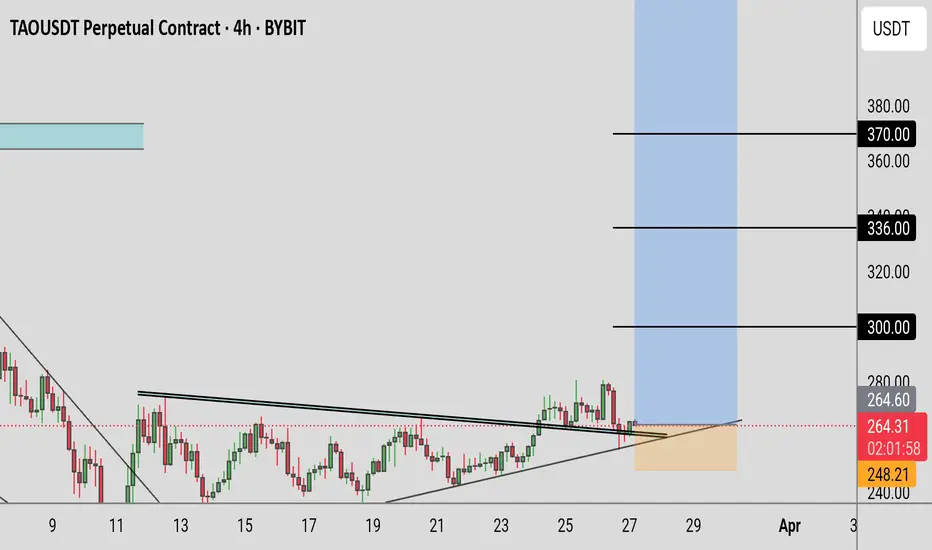
$TAO Potential in Q2Due to an expected activities of U.S. elected president, market are dumping. With unexpected factor from DeepSeek a couple months ago, shaken U.S. AI sectors. Therefore, this is the AI coin you can bet, one of the bluechip in AI, Bittensor.
I'm expecting to see GETTEX:TAO going sideway for a few more days before trying to reach it's resistance.
Side way area $230-$300
Resistance area $340-$350 - this could be the momentum (if break out this area, it again will retest within the $440 area)
Disclaimer: Not Financial Advise, I'm just sharing my thought.

TAO in coming days ...Currently, TAO is forming an ascending triangle, indicating a potential price increase. It is anticipated that the price could rise, aligning with the projected price movement (AB=CD).
However, it is crucial to wait for the triangle to break before taking any action.
Give me some energy !!
✨We spend hours finding potential opportunities and writing useful ideas, we would be happy if you support us.
Best regards CobraVanguard.💚
_ _ _ _ __ _ _ _ _ _ _ _ _ _ _ _ _ _ _ _ _ _ _ _ _ _ _ _ _ _ _ _
✅Thank you, and for more ideas, hit ❤️Like❤️ and 🌟Follow🌟!
⚠️Things can change...
The markets are always changing and even with all these signals, the market changes tend to be strong and fast!!
