DXY Is Very Bullish! Buy!
Here is our detailed technical review for DXY.
Time Frame: 1D
Current Trend: Bullish
Sentiment: Oversold (based on 7-period RSI)
Forecast: Bullish
The market is on a crucial zone of demand 99.274.
The oversold market condition in a combination with key structure gives us a relatively strong bullish signal with goal 101.270 level.
P.S
Overbought describes a period of time where there has been a significant and consistent upward move in price over a period of time without much pullback.
Like and subscribe and comment my ideas if you enjoy them!
Trade ideas

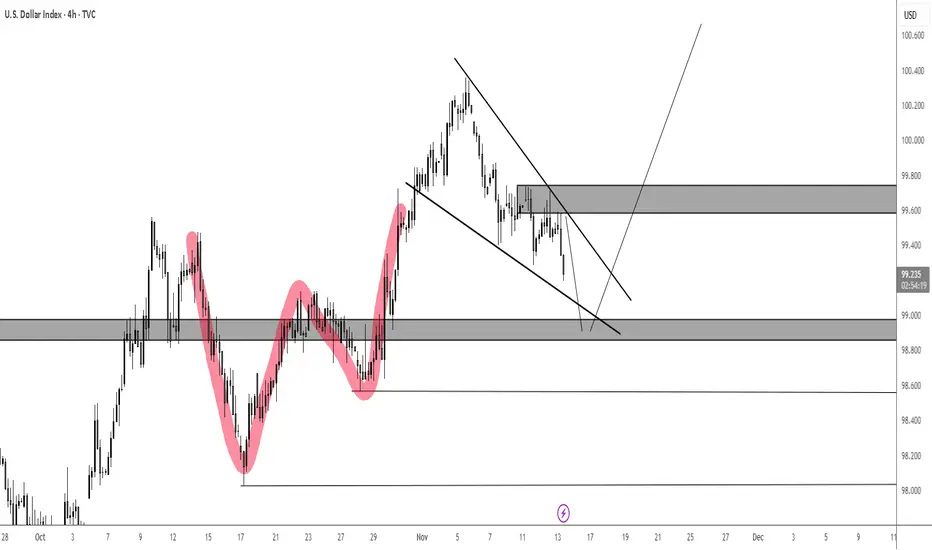
Dollar Index BullishNow breaking out of Larger Bearish wave(does not confirm bearish wave complete)
Currently in a potential C wave which means this might be a Bullish Flat on Higher time frame
4 hour chart making a potential bullish running flat which could potentially trade up to trend line

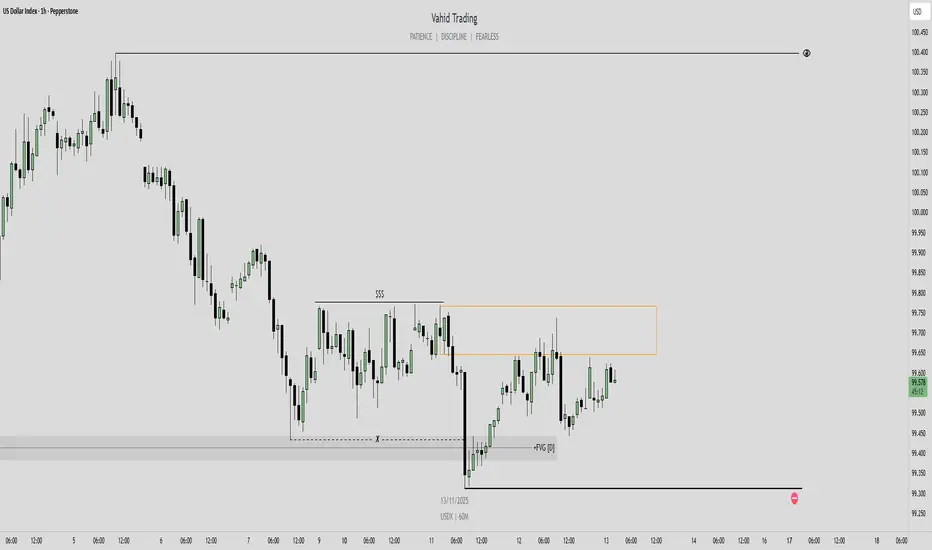
DXY Near Key Liquidity Pools — Which One Gets Taken First?NY Session Update
The Dollar opens New York trading holding firm in mid-range, rotating around the 0.50 region near 98.828.
The session begins with a steady structure, and flow remains shaped primarily by the broader macro tone rather than intraday volatility.
The Dollar spent the week under steady pressure as investors reassessed U.S. growth momentum. Several datasets were delayed, and the backlog created uncertainty around how strong the underlying economy actually is. The tone from the Federal Reserve shifted subtly toward patience — less focus on tightening, more on maintaining optionality.
At the same time, global risk appetite improved. Equities held firm, and capital rotated into other major currencies, reducing the Dollar’s safe-haven advantage. That combination — softer growth signals, stabilizing risk, and non-committal policy language — kept the Dollar pinned in mid-range structure.
Looking ahead, the next meaningful movement will likely come from surprise prints rather than scheduled events. Employment data, inflation momentum, and backlog clears remain the pressure points. Until those catalysts hit, the Dollar stays in observation mode: stable, compressed, and sensitive to macro tone rather than intraday noise.
NEXT WEEK’S U.S. DOLLAR DRIVERS
Inflation releases – Headline and core CPI/PPI data will test momentum in pricing pressure.
Employment & labour data – Wage momentum, participation and unemployment trends remain under the microscope.
Policy tone from the Federal Reserve – Speeches and any shifts in guidance around timing will carry enhanced weight.
Global risk-sentiment flow – Equity performance and risk-asset appetite at the NY open will continue to influence USD positioning.
Data backlog clarity – Delayed prints and residual effects from previous disruptions may create surprises in either direction, affecting Dollar flow.
CORE5 Pillar Overview
MSM — Market Structure Mapping:
Price remains inside weekly balance, with activity clustered around 98.776 — consistent with mid-range conditions.
VFA — Volume Flow Analytics:
The 4H anchored volume node at 98.725 continues to mark the area of most participation.
OFD — Order Flow Dynamics:
Recent activity shows hesitation to move deeper into the lower inefficiency zones.
PEM — Precision Execution Modeling:
Liquidity context remains defined by areas near 98.30 and 99.30, with the broader range limits at 97.672 and 99.985.
This provides the wider map for understanding structural rotation.
CORE5 Rule of the Day
Mid-range moves feed ego, not equity.
—
— CORE5DAN
Institutional Logic. Modern Technology. Real Freedom.

Dxy showing signs of bears power Dxy have gotten below 98.907 level which indicates that the bears are still in charge so we are looking at shorts again
Bullish bounce off?US Dollar Index (DXY) is reacting off the pivot and could bounce to the 1st resistance.
Pivot: 99.08
1st Support: 98.08
1st Resistance: 99.80
Disclaimer:
The opinions given above constitute general market commentary and do not constitute the opinion or advice of IC Markets or any form of personal or investment advice.
Any opinions, news, research, analyses, prices, other information, or links to third-party sites contained on this website are provided on an "as-is" basis, are intended to be informative only, and are not advice, a recommendation, research, a record of our trading prices, an offer of, or solicitation for, a transaction in any financial instrument and thus should not be treated as such. The information provided does not involve any specific investment objectives, financial situation, or needs of any specific person who may receive it. Please be aware that past performance is not a reliable indicator of future performance and/or results. Past performance or forward-looking scenarios based upon the reasonable beliefs of the third-party provider are not a guarantee of future performance. Actual results may differ materially from those anticipated in forward-looking or past performance statements. IC Markets makes no representation or warranty and assumes no liability as to the accuracy or completeness of the information provided, nor any loss arising from any investment based on a recommendation, forecast, or any information supplied by any third party.

USD Rejected at Resistance- Key Test Ahead for DXYThe US Dollar reversed sharply off pivotal resistance into the November open with DXY poised to mark a second consecutive weekly loss. The focus is now on whether the pullback marks the start of a larger correction or a brief pause within the broader uptrend.
The Dollar has now fallen more than 1.2% off the monthly high with the decline now breaking below the September uptrend. A simple channel extending off the monthly high is guiding this decline with initial support now eyed at 99.68/78- a region defined by the August high-day close, the May low and the 38.2% retracement. Look for a larger reaction there IF reached with a break / close below needed to suggest a more significant high is in place and a larger trend reversal is underway. Subsequent support rests at 98.03 and the 2018 high / 61.8% retracement at 97.71/80.
Weekly open resistance is eyed at 99.62 and is backed closely by the November open at 99.75. A break / close above this threshold would threaten resumption of the September uptrend with key resistance steady at 100.15/35- a region defined by the 2024 low, the 200-day moving average and the 2024 low close. Strength beyond this pivot zone is needed to fuel the next major leg of the US Dollar advance. The next major technical consideration is eyed at the 1.618% extension of the September advance at 101.32.
Bottom line: DXY reversed from key resistance into the monthly open with a break below then September upslope threatening a deeper setback- be on the lookout for a possible exhaustion low in the days ahead. From a trading standpoint, losses would need to be limited to 98.68 IF this is a simple correction with a break above 100.35 needed to mark uptrend resumption.
-MB

EURUSD SHORT DXY is at Asia session low and EURUSD is at a session high. I have entered the first trade and have a second trade marked up as a back up in case the price returns to the daily high from yesterday before reversing. I consider this a risky trade as EU is showing bullish market structure on the 4hr chart so this 1.16 psychological level may well be about to be broken. I have reduced my risk on this scenario due to this reason.

DXY Is Entering a Decision Zone — The Next Move Starts Here.DXY | Neutral Bias | 4H Frame
CORE5 View: Price has filled its inefficiencies and now meets the weekly balance head-on. This is the decision point for the next impulse.
Fundamental Context
Tomorrow is the real driver: PPI + jobless claims, with CPI right behind it.
These three data points set the short-term path for the dollar’s yield expectations.
Markets are holding steady into the releases — no rush, no conviction.
This is a waiting zone until numbers show direction.
Market Structure Context
Price has pushed into the discount side of the 4H range, tapping the same zone that has triggered rotations before.
All single prints beneath have now been filled, removing imbalances.
Now the structure is pressing the weekly balance at 98.766, a level that normally slows momentum and forces the market to show its hand.
This is where structure decides between rotation or continuation.
MSM — Market Structure Mapping
The 4H structure carries a bearish tone, but it is pushing straight into weekly balance, which often neutralizes momentum.
Nothing is broken, but nothing is confirmed.
This is where professionals wait for liquidity to choose dominance.
DGM — Dynamic Geometry Modeling
The downward leg into discount matches the prior leg in size and rhythm.
Symmetry is complete.
Geometrically, this is a natural location where rotation can start — but only if liquidity agrees.
VFA — Volume Flow Analytics
Anchored volume sits at 98.725, only a few points below current price.
This is a reliable decision level:
• Rotation often begins here when volume defends.
• If price accepts below this node, bearish continuation opens quickly.
It’s a participation pivot — the market chooses, not us.
OFD — Order Flow Dynamics
Order flow still favors the bearish side.
No meaningful attempt higher, no failed push, no shift in intent.
Buyers are quiet; sellers are steady.
Patience here protects capital.
PEM — Precision Execution Modeling
We’re sitting mid-range into end-of-day liquidity with clear pools both above and below.
In these conditions, price often drifts, cleans both sides, and waits for tomorrow’s data.
For cross-market positioning, holding off until USD bias confirms is the professional move.
🧠 CORE5 Rule of the Day
“Context leads. Direction follows. Structure only works when you let it speak first.”

GOLD HEADING TO 4270? NOVEMBER 11 2025This is my view on the GOLD this week
After 3 failed rally by gold and the fake breakout of 4110 today; we could see gold rejoining the broken resistance at 4220 and rally up to 4270, a key level where we may see a second selloff of the commodity
Key level / buy entry 4128 / 4116
Target: 4240 / 4270

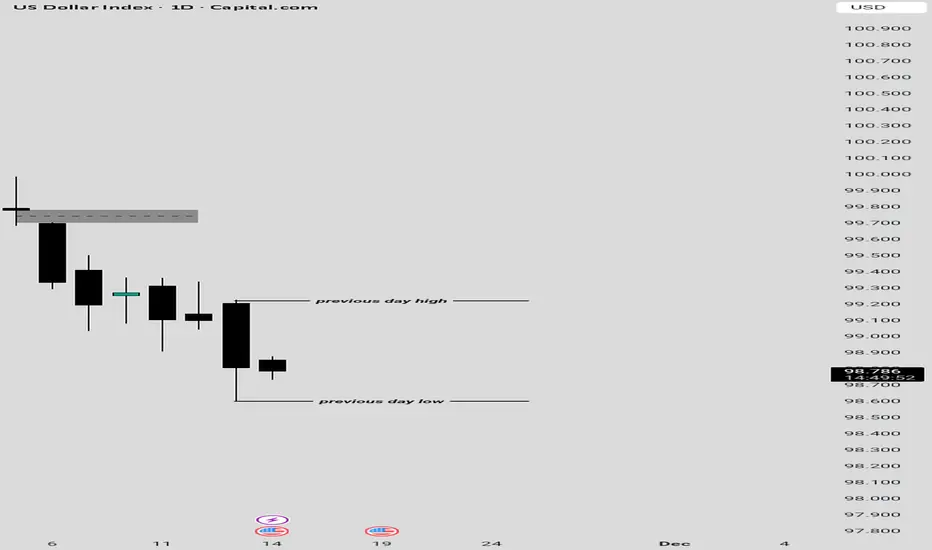
SHORTING OPPORTUNITYMarket moved towards the WH&L zone which is alongside previous SH&L. The DXY is also shows a change in direction as Health Bullish Candle started being established.

Shutdown Ended, What Is Next for the US Dollar?US shutdown ended after 43 days and set a new record. During the shutdown, a lot of economic data could not be released, and the lack of government spending caused a limited liquidity shortage. Now that the shutdown has ended, what is next for the US dollar?
US economy is expected to be hit by the shutdown in the fourth quarter. The impact is estimated to be around 1.5 percent on an already weakening economy. Over the last 25 years, annualized quarterly GDP growth has averaged 2.3 percent. Since 2021, US GDP rose above this average on a yearly basis. GDP was 2.8 percent in 2024, and this year it is expected to fall to 1.9 percent, below the long-term average, and it could drop further because of the shutdown. Growth in 2026 is also expected to be weak, with a forecast of only 1.8 percent.
While GDP is weakening, inflation forecasts still point to a near 3 percent pace, which is somewhat high in our view. This will keep the FED busy. Inflation implies a weaker currency unless supported by high rates. The FED has a dual mandate and cannot overlook the weakening GDP and softening labor market, so despite elevated inflation risks, rate cuts will continue. This will put ongoing pressure on the dollar, at least first half of 2026.
Dollar performance cannot be assessed without considering the euro, since 57.6 percent of the dollar index is tied to it. The eurozone is also expected to stay below its 25-year average growth rate of 1.32 percent. A 1.10 percent GDP rate with inflation below 2 percent is acceptable for the ECB. While the FED will be cutting rates, the ECB will likely hold, as Lagarde said in the latest press conference: “We are in a magnificent place.”
For the short term, the dollar is about to break its trend channel to the downside. Economic data from the US is expected to come in very weak. With expectations of weak data and easing liquidity problems, short-term downward pressure could push the index to 98.55 first. Below that initial support, the selloff could deepen. However, the long-term trend from 2011 is still holding(white trend).

DXY : Potential Long Entries , Targetting 100.360I am now scanning for potential entry opportunities. This post builds on the previous DXY Posts :
1. DXY 30 SEPTEMBER 2025 Post
2. USD Retracement to 99.5
3. USD Longs to 100.360

DOLLAR DXY DOLLAR DAILY REJECTION @100.057 level ,as the rumors of further rate cut by Federal reserve draw closers and the trade war yet unsettled ,the dxy and us10y directional bias remains on cautions.
the next watch zone of daily support will be 98.400 level, break and close below this level could return price into 95.600-96 zone and it will be an added advantage to our EURUSD LONG ,GBPUSD LONG and USDJPY SHOT.
fundamentals of dxy.
what is dxy????
The U.S. Dollar Index (DXY) is an index that measures the value of the United States dollar relative to a basket of six major foreign currencies: the euro (which has the largest weighting at 57.6%), Japanese yen, British pound, Canadian dollar, Swedish krona, and Swiss franc. It provides an overall gauge of the strength or weakness of the U.S. dollar against its main trading partners' currencies.
Key Points:
The DXY rises when the U.S. dollar strengthens relative to this basket of currencies and falls when the dollar weakens.
It was created by the U.S. Federal Reserve in 1973 after the end of the Bretton Woods system to track the dollar’s performance as it began to float freely against other currencies.
The index is widely used by traders, investors, and economists to understand dollar trends and its impact on international trade, commodities, and financial markets.
Movements in the DXY often inversely correlate with commodity prices like gold and oil because a stronger dollar makes dollar-denominated commodities more expensive for holders of other currencies.

DXY W Formation and Falling WedgeI anticipate a bounce soon, but, as indicated, a false breakout to the downside of that falling wedge to trap early buyers is highly likely.
Patience is key.
DXY – Watching for Bullish Shift Above 99.765Hello traders,
The Dollar Index (DXY) has completed a deep retracement — over 50% of the previous bullish leg — tapping into the daily bullish Fair Value Gap (FVG) and showing a bullish reaction from that area.
At this stage, if the market can hold Tuesday’s low and break above 99.765, it would confirm a bullish momentum shift, opening the path toward the next liquidity level at 100.397 as my main target.
However, if the price breaks below Tuesday’s low, this bullish scenario becomes invalid, and further downside movement could be expected.
Simple structure — just waiting for confirmation of direction. 📈
Dxy continuous movement to the upside This is the Dxy chart........
The Dxy found it difficult to move below the 98.900 level we have a slight strong hindsight that the algorithm is trying to take a push to the upside...... tomorrow will give us the final say if the market will get above 99.400 level
Markets to look at
Gbpusd.............bearish
Eurusd ..............bearish
Usdchf...............bullish

Trump leaving office - Political risk rises after Epstein emailsJeffrey Epstein allegedly claimed that Donald Trump spent hours in a house with one of the late trafficker’s victims and suggested the U.S. President was aware of his activities, according to an email released by congressional Democrats.
Will this latest scandal be enough to take Trump out of office? Probably not, but there is a non-zero chance still right.
For now, the potential end of the government shutdown appears to be overshadowing any market reaction. Still, traders shouldn’t overlook what a change in leadership could mean.
Last week, we explored how a J.D. Vance presidency might reshape U.S. markets by challenging corporate monopolies and potentially strengthening the dollar. The same logic applies here: if Trump were to lose the presidency, markets could quickly begin pricing in the next administration’s economic outlook.

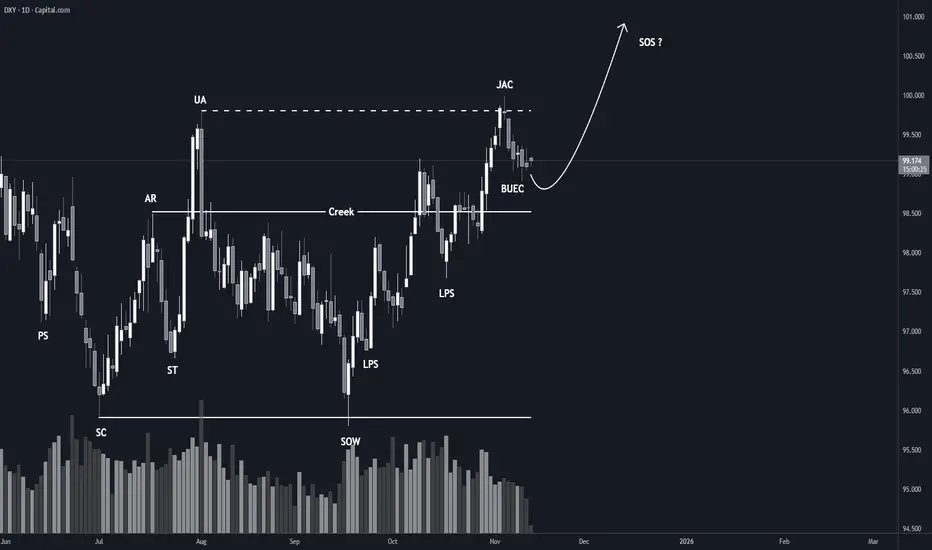
Potential Topping Signs in U.S. DollarThe U.S. Dollar index began 2025 with a big slide. Now, after a period of consolidation, some traders may expect further downside.
The first pattern on today’s weekly chart is the price level around 100. DXY bottomed at the level in September 2024 and peaked at it last July. The greenback probed the same area again last week without breaking out. That may suggest old support has become new resistance.
Second is the 96.3 level, a low on July 1 that was tested in mid-September. If the dollar slides from here, chart watchers may view this spot as initial support.
Below that level it may get more interesting because there’s little clear support above the 88-90 zone where DXY bottomed in 2018 and 2021.
Even if traders don’t trade currencies directly, declines in the greenback can potentially lift other products like gold, silver and global stocks.
TradeStation has, for decades, advanced the trading industry, providing access to stocks, options and futures. If you're born to trade, we could be for you. See our Overview for more.
Past performance, whether actual or indicated by historical tests of strategies, is no guarantee of future performance or success. There is a possibility that you may sustain a loss equal to or greater than your entire investment regardless of which asset class you trade (equities, options or futures); therefore, you should not invest or risk money that you cannot afford to lose. Online trading is not suitable for all investors. View the document titled Characteristics and Risks of Standardized Options at www.TradeStation.com . Before trading any asset class, customers must read the relevant risk disclosure statements on www.TradeStation.com . System access and trade placement and execution may be delayed or fail due to market volatility and volume, quote delays, system and software errors, Internet traffic, outages and other factors.
Securities and futures trading is offered to self-directed customers by TradeStation Securities, Inc., a broker-dealer registered with the Securities and Exchange Commission and a futures commission merchant licensed with the Commodity Futures Trading Commission). TradeStation Securities is a member of the Financial Industry Regulatory Authority, the National Futures Association, and a number of exchanges.
TradeStation Securities, Inc. and TradeStation Technologies, Inc. are each wholly owned subsidiaries of TradeStation Group, Inc., both operating, and providing products and services, under the TradeStation brand and trademark. When applying for, or purchasing, accounts, subscriptions, products and services, it is important that you know which company you will be dealing with. Visit www.TradeStation.com for further important information explaining what this means.

Dollar Decision TimeDollar is about to decide to rally and target over 101 or go back to the blue, long term trend that started in 2011 and test it again. This week, it will be decision time for dollar and all the markets.

GBPUSD LongLooking for PL zone to be respected and push bullish from the SL. There is DXY pushing into a SH that was respected very well so far this week. Looking for a bullish move up on GU

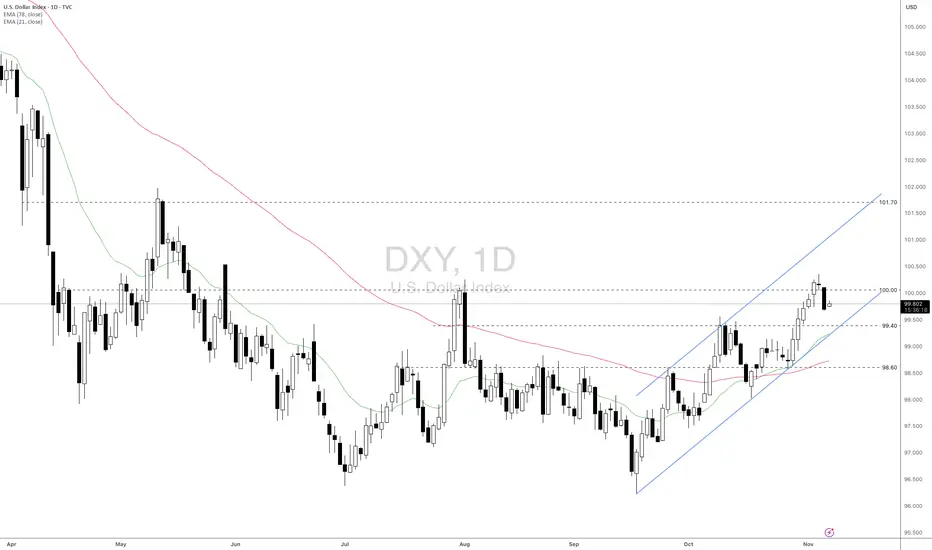
DXY: Is it going to break the 100 level or not?Fundamental approach:
- The US Dollar Index (DXY) traded sideways this week amid stronger global risk sentiment and fading demand for safe-haven assets. The continued US government shutdown delayed key data releases.
- At the same time, the ISM Services PMI rose to an eight-month high, and the ADP report showed stronger-than-expected private job gains, supporting a cautious Fed outlook on further rate cuts. Nevertheless, weak consumer sentiment and rising weekly jobless claims reinforced downside pressure on the dollar index.
- Underlying drivers this week included mixed US data, with upbeat labor and service sector figures contrasting with deteriorating consumer and business sentiment. Investors trimmed bets on imminent Fed rate cuts.
- Looking forward, the DXY may remain heavy as long as safe-haven demand stays muted and official US data is delayed due to the shutdown.
Technical approach:
- DXY retested the psychological level at around 100 and rejected. The price is above both EMAs, indicating upward momentum is still intact.
-If DXY remains below 100, the price may retest the following support at 99.40, which is confluenced with the lower bound of the ascending channel.
- Conversely, breaching above 100 may prompt a conviction to retest the next resistance at 101.70.
Analysis by: Dat Tong, Senior Financial Markets Strategist at Exness
DXY Bullish Momentum Builds | Midweek Dollar Outlook 11/12/25The DXY remains bullish so far this week. In this midweek outlook, we break down key support and resistance levels, trend momentum, and what to watch heading into the weekend.
USDCAD/USDCHF/USDJPY: Looking for bullish moves
AU/EU/GU/NU: Looking for bearish moves
