DXY: Bearish Divergence and Its Impact on Risk Assets
This chart tracks the daily price of DXY , revealing key technical and macro dynamics relevant for traders and investors in risk-on markets.
The DXY has approached a major horizontal resistance level near 100.2, a zone that previously acted as both support and resistance.
While price tests this resistance, the RSI shows a classic bearish divergence, DXY has made higher highs on price, but RSI has failed to confirm new momentum highs. This gap signals underlying exhaustion, suggesting that further upside for the dollar may be limited in the near term.
A falling DXY signals easier liquidity and can catalyze rallies in riskier asset classes. Traders often watch DXY movements for clues on when to deploy capital into stocks or crypto.
Trade ideas

12/12/2025 - Daily ForecastAnalysis of FX:EURGBP
Watch list for today:
FX:EURGBP
FX:AUDUSD
OANDA:XAUUSD

Are U.S. Dollar Bears getting exhausted?Still holding on to my EUR/USD short positions since late June/early July and it’s been quite a game of patience at this point but as I have been analyzing the U.S. Dollar for the past few months, from a purely technical analysis perspective, I’m currently still seeing the U.S. Dollar potentially carving out a bottom here and make a run to re-visit the 100 - 102 price zone.
I know markets are highly anticipating a Federal Reserve rate cute in September but with inflation still sticking around, it may not be such a sure thing just yet.
All eyeballs and ears will be on tap for Powell’s speech on Friday.
Technical analysis signals:
• Descending Broadening/Expanding Wedge (Bullish Pattern)
• MACD Histogram showing a sign of potential bearish exhaustion

DXY Market Outlook – Personal ViewThe Dollar Index is currently sitting at a make-or-break level. After sweeping the recent daily high and rejecting from the monthly resistance, price dropped with momentum, leaving behind an imbalance (FVG) which is serving as a resistance in 4H TF. It is now resting on a daily upward trendline.
A break of this trendline could unfold in two ways:
1. A direct break of the trendline, signaling early bearish intent.
2. A pullback into the imbalance (FVG) before breaking the trendline, which would offer a clearer confirmation of a potential downtrend. Meaning that Dollars bears would step in to defend their position.
On the other hand, if the daily trendline holds and price aggressively fills and moves through the imbalance, it may signal a continuation toward a retest of the monthly resistance.
USD fundamentals will play a major role in determining the next move, so keep a close eye on upcoming news events.
This analysis reflects my personal view of the market and is not financial advice.

DXYdollar index confirmed bearish!! Gold will befly. sorry my engliish is not good cant type my oponion...

DXY | Fed Cut Day Inside an Ascending Channel – What’s Next?The Fed is widely expected to deliver another 25 bps cut today, taking the funds rate down toward the 3.75–4.00% range – the third step lower this year. Markets seem more focused on Powell’s tone and the new dot plot than the cut itself, with a lot of debate inside the FOMC about how fast to ease from here.
Technical Lens:
On the 1H chart, DXY is grinding higher from the 99.00 area in a neat ascending channel. Price is mid-structure for now, with the upper channel boundary aligning broadly with the prior supply zone around 99.50–99.70, while the lower channel line and recent swing lows cluster just under 99.00 as short-term support.
Scenarios:
Scenario A – Hawkish-leaning cut (USD bullish):
If Powell leans hawkish despite the cut – stressing “data dependence,” limited room for aggressive easing, and concern about still-sticky inflation – DXY could hold the lower half of this channel and work its way toward the upper boundary and that 99.50–99.70 resistance area.
Scenario B – Dovish surprise / guidance (USD bearish):
If the statement and dots signal a quicker or deeper easing path, or Powell sounds comfortable with looser financial conditions, DXY might lose the channel support (a clean break below ~99.00), opening room for a push back toward the recent lows beneath the structure.
Catalysts:
FOMC rate decision & statement
Updated SEP/dot plot
Powell’s press conference Q&A, especially comments on growth risks vs. inflation risks
Takeaway:
I’m using this little ascending channel as my decision zone: hold the lower bound with hawkish-ish messaging and DXY can keep grinding higher toward 99.50–99.70; lose the channel on a dovish surprise and the downside opens back up.

DXY rebounded slightly due to the expectation more hawkish FedThe US dollar rebounded after the recent weakness due to increased odds of a rate hike at tomorrow's meeting.
Meanwhile, today's US October JOLTS data may offer further clarity on the labor market following the delayed October NFP. Markets are anticipating the JOTLS to fall to 7.2 million, which could contract the job openings per unemployment rate under the 1.0 level and add further concern about the labor market, despite a low unemployment rate.
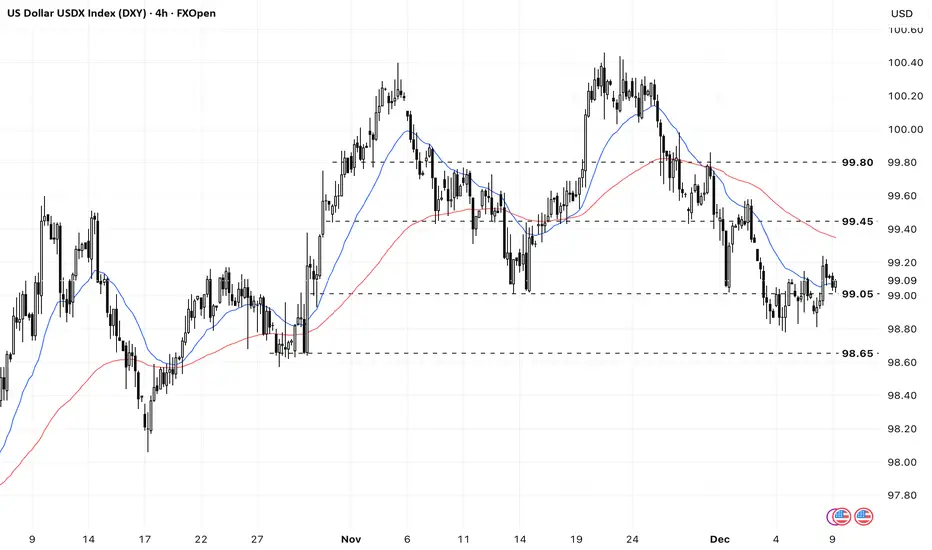
DXY breached 99.00 and EMA21. The index remains between the bearish EMAs, indicating potential consolidation.
If DXY breaks below 99.00 again, the index could retreat toward the next support at 98.65.
Conversely, if the DXY moves above the EMA78, the index may advance toward the next resistance level at 99.45.
Focus to Be on 2026 Projections at Today’s FOMCFOMC members meet to discuss rate cuts today. The market expects a 25 bps cut heavily despite some members' speeches against it. Powell is likely to convince members for a 25-point cut with minimum dissidents, but the 2026 rate outlook has started to become blurrier.
Employment data from ADP was weak, but jobless claims and JOLTS told a different story. Yes, there is weakness looming above the jobs market, but the strength of it is not too clear. The Fed has enough room for a couple of cuts, but too quick a move could risk near 3% inflation becoming even more entrenched. The Fed will walk on a thin line in 2026.
The September meeting's economic projections will be updated at today's meeting. The 2025 rate projection will be on target with today's probable 25 bps cut. For 2026, members wrote only one cut, and this will likely not change today to appease hawks to some degree. If it is revised to two cuts, this will be seen as dovish. The market was pricing three more cuts for 2026, but that fell to two in recent weeks. With Powell's term ending, more rate cut pressure will be on the Fed, so two or three cuts for 2026 is a good guess if inflation retreats below 2.5%. So far, PCE and core PCE projections written by members are 2.6% for each. Any update will be crucial to both inflation and unemployment. We think unemployment will be revised up in today's meeting.
Another thing to focus on will be the possible return of QE. Market liquidity problems still persist despite the end of the shutdown and QT. There is a chance that the FOMC will decide to ease this burden before it causes any damage to markets with relatively conservative treasury purchases..

DXY Bullish BiasBullish on DXY for now. Mitigation on OB that had the upward move. Am bullish on USD/XXX pairs

DXY - 261.8% lines up with the measured move target DXY - 261.8% lines up with the measured move target (dip buying)

[b]US Dollar technical Forecast: USD Poised for Breakout US Dollar technical Forecast: USD Poised for Breakout Ahead of High-Stakes Fed Decision
USD Dollar rally drops into confluent support - December opening-range taking shape ahead of major policy catalyst.
USD is Coiling with a narrowing structure, and a breakout from this zone will be critical in determining the next directional leg.
Fed decision an top tomorrom- focus on updated SEP as trader's asses monetary policy outlook.
DXY Resistance 100.16/42 (key), 101.20/55, 103 - Support 98.99-99.08, 97.65/80(key) 96.94

USD Poised for Breakout Ahead of High-Stakes Fed DecisionThe range broke lower into the December open with the index plunging 1.6% before rebounding off Fibonacci support to register a weekly close-low last week at 98.99. The focus now shifts to the Fed rate decision tomorrow with the monthly opening-range taking shape just above support- decision time for the US Dollar.
Initial weekly support rests with the 38.2% retracement of the advance off the yearly low at 98.80. A break / weekly close below this threshold would threaten another bout of accelerated losses with the next major technical consideration seen at the 2025 low-week close (LWC) and the 61.8% retracement at 97.65/81- look for a larger reaction there IF reached. Subsequent support rests with the 2021 swing high at 96.94 and the 2025 swing low at 96.22.
Key resistance remains unchanged at the 100.15/42- a region defined by the 2024 swing low, the November high-week close, the July high, and the 2024 LWC. A topside breach / weekly close above this threshold is needed to mark resumption of the September uptrend with subsequent resistance objectives eyed at the 52-week moving average (currently ~101.20) and the 38.2% retracement of the yearly range at 101.55.
Bottom line: The U.S. Dollar is trading just above confluent support with the monthly opening-range in focus heading into major event risk. Look for the breakout to offer guidance in the days ahead. From a trading standpoint, losses would need to be limited to 98.80 for the September uptrend to remain viable with a weekly close above 100.42 ultimately needed to fuel the next leg of the advance.
-MB

DXY Trade Set Up Dec 9 2025I am expecting DXY to continue bullish for now, targeting supply before the reversal back down

GBPUSD - Session Low Long GBPUSD tapping into Asia session low. I waited for the first 15 min candle close in this region first which price wicked into and then reversed. I then wanted a second confirmation which was the DXY. DXY was approaching a high from last week which it was respecting.
SL & TP: 10 PIPS
RR: 1:1
Risk: 1%

GU Session High resistanceGU is touching a fresh resistance, SL flexed to accommodate GBP volatility, there is a price gap on GBP DTF that market might seek to drop to fill, and DXY is breaking through 99.00 zone after hovering there for some time

USD Testing Pivotal Support Ahead of FOMCThe US Dollar is rebounding off key near-term support into the start of the week at 98.69/80- a region defined by the August high-day close (HDC), the May swing low, and the 38.2% retracement of the advance off the yearly low. The immediate focus is on this recovery heading into the Federal Reserve interest rate decision on Wednesday. Initial resistance is eyed at 38.2% retracement of the November decline, the December open, and the 200-day moving average around 99.39/48. Near-term bearish invalidation is eyed at the 61.8% retracement 99.77- note that this level converges on former channel support and a breach / close above this threshold would be needed to suggest a more significant low is in place, and the potential for resumption of the September uptrend. Key resistance remains unchanged at the 2024 low, the August high, and the 2024 low-close at 100.15/35.
A break below this key support pivot would threaten substantial losses of the Dollar with the next major technical consideration eyed at the 2018 swing low and the 61.8% retracement 97.71/81.
Bottom line: The US Dollar is rebounding off near-term support, and the focus is on a breakout of the December opening-range in the days. From a trading standpoint, losses would need to be limited to 98.69 IF price is heading higher on this stretch with a close above 99.77 needed to validate the turn. Keep in mind we get the releases of the FOMC’s updated Summary of Economic Projections and the focus will be on the interest rate dot-plot as traders assess the outlook for monetary policy heading into 2026. Expect some volatility this week.
- AG

How XAUUSD and DXY reflecting each other?It says morning can proivde clues on the day! similarly daily open can provide how the price do all along the day!
Since market open on DXY, the price indicating bearish price action expect this hour with a rejection upside which in turn could be preparation for drop again as market left imblalance toward the downside.
GOLD is, as the mirror of DXY has creating mirror price action with initial bounce now moving back towards daily support level.
As DXY indicating bearish move further, It is high probability GOLD may bounce off the daily support level.
So todays level looking at
DXY possible down from 99.02
GOLD possible upside from 4198.00

Bullish bounce off key suppport?The US Dollar Index (DXY) is reacting off the pivot, which has been identified as an overlap support, and could bounce to the 1st resistance, which acts as a multi-swing high.
Pivot: 98.62
1st Support: 97.18
1st Resistance: 100.39
Disclaimer:
The opinions given above constitute general market commentary and do not constitute the opinion or advice of IC Markets or any form of personal or investment advice.
Any opinions, news, research, analyses, prices, other information, or links to third-party sites contained on this website are provided on an "as-is" basis, are intended to be informative only, and are not advice, a recommendation, research, a record of our trading prices, an offer of, or solicitation for, a transaction in any financial instrument and thus should not be treated as such. The information provided does not involve any specific investment objectives, financial situation, or needs of any specific person who may receive it. Please be aware that past performance is not a reliable indicator of future performance and/or results. Past performance or forward-looking scenarios based upon the reasonable beliefs of the third-party provider are not a guarantee of future performance. Actual results may differ materially from those anticipated in forward-looking or past performance statements. IC Markets makes no representation or warranty and assumes no liability as to the accuracy or completeness of the information provided, nor any loss arising from any investment based on a recommendation, forecast, or any information supplied by any third party.

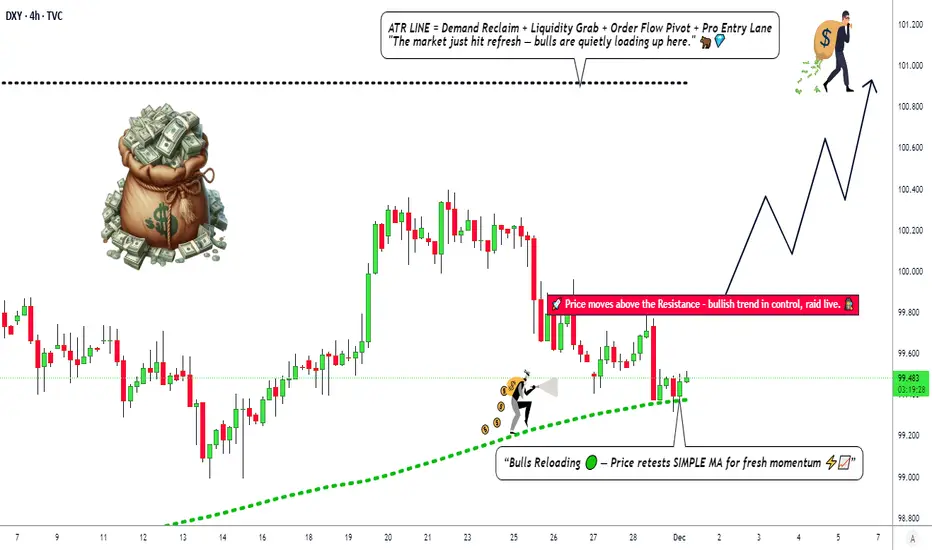
DXY Bullish Outlook | SMA Pullback + Breakout Confirmation🚀 DXY BULLISH SWING SETUP: SMA PULLBACK CONFIRMED! | Key Levels & Correlated Pairs 📈
🎯 Trade Idea: Bullish Swing on DXY (US Dollar Index)
📊 Asset: TVC:DXY | Timeframe: 4H & Daily
🔥 Strategy: Simple Moving Average Pullback + Resistance Breakout Confirmation
⚡ ENTRY PLAN:
Trigger: Break & close above 99.900 resistance
Ideal Entry: Any pullback toward 99.700-99.850 after breakout
Confirmation: Price holding above SMA support (adjust to your preferred period)
🛑 STOP LOSS (RISK MANAGEMENT):
Reference level: 99.300
👑 Dear Trading Family (Thief OGs) – This is MY protective stop. PLEASE adjust based on YOUR risk tolerance and strategy. I am not responsible for your SL/TP decisions. Manage your own risk!
✅ TAKE PROFIT TARGETS:
Primary TP: 100.900 (Strong confluence: SuperTrend ATR resistance + overbought zone potential trap)
Partial take profits advised along the way
🧠 Reminder: You can take money at YOUR own discretion. Not financial advice!
📈 RELATED PAIRS TO WATCH & CORRELATIONS:
FX:EURUSD – Inversely correlated (~57.6% weight in DXY). DXY up = EURUSD down.
FX:GBPUSD – Negative correlation. Strong dollar pushes GBPUSD lower.
FX:USDJPY – Positive correlation. DXY bullish = USDJPY often rises.
OANDA:XAUUSD (Gold) – Typically inverse to dollar strength.
TVC:USOIL (Crude) – Dollar up can pressure oil prices (denominated in USD).
🔍 KEY POINTS:
Watch for USD strength across majors to confirm DXY momentum
If DXY rallies, expect EURUSD & GBPUSD to show sell setups
Always correlate with Fed policy expectations & US economic data
📌 DISCLAIMER:
This is my personal analysis, not financial advice. Trade at your own risk. You are responsible for your own decisions.
Let’s get this bread! 🍞 If you find this helpful, drop a like 👍, follow for more ideas, and share your thoughts in the comments!
#DXY #USDollar #TradingSetup #SwingTrading #ForexTrading #MarketAnalysis #TradingView #FX #RiskManagement #ThiefOGs
how dollar index look like now!!This is a long-term structural analysis of the U.S. Dollar Index (DXY).
While no analyst can predict the exact future path of price, studying major structures, liquidity zones, long-term channels, and timing cycles can provide a meaningful macro perspective.
In this chart I highlight:
• Key liquidity pools and distribution/accumulation zones
• Long-term ascending and descending channels
• Major Fibonacci confluence zones
• Structural breaks and mitigation blocks
• Possible multi–year corrective cycles
• Time cycles that have previously aligned with major turning points
The overall idea suggests that DXY may be entering a macro inflection point, where both bullish and bearish scenarios become highly sensitive to structural confirmation.
A deeper correction remains possible if price loses the mid–range support zone, while a reclaim of upper structure could extend the bullish cycle first.
This is not a prediction — it’s a roadmap.
Price will choose its own path, but having a broader structural view helps traders understand where major reactions may occur over the next several years.

DXY – Strong Supply Zone and Potential Bullish Breakout SetupThis chart shows a descending trendline on the DXY with price consolidating beneath it. The highlighted green area represents a strong supply zone where previous reactions occurred. If price breaks above the trendline, it may attempt a bullish move toward this zone. The blue projection illustrates a possible scenario based on market structure—not a guarantee or financial advice.

DXY update 95-96 STRONG SUPPORT ? From the data that has been compiled, we can see that there is a reaction at the 95 support area.
Is this a strong support area for a bullish reversal ?
We'll see what happens next...we need more times to watch it movements as DXY still consolidation.
Have a Blessing week ahead !

dxy 1h🔹 Overall Outlook and Potential Price Movements
In the charts above, we have outlined the overall outlook and possible price movement paths.
As shown, each analysis highlights a key support or resistance zone near the current market price. The market’s reaction to these zones — whether a breakout or rejection — will likely determine the next direction of the price toward the specified levels.
⚠️ Important Note:
The purpose of these trading perspectives is to identify key upcoming price levels and assess potential market reactions. The provided analyses are not trading signals in any way.
✅ Recommendation for Use:
To make effective use of these analyses, it is advised to manually draw the marked zones on your chart. Then, on the 5-minute time frame, monitor the candlestick behavior and look for valid entry triggers before making any trading decisions.
