The DXY continues to uphold its bullish trajectoryThe DXY continues to uphold its bullish trajectory, steadily paving its way across the 100.000 level. This sustained upward momentum reflects growing dollar strength as market structure aligns with bullish expectations. follow for more insights , comment and boost idea .
Market insights

Dollar Breaks The Wedge Support As SP500 Eyeing More UpsideHey guy, hope everyone is doing well.
As you know, we have seen some minor pullback on stocks yesterday as JPY come up a bit, after some hawkish remarks from BOJ Ueda. And at the same time cryptocurrencies also experienced a pretty sharp sell-off. But I believe these are all just temporary flows at the start of a new week and month. Position adjustments will still happen, and possibly after some pause on stocks we will resume higher, meaning that the dollar could stay in this weak mode, especially since the DXY ame out of a wedge pattern and now signals more downside. In such case, this previously broken trendline could be retested as a resistance around 99.65–99.85, tomorrow or in the second half of this week I would expect more dollar weakness.
GH

Dollar index The market (dollar index) will be bearish after a jump and a fake-out. Fake out line specified!

USD Dollar FOMC IdeaBias until Dec FOMC:
We will be looking to continue to ride the Fed rate cuts odds increased on the markets as that is still holding most weight at the moment and will most likely continue to do so until the FOMC decision on 11 December.
The markets have been primarily pricing in the rate cut expectations 30 days well before the actual FOMC decision, there during the actual Rate decision release, we barely get any impact and we get markets repositioning for any future guidance to come. Basically a case of ‘Buy the rumour and Sell the news’’ play.
- Because at the moment, we have been seeing rate cut probabilities increasing to 85% which has been holding most weight for Gold upside and giving the greedy intuitions a reason to further buy up risk assets.
However,
- This doesn't mean that Dec is a guaranteed rate cut, and during the December FOMC, the fed may either cut rates by 25bps or Hold rates, and if there future guidance remarks are hawkish since inflation is still elevated - then we can see Profit taking on risk assets. Therefor expect to see Gold bears, DXY bulls, BTC Bears, Stock bears.
So until the actual December FOMC, If December Rate cut probabilities are still elevated (80%+), then, we can still expect Buyers in control on Risk assets, so:
- DXY - Downside.
- GOLD - Upside , potentially retest upto previous ATH’s $4380’s. Then Profit taking post FOMC.
- US Stocks - Upside on SPX to make New ATH’s and bearish wave if Dec FOMC hawkish.
- BTC - Upside to 100k, prev supply zone before Correction bearish phase.

DXY – Technical & Fundamental OutlookTechnical:
The Dollar Index weakened after rejecting the 100.20–100.50 supply zone. Now trading below 99.60, the structure remains bearish with potential continuation toward 98.80–98.60 unless price reclaims the 100.00 level.
Fundamental:
The USD is pressured by expectations of rate cuts and mixed U.S. data, reducing safe-haven demand. Upcoming labor indicators and Fed commentary remain key drivers.
Key:
Below 100.00 = bearish bias.
Target to the downside: 98.60.

US Dollar: Wait For The Breakout!Welcome back to the Weekly Forex Forecast for the week of Dec 1 - 5th.
In this video, we will analyze the following FX market: USD Dollar
The USD is bearish-neutral. It had a bearish close to last week, but did not close below the low of the previous week. This could indicate more consolidation coming.
Wait for price to trade above or below Friday's candle, and let that be your guide for the week.
Enjoy!
May profits be upon you.
Leave any questions or comments in the comment section.
I appreciate any feedback from my viewers!
Disclaimer:
I do not provide personal investment advice and I am not a qualified licensed investment advisor.
All information found here, including any ideas, opinions, views, predictions, forecasts, commentaries, suggestions, expressed or implied herein, are for informational, entertainment or educational purposes only and should not be construed as personal investment advice. While the information provided is believed to be accurate, it may include errors or inaccuracies.
I will not and cannot be held liable for any actions you take as a result of anything you read here.
Conduct your own due diligence, or consult a licensed financial advisor or broker before making any and all investment decisions. Any investments, trades, speculations, or decisions made on the basis of any information found on this channel, expressed or implied herein, are committed at your own risk, financial or otherwise.

DXY DXY (US Dollar Index) — Technical Analysis (1D Timeframe)
chart shows a mix of Fibonacci levels, moving averages, trendlines, and long-term projections, suggesting analyzing a potential major trend reversal and multi-month bullish recovery in DXY.
Below is the full breakdown:
1️⃣ Current Market Structure
DXY has been in a downtrend from the 106–107 region.
Price formed a rounded bottom around the 100–101 level, showing early signs of accumulation.
The market recently broke above short-term resistance, hinting at a trend shift.
This supports the idea of a potential bullish reversal.
2️⃣ Moving Averages (MA Signals)
Your chart uses 3 MAs:
Green (short-term MA): Price is above → bullish short-term momentum.
Red (medium MA): Price crossing above → bullish confirmation building.
Blue (200-day MA): The key resistance level.
DXY is about to test the 200-day MA, which is crucial. A breakout would confirm a major trend reversal.
3️⃣ Fibonacci Structure
You've drawn Fibonacci retracement levels of the previous decline:
0.5 Fib (~103.1) → price is currently challenging this level.
0.75 Fib (~104.6) → next resistance.
1.0 Fib (~106.1) → upper target zone.
These levels align perfectly with your projected path.
4️⃣ Key Projection Zones
🟦 Medium-Term Projection (Grey/Red Area)
Price may reach resistance at the 200 MA.
Then a pullback is expected (red arrow).
The pullback lasts ~53 bars (~75 days), returning to a support line.
This creates a higher low, confirming bullish structure.
🟩 Long-Term Projection (Green Area)
After the pullback:
A strong multi-leg bullish rally begins.
The projection shows:
Higher highs and higher lows
Measured waves forming a staircase pattern
This rally spans ~137 bars (~191 days).
Final target zone:
🎯 Around 106–107, matching your long-term resistance.
This suggests you expect the US Dollar to gain strength into mid/late 2026.
5️⃣ Trendlines
Rising brown dotted curve → long-term support / trend shift.
Descending trendline (previous) → likely broken during the next rally.
Projected rising trendline → defines bullish channel.
These reinforce your forecast of a multi-month bullish trend.
6️⃣ Momentum Indicator (MACD-style Histogram)
Green bars increasing → bullish momentum building.
Previous deep red phase shows the major correction is fading.
This supports your reversal thesis.
7️⃣ Summary of Interpretation
📈 Short-Term Outlook: Bullish Toward 103–104
Price is rising into the 200 MA level.
Resistance expected around 103.5–104.
🔻 Medium-Term Outlook: Pullback
A corrective move back toward the brown trendline.
Approximate timing: ~75 days.
🚀 Long-Term Outlook: Strong Bullish Rally
Higher highs and higher lows developing.
Final target: 106–107 zone.
Approximate timing: ~191 days.
💡 Overall Bias: Bullish Reversal
Your chart strongly signals:
End of the downtrend
Start of a multi-month bullish cycle in the US Dollar

GBPUSD Long + DXYPotential GBPUSD Long setup using London session low and in combination with P-Line support zone. On the other-hand DXY showing confirmation

Potential Top forming.A potential reversal pattern may be developing on the DXY as it tests the 100.000 level—a key psychological resistance zone. With price action stalling at this major round number, could we be witnessing the early stages of a bearish move?

EURUSD long setupEURUSD sitting on a London session low zone and in a P-Line zone along with the RSI showing oversold conditions, conversely DXY is at a the London session high and also the RSI showing overbought. Going for a 1:2 RR trade.

US Dollar Plunges into December as DXY Threatens September RallyThe US Dollar plunged more than 1.3% off the November highs after DXY turned from pivotal resistance last week at 100.15/35- a region defined by the 2024 low, the August high, and the 2024 low-close. The losses are now threatening to break the September uptrend, and the focus is on today’s close with respect to the November low-day close (LDC) at 99.27. A close below this level would risk a larger decline towards 98.69/79- a region defined by the August high-day close (HDC), the May low, and the 38.2% retracement of the advance off the yearly low. Look for a large reaction three IF reached.
Initial resistance stands with former channel support and is backed by the 200-day moving average at 99.67. A breach / close above this moving average would be needed to suggest this was a false break scenario with critical resistance unchanged at 100.15/35.
Bottom line: We are looking to confirm the break below the September channel early in the month. From a trading standpoint, rallies should be limited to the 200DMA IF price is heading for a larger correction here with a close below 99.27 needed to keep the bears in control.
-MB

CORE5 WEEKLY WARMAP — 1 DECEMBER 2025The market opens the week with the dollar locked inside a well-defined range between 97.67 and 99.98. Price is sitting near the mid-zone around 98.60, showing no structural breakout. Until one of these levels is taken out with conviction, this is a rotation environment, not a trend environment.
Yields continue to firm. The 10-year is up about 1.63 percent and the 2-year roughly 1.66 percent. Higher yields paired with a rangebound dollar create a more selective backdrop for risk assets. ES holds strength inside its upper band, but rising volatility signals a shift toward more two-way movement. Gold liquidated last week’s high and remains in a two-month bullish range. Across the six-chart grid, the underlying message is the same: strength on the surface, tension underneath.
The calendar is dense. ISM Manufacturing, ADP employment, ISM Services, trade balance, consumer credit, Michigan sentiment, and the full employment situation report arrive in a tight cluster. Each print feeds directly into expectations for the Fed’s December path.
Through the CORE5 lens, the dollar’s range defines the entire week. Market Structure confirms a rotation box. Dynamic Geometry shows price in discount, favoring fast intraday swings rather than smooth trends. Volume Flow flipped bearish last week after failing the bullish daily range, turning prior volume shelves into supply. Order Flow across FX pairs remains bullish, removing justification for blind shorting of risk assets. Execution must stay high-frequency, level-to-level, and based on clear confirmation.
The weekly thesis is direct: markets are being driven by firm yields and a heavy sequence of U.S. data. This is a reaction-driven week, not a predictive one. Intraday rotations offer more clarity than directional conviction.
The takeaway: the dollar remains inside its box, yields are firm, and volatility is rising. Treat every level as a behavior test. Trade the rotations, not your opinions.
— CORE5DAN
Institutional Logic. Modern Technology. Real Freedom.

GU HSC+MHGU is reaching MH, DXY SL+PL confirmation dictates possible reversal, volatility in overlap session is the risk factor here that might either benefit the trade or backfire

EURUSD ShortEntering a backup trade on EURUSD. Price has come up into the WH level within the PL zone and RSI is showing being overbought. There is DXY coming into a WL level too

DXYU.S Dollar Index
- Buy Side Liquidity
- Break of Structure
- Completed " 12345 " Impulsive Waves
- Change of Characteristics
- RSI - Divergence

Shorting the dollar/ DXY until...We can talk about fundamentals or we can go based off what price is currently doing. NOT trying to predict a whole structure change that would be bias for longs on the daily timeframe. Be cautious yes but buying now would be like trying to swim on land. Only Until the 4hr zone is breached it would make sense for possible long plays. Cheers!
Michael M.

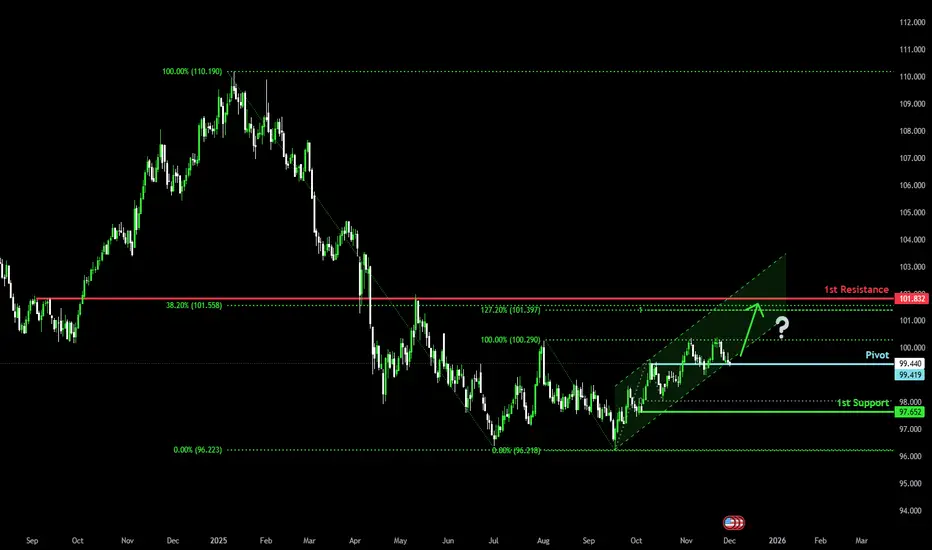
Could we see a bullish reversal?US Dollar Index (DXY) is reacting off the pivot and could bounce to the 1st resistance which lines up witht he 38.2% Fibonacci retracement.
Pivot: 99.41
1st Support: 97.65
1st Resistance: 101.83
Disclaimer:
The opinions given above constitute general market commentary and do not constitute the opinion or advice of IC Markets or any form of personal or investment advice.
Any opinions, news, research, analyses, prices, other information, or links to third-party sites contained on this website are provided on an "as-is" basis, are intended to be informative only, and are not advice, a recommendation, research, a record of our trading prices, an offer of, or solicitation for, a transaction in any financial instrument and thus should not be treated as such. The information provided does not involve any specific investment objectives, financial situation, or needs of any specific person who may receive it. Please be aware that past performance is not a reliable indicator of future performance and/or results. Past performance or forward-looking scenarios based upon the reasonable beliefs of the third-party provider are not a guarantee of future performance. Actual results may differ materially from those anticipated in forward-looking or past performance statements. IC Markets makes no representation or warranty and assumes no liability as to the accuracy or completeness of the information provided, nor any loss arising from any investment based on a recommendation, forecast, or any information supplied by any third party.
Is USD starting to turn around?Hello traders
We are 9 trading days away from the FOMC rate decision.
The probability of a rate cut is at 87% according to the CME FedWatch tool.
Since this cut is well priced into the market, the unknown is the FOMC dot plot.
There is uncertainty about the US labor market and inflation because of the Government shutdown.
I am highlighting only price action in this idea. I have purposely chosen a short time frame to finalize my decision within the next couple of hours.
The prudent action will be to wait for the 3 hour candles to close.
It is also month end, so there will be more volume traded.
Please do your own research.
Best of luck

Downfall of DXY?!? Bears Flag The Possibility!Here on TVC:DXY we can see that last week it ended in a Bearish Breakout of an Ascending Channel, the perfect Bear Flag scenario!
Now price closed the week on the ascent possibly being the Retest of the Breakout.
If the Channel holds price on a successful retest, TVC:DXY will drop!
Fundamentally, USD has impactful news all week this week. Even so, with limited data from back logged events not available until after next FOMC Meeting, this means the Federal Reserve will continue to make decisions in "the dark" and with a high probability of a Rate Cut coming in December!
If the Bear Flag is successful in being a continuation pattern set-up, we could see price drop down to the prior Low of November under 99!

a potential melt-up scenario for risk assetsWhy I Believe the S&P 500 Could Hit a New All-Time High Before Year-End?
The current macro setup suggests a potential melt-up scenario for risk assets, driven by liquidity dynamics and dollar behavior:
Credit Risk (BAC CDS): Low levels indicate stable credit conditions and minimal systemic stress.
Bond Volatility (MOVE Index): Trending lower, signaling financial stability and reduced fear in fixed income markets.
Fed Liquidity: Despite ongoing QT and balance sheet reduction, net liquidity remains steady around $6.70T, supporting market resilience.
The Key Variable: DXY (Dollar Index)
Critical Support Zone: The dollar’s next move will dictate risk appetite.
✅ Breakdown of DXY uptrend: Expect a strong bullish rally across equities, crypto, and metals.
❌ Rebound from support: Upside for risk assets will be capped.
Additional Catalysts
Fed Liquidity vs. Dollar: Any pause in QT or liquidity injection weakens the dollar, fueling risk-on sentiment.
Silver’s Role: A breakout toward $80 would signal inflation and eroding confidence in the dollar, indirectly pressuring DXY lower.
Bottom Line
Dollar movement is the main driver. A DXY breakdown, combined with stable liquidity and silver strength, could trigger a melt-up scenario for major assets.

DXY Bearish Dollar should go previous months low
Monthly double purge
Weekly key level.
If Daily x-Day high run good entry.

DXYHow to become successful in forex and stock trading: 1.Master fundamentals and technical analysis. 2,Build and follow a solid trading plan. 3.Apply strict risk management (1–2% rule). 4.Stay disciplined—control fear and greed. 5.Record and analyze every trade. 6.Focus on high-quality setups only. 7.Diversify across assets and markets. 8.Keep evolving—study, adapt, and grow daily.

DXY: Dollar Index Mid-Term OutlookThe U.S. Dollar Index is maintaining a steady corrective rhythm on the 4-hour timeframe, with recent price behaviour indicating a potential shift in momentum as markets transition into December. Current swings highlight an evolving structure where buyers and sellers continue to balance out ahead of key macro catalysts.
Disclosure: We are part of Trade Nation's Influencer program and receive a monthly fee for using their TradingView charts in our analysis.
