Celestia · A Strong Bullish Wave of GrowthCelestia right now looks pretty good. This one was called to my attention by one of my followers in the comments. The truth is that we've been looking at TIAUSDT and right now it continues to look good. The candles message is that the action is about to transform into a very strong advance. The acti

Celestia (TIA): Market Structure Break | Good Buying OpportunityTIA formed a decent MSB, which marked a switch in trend. We are looking for further movement to upper zones from here, which would give us good R:R ratio trading setups so let's see.
Swallow Academy

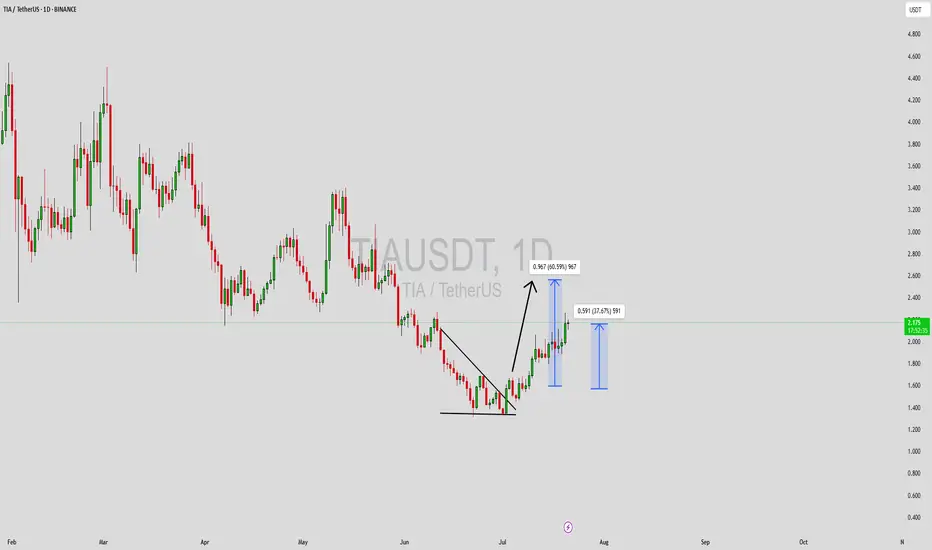
TIA- Is the Coin Finally Ready to Wake Up?After its launch on Binance in November 2023 and the immediate 10x pump, BINANCE:TIAUSDT has been, to put it mildly, a constant disappointment.
Since then, the hype has faded, and the price slowly deflated — leaving holders frustrated and the chart uninspiring.
🔍 Recent Signs of Life
However
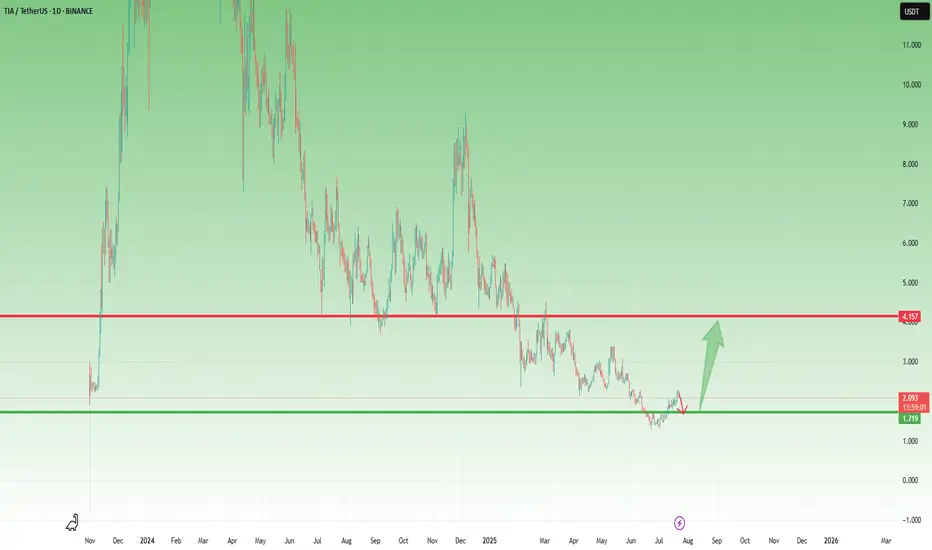
TIA Holding Support – Break Above $2.20 Could Trigger Big MoveLast week, I mentioned that TIA could be preparing for a move and that buying dips around $1.75 might be a good opportunity.
Well, price dropped exactly into that support zone, bounced slightly, and is now consolidating, which could be the calm before the next wave.
_________________________________
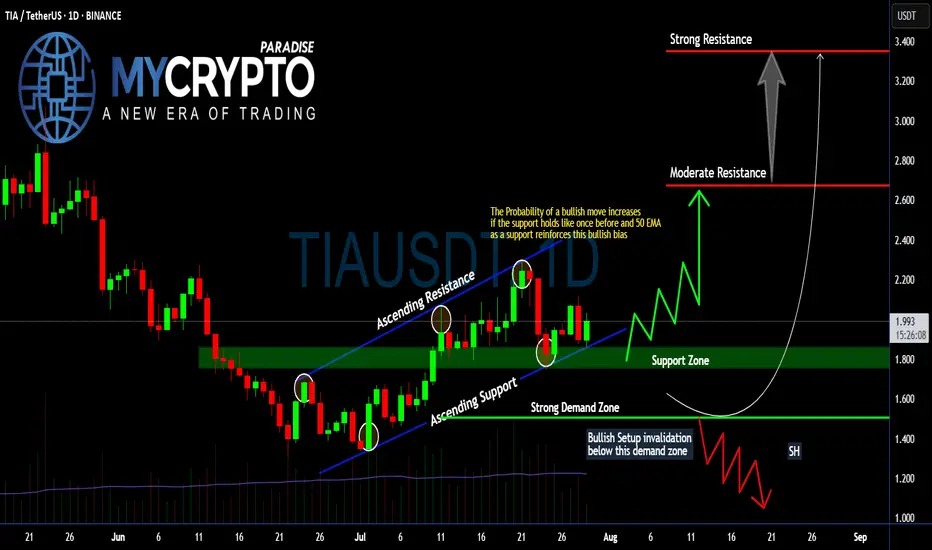
Will #TIA Continue to Soar or Bears Can Halt it? Must Watch Yello, Paradisers! Will we see #TIA continue to soar from here, or can bears halt its momentum? Let's see the latest setup of #Celestia to see what's going to happen:
💎Following a textbook ascending channel structure, #TIAUSDT has been respecting both its ascending resistance and ascending support,
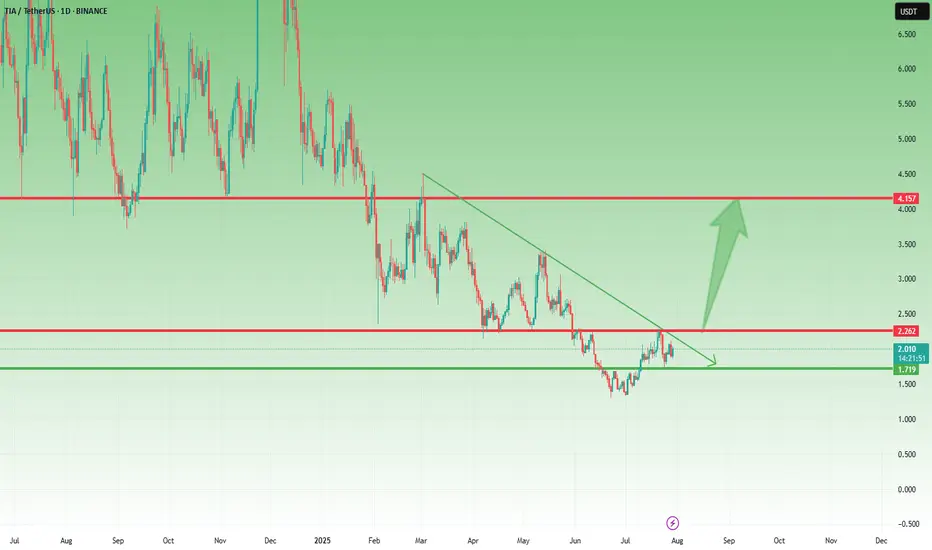
TIAUSDT 1D#TIA is on the verge of breaking out above a major resistance cluster, which includes the descending channel, the Ichimoku Cloud, and the daily SMA100. Keep an eye on it — every dip could present a solid buying opportunity.
In case of a confirmed breakout above the resistance cluster, the targets ar

TIA Trying Catch Falling Knifeafter downtrend continuation from early December 2024, i think we will meet target around 1.2 with several factor
if we can hold this line maybe we will have small pullback for retest resistance

TIA – Fresh Breakout Unfolding from Daily ChannelLSE:TIA is setting the stage for a potential shift in momentum as it breaks out of the descending channel on the daily timeframe 🚀.
This kind of breakout often signals a change in direction, especially if the market confirms the move with a successful retest 🔁.
So far, price action is hinting at
TIAUSDT Forming Falling WedgeTIAUSDT has recently shown a bullish breakout from a falling wedge structure on the daily timeframe—a pattern known for its strong reversal signals. This move is supported by rising trading volume, signaling fresh momentum entering the market. With current price action pushing higher, the short-term
TIA/USDT – Major Breakout Incoming? Reversal in Sight!🔍 Full Technical Analysis (1D Timeframe):
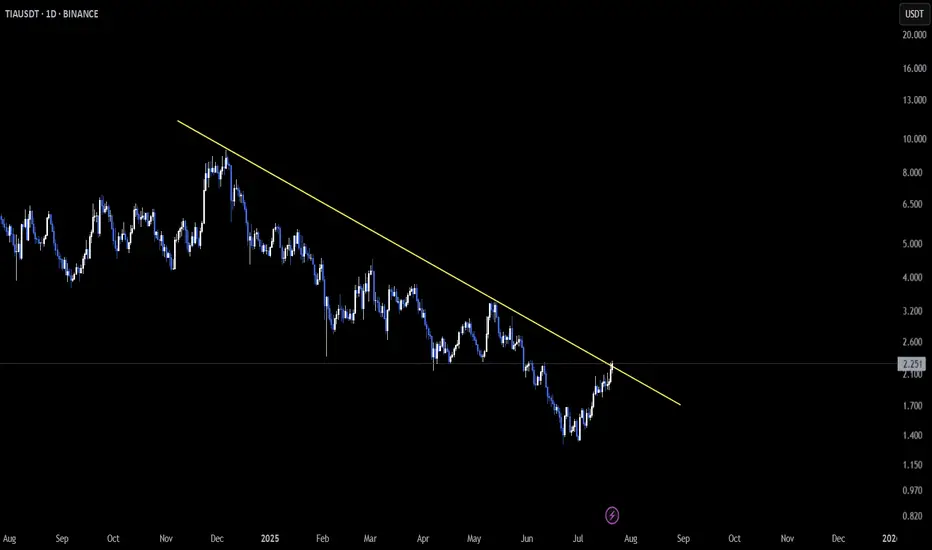
TIA/USDT is approaching a critical turning point after experiencing a strong downtrend since December 2024. The chart clearly forms a Falling Wedge pattern — a classic bullish reversal signal known for explosive breakouts when confirmed.
Currently, the pri

See all ideas
Summarizing what the indicators are suggesting.
Oscillators
Neutral
SellBuy
Strong sellStrong buy
Strong sellSellNeutralBuyStrong buy
Oscillators
Neutral
SellBuy
Strong sellStrong buy
Strong sellSellNeutralBuyStrong buy
Summary
Neutral
SellBuy
Strong sellStrong buy
Strong sellSellNeutralBuyStrong buy
Summary
Neutral
SellBuy
Strong sellStrong buy
Strong sellSellNeutralBuyStrong buy
Summary
Neutral
SellBuy
Strong sellStrong buy
Strong sellSellNeutralBuyStrong buy
Moving Averages
Neutral
SellBuy
Strong sellStrong buy
Strong sellSellNeutralBuyStrong buy
Moving Averages
Neutral
SellBuy
Strong sellStrong buy
Strong sellSellNeutralBuyStrong buy
Displays a symbol's price movements over previous years to identify recurring trends.