Free signal hello friends👋
🌟Considering that the price reaches an important weekly support, the price is expected to grow, so you can enter into a transaction with risk and capital management and move to the specified goals.
🔥Follow us for more signals🔥
*Trade safely with us*

TIAUSDT Forming Descending TriangleTIAUSDT is gaining attention as traders and investors look for fresh opportunities in the altcoin market. With good volume backing recent moves, this crypto pair shows promising potential for a 40% to 50%+ gain in the near term. Although there’s no specific pattern visible right now, the price actio

TIA/USDT buy setupAfter a recent liquidity sweep below key support, TIA/USDT is showing strong signs of accumulation. The price has reclaimed a critical zone and is now establishing a solid support base, suggesting a potential reversal in structure.
Stop Loss: Below the recent sweep low to protect against invalidati

TIA Trying Catch Falling Knifeafter downtrend continuation from early December 2024, i think we will meet target around 1.2 with several factor
if we can hold this line maybe we will have small pullback for retest resistance

TIA Scalp trade setupwait for the retest of breakout, set sl & tp. While on swing trade will long below 1.31 and tp 2.0$, TIA is extremely oversold, So less affected by BTC.

TIAUSDT – Potential Reversal in Play Price is showing early signs of a bullish reversal after a prolonged downtrend.
Currently testing the 200 EMA from below, a key decision zone.
Plan:
• Entry Zone: Above 1.550 (pending confirmation)
• SL: 1.519 (below recent demand zone)
• TP: 1.835
• RR: 1:5+
⚠️ If price reclaims the 200 EMA

$ENS / USDT Daily Time frame, MAJOR PUMP?Chart Overview
- Pattern Identified: Falling Wedge Pattern
- A bullish reversal pattern, often appearing after a downtrend.
- Three major touchpoints on the lower trendline indicate strong support and pattern validity.
Demand Zone (Support Area)
- Marked near the current price level (

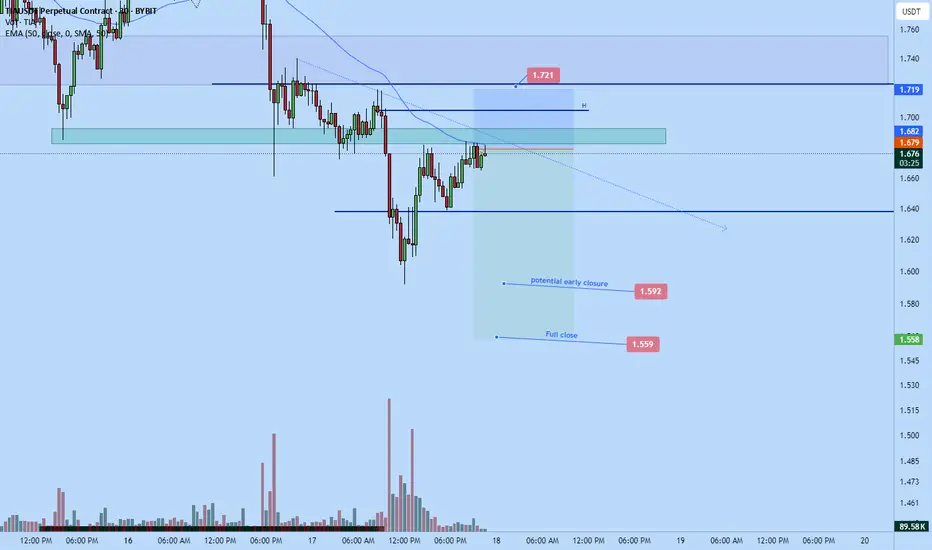
Tia short-dump continues to $1.56Just took a short position on Tia.
Target: $1.56
Stop: $1.721
roughly 3RR
Market likely to continue dumping soon
DTT applied.
OVerall market is heading down, market objective is likely to make new lower lows. Correction happening now before continuation. Market is back at supply area that sold
TIA Dynamic Support Line for Buy PointsThe support I have set for Tia purchase
The QT process is ongoing. There is no liquidity in the market. In non-major markets, support levels are dynamically shifting downwa

TIA Dynamic Support LineThe support I have set for Tia purchase
The QT process is ongoing. There is no liquidity in the market. In non-major markets, support levels are dynamically shifting downwards.

See all ideas
Summarizing what the indicators are suggesting.
Oscillators
Neutral
SellBuy
Strong sellStrong buy
Strong sellSellNeutralBuyStrong buy
Oscillators
Neutral
SellBuy
Strong sellStrong buy
Strong sellSellNeutralBuyStrong buy
Summary
Neutral
SellBuy
Strong sellStrong buy
Strong sellSellNeutralBuyStrong buy
Summary
Neutral
SellBuy
Strong sellStrong buy
Strong sellSellNeutralBuyStrong buy
Summary
Neutral
SellBuy
Strong sellStrong buy
Strong sellSellNeutralBuyStrong buy
Moving Averages
Neutral
SellBuy
Strong sellStrong buy
Strong sellSellNeutralBuyStrong buy
Moving Averages
Neutral
SellBuy
Strong sellStrong buy
Strong sellSellNeutralBuyStrong buy
Displays a symbol's price movements over previous years to identify recurring trends.