USNAS100 | Geopolitical Tensions & Fed in Focus – Pivot at 23690USNAS100 Overview
Geopolitics dominates before the Fed takes the stage.
Putin’s position remains that Ukraine should cede all territory Russia has occupied — and even areas it has failed to capture in more than three years of fighting. This has been firmly rejected by Zelenskiy and European leaders, who will stand alongside him in Washington when he meets Trump later today.
Technical Outlook:
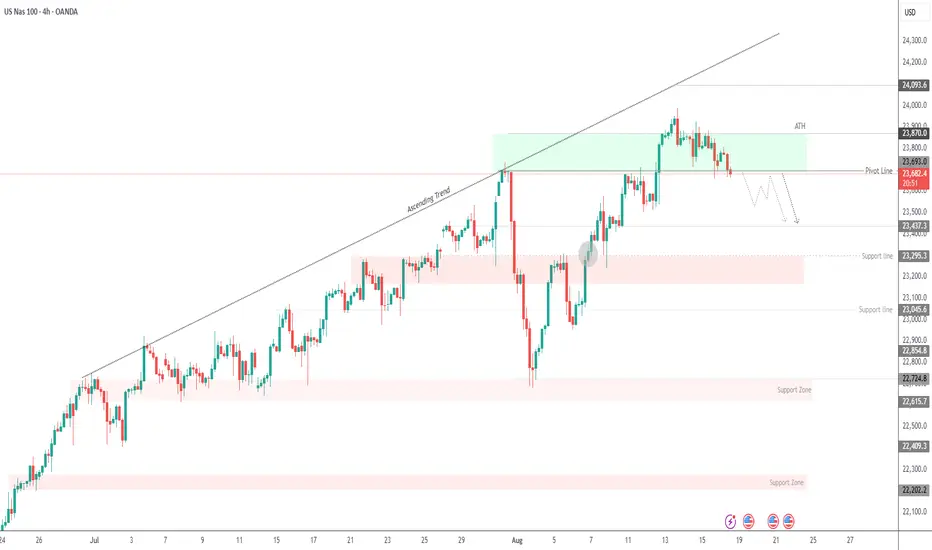
Price looks set to stabilize below 23690, which would extend the bearish trend toward 23435 and 23295.
A 4H close above 23690 would shift the outlook bullish, targeting 23870.
Pivot: 23690
Support: 23550, 23435, 23295
Resistance: 23870, 24090
USTEC trade ideas
NASDAQ Index Analysis (US100 / NASDAQ):The index shows a long-term bullish trend (daily timeframe), while the short-term trend on the hourly chart is bearish. Currently, the price is trading near 23,200.
🔻 Bearish Scenario:
If the price breaks below 23,160 and holds, it may head toward 23,000, and with continued selling pressure, it could extend to 22,800.
🔺 Bullish Scenario (Most Likely):
If buying momentum appears and the price manages to break and hold above 23,350, this could support further upside toward 23,500, and strong bullish continuation may open the way to test 23,680.

#NDXThis appears to be forming a wave 4 correction cycle with a 2x zig zag pattern that will be followed by another bullish 5 wave sequence.

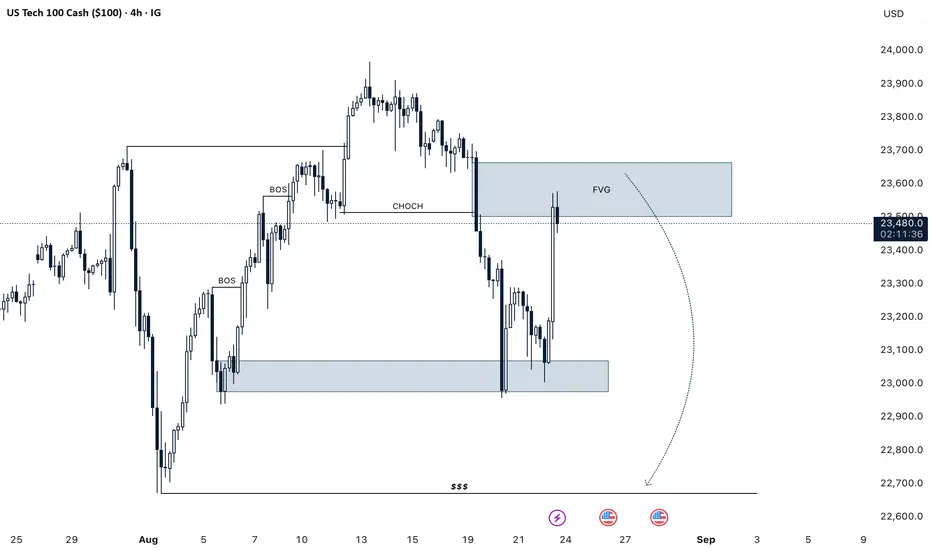
NASDAQ H4 We Are Selling Nasdaq Here Due To Market Structure Changed Bullish To Bearish NQ Gives Us Bearish Choch And Fair Value Gap Thats We Are Selling NQ Right Now Targeting Sell Sides Liquidity
Manage Your Trade According To Your Capital
And Follow Us For More Trades
USNAS100 Update | Fed Pressure Keeps Market Under Bearish BiasUSNAS100 – Overview
Tech fright calms but Fed pressure grows
U.S. tech stocks appear to have stabilized after two sessions of sharp declines, but uncertainty persists as the Treasury market reacts to the latest Federal Reserve developments ahead of the central bank’s annual Jackson Hole symposium in Wyoming.
Technical Outlook
USNAS100 maintains a bearish setup while below 23,295.
A break and sustained close above this level would signal a potential bullish reversal.
📍 Key Levels
Pivot: 23,295
Support: 23,165 – 23,045 – 22,850
Resistance: 23,430 – 23,540 – 23,690
previous idea:


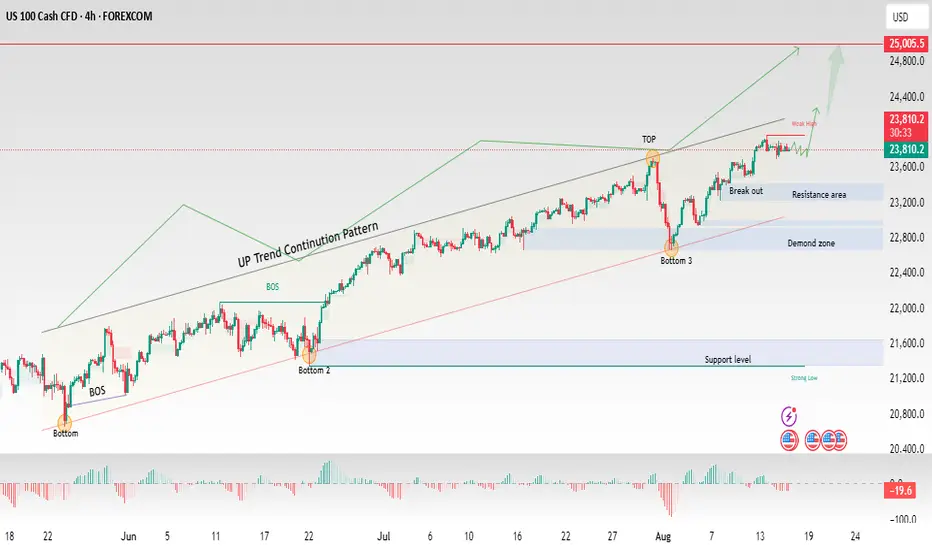
NAS100 – Strong Bullish Structure Points to 25,000 TargetThe NAS100 has been respecting a clear bullish market structure, forming consecutive higher highs and higher lows since June. After completing an uptrend continuation pattern, the index broke above the resistance area and is now consolidating near a weak high, signaling potential for further upside momentum.
🔹 Market Structure:
Bottom 1 → BOS → Bottom 2 → BOS → Bottom 3 formed a solid base for continuation.
A strong breakout confirmed the bullish bias.
Demand zones have been respected multiple times, showing institutional buying pressure.
🔹 Key Technical Levels:
Immediate Resistance: 23,800 – 23,900
Major Target Zone: 25,000 psychological level
Support Levels: 23,200 (short-term), 22,800 demand zone, 21,600 major support
🔹 Bullish Outlook:
If the price holds above 23,600 and buyers defend the resistance area, we could see a strong rally toward the 25,000 mark. The trend remains bullish unless the market closes below 22,800 demand zone, which would indicate weakness.
Trend: Bullish
Sentiment: Positive
Targets: 25,000 short-to-medium term
Risk Level: Moderate.
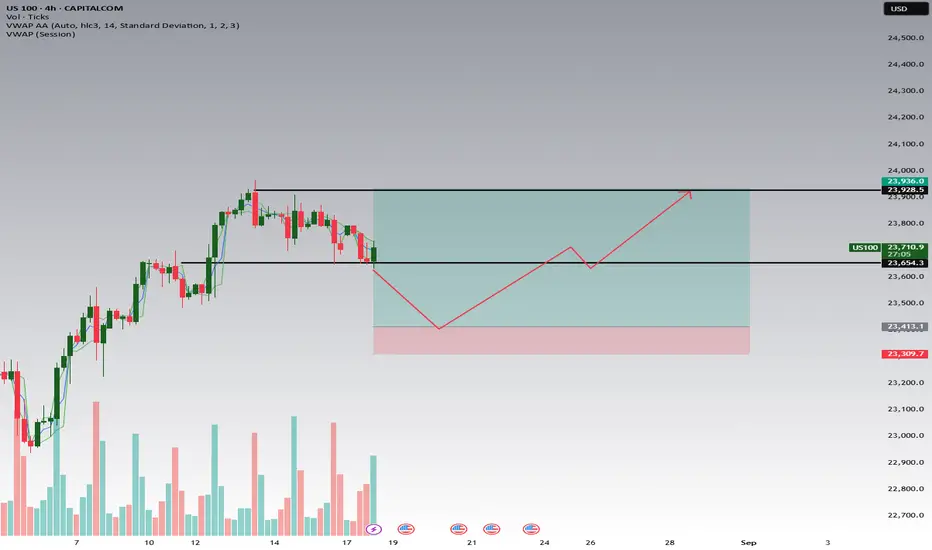
Nasdaq 100 – Key Entry Line at 23,413On this chart, my main focus is the entry line at 23,413.
I expect the price to make a move down toward this level.
The chart is kept simple — no unnecessary indicators — because the most important element here is the VWAP line, which also aligns with the manipulation zone where bigger players often create false moves.
If the market falls into the 23,413 zone, I’ll be watching closely for reactions and possible reversal setups.
⚠️ Disclaimer & Personal View:
This is not a signal service and I am not selling anything.
In my opinion, many signal providers fool their customers by showing only winning trades, promising unrealistic win rates, and hiding real risks.
Trading is never guaranteed — every trader must make their own decisions and manage risk properly.
My chart here is only my personal analysis and opinion, shared for educational purposes.
👉 Do you also want me to add targets (like 23,600 or 23,930) and possible stop-loss placement to make it look more complete for TradingView readers?
You said:
yes
ChatGPT said:
Perfect 👍 Here’s the expanded TradingView idea with entry, targets, and stop placement included:
📉 Nasdaq 100 – Key Entry Line at 23,413
On this chart, my main focus is the entry line at 23,413.
I expect the market to fall into this level, which I see as both the VWAP line and a potential manipulation zone used by bigger players.
Plan:
📍 Entry zone: around 23,413
🎯 Target 1: 23,600 (first reaction level)
🎯 Target 2: 23,930 (upper resistance and recent highs)
🛑 Stop-loss: below 23,300 (invalidation of setup)
The chart is intentionally kept simple, without unnecessary indicators, to highlight the importance of this single level.
⚠️ Disclaimer & Personal View:
This is not a signal service and I am not selling anything.
In my opinion, many signal providers fool their customers by showing only winning trades, promising unrealistic win rates, or using tricks like martingale strategies that can blow accounts.
Trading always involves risk. What I share here is only my personal analysis and opinion, not financial advice.
NASDAQ| BULLISHHTF Bias: Bullish. Structure intact, bullish intent confirmed, previous highs broken to the upside. All bullish setups remain valid. Strong 4H levels holding; price pushing upward cleanly — past interventions not a concern.
MTF Observation: Deep liquidity formed on the sell side. We’re waiting for it to be taken out to mitigate order block areas between 23,500–23,400. Once sweep occurs, refined internal structure will align for bullish continuation.
Entry Plan: After order block mitigation, drop to lower timeframes for CHoCH confirmation and precision entry. Until then, we observe, follow price, and maintain patience.
Mindset Note: Play smart money. Stay disciplined. Hold your spot, let the market show the path, then execute with precision. Let’s go. 🚀

NAS100 Analysis – Bullish Channel Break & Retest in Progress📌 Key Highlights:
Bullish Channel Broken: Price failed to respect the upward trend channel. Although the candle bodies held above a support zone, price wicked through to test a lower level – indicating a weakening bullish structure.
Pressure Reversal Zone: Around 23,800, price ran out of momentum. Downward pressure entered the market, shifting the trajectory and breaking the previous bullish pattern.
Confirmed Zones via Retest: Each zone was respected by a clean retest, reinforcing their validity as support/resistance areas. This is textbook price action – confirming zones before continuation.
Current Candle Behaviour: The most recent green candle has no top wick, showing strong buyer conviction. However, the bottom wick is long, meaning bears are still present and applying pressure.
Decision Point: We’re at a critical moment. Will price break above this level to reclaim the channel — or reject and fill the imbalance left behind by the last bullish move?
📉 Scenario 1 – Rejection & Continuation Down
If price fails to break and close above this resistance, we could see a bearish continuation — potentially aiming for the next key support zone around 22,677.
📈 Scenario 2 – Bullish Recovery
If bulls maintain strength and close above this level with volume, we could see price climb back toward 23,500+ to retest the upper zone.
✅ Bearish Bias
Price broke below the bullish channel structure (a major technical shift).
Retests have confirmed lower zones — typical bearish continuation behaviour.
The current green candle has no upper wick (buyers trying to push), but a long lower wick shows bears are still active.
Downward pressure has already shifted momentum, and we’re now waiting to see if the zone holds.
🟡 However – Confirmation Needed
If price fails to break above this current resistance zone, then bearish continuation becomes confirmed.
If price closes strong above this level and reclaims the channel, the bias would shift neutral to bullish again.
📌 Final Bias Statement:
Bearish bias for now — unless price cleanly breaks back above the resistance zone. Current price action suggests a possible continuation down to fill the wick and test deeper support zones.
🧭 Watching for:
Candle body closures above or below key zones
Wick reactions showing liquidity grabs
Momentum shifts in volume
🔔 Stay sharp. Trade with confirmation, not emotion.
By AutoMarkets | Built. Not Begged.

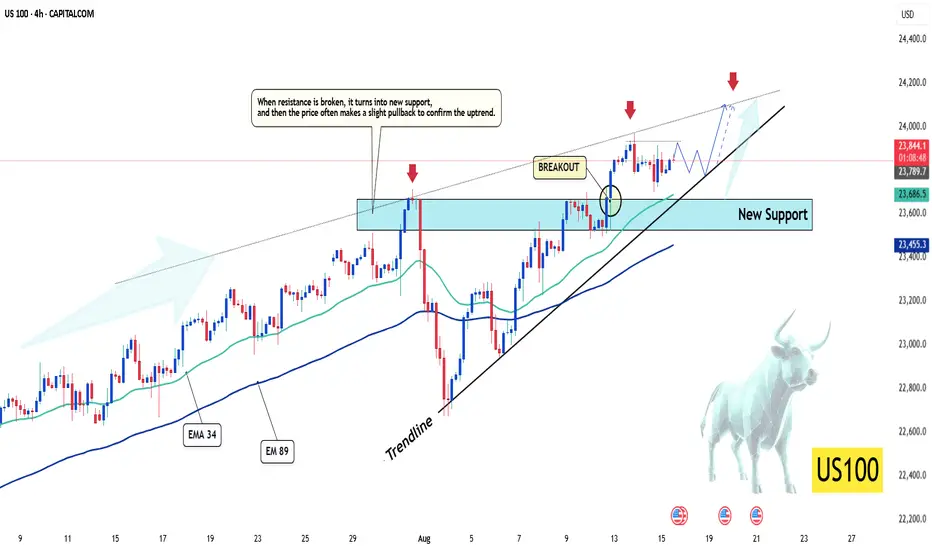
US100 – Bullish Momentum Holds Strong After BreakoutHello, what are your thoughts on CAPITALCOM:US100 ?
The US100 index is trading around 23,852, holding steady after a strong breakout from the previous resistance, now acting as new support at 23,685. This bullish structure is supported by the latest US economic data, which eased investor concerns — with lower inflation readings and recovering corporate earnings, boosting risk appetite.
On the 4H chart, price remains above both the EMA 34 and EMA 89, indicating strong underlying momentum. The recent breakout was followed by a period of consolidation, showing healthy market behavior before the next upward move. As long as price stays above the trendline, buyers maintain full control.
Even if a short-term pullback occurs, the support zone at 23,687 remains a solid base for buyers to re-enter near 24,200.
My outlook is bullish, what do you think? Leave your thoughts in the comments!
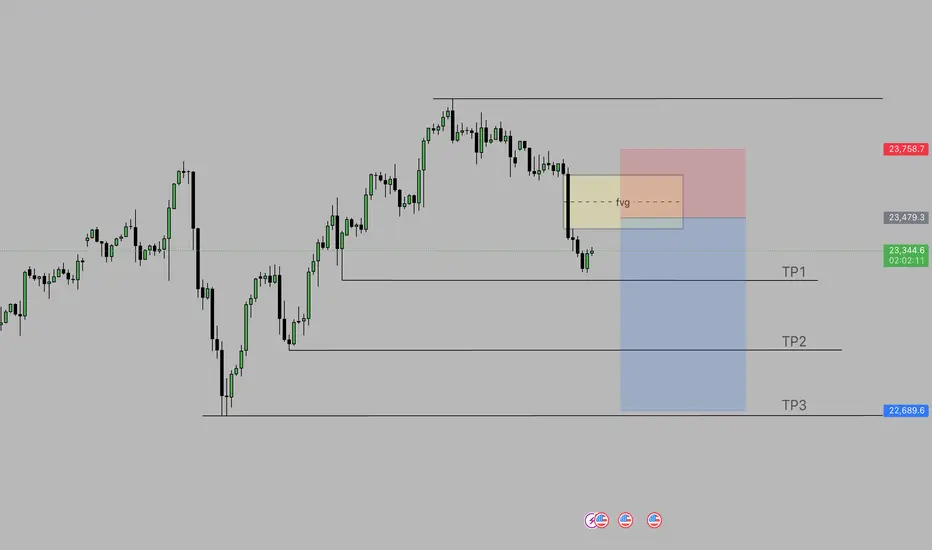
US100 SELLAfter us100 rises to its fvg in 4h, it will take the gap here and fall back to its targets below.
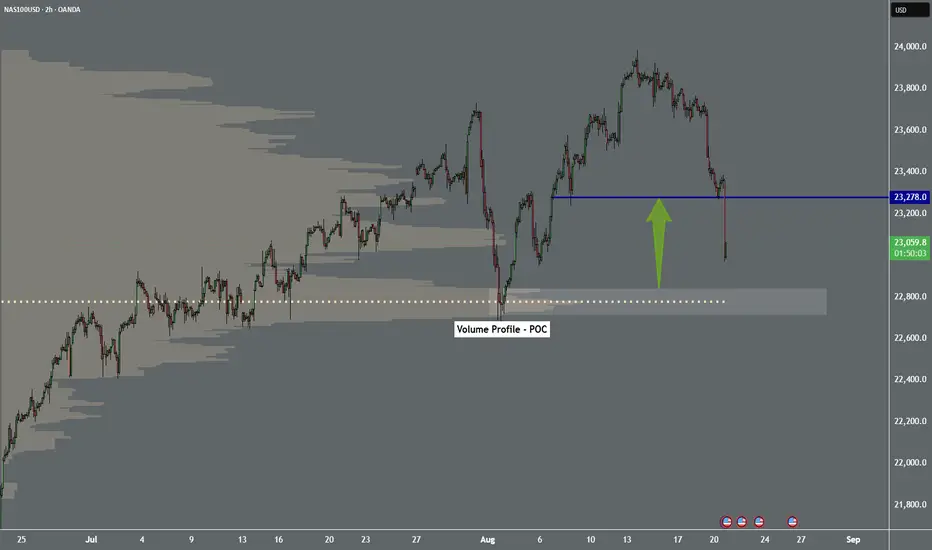
NAS100 - Volume ProfileDear Friends in Trading,
Expect a strong bounce from POC area.
I sincerely hope my point of view offers a valued insight.
Thank you for taking the time study my analysis.
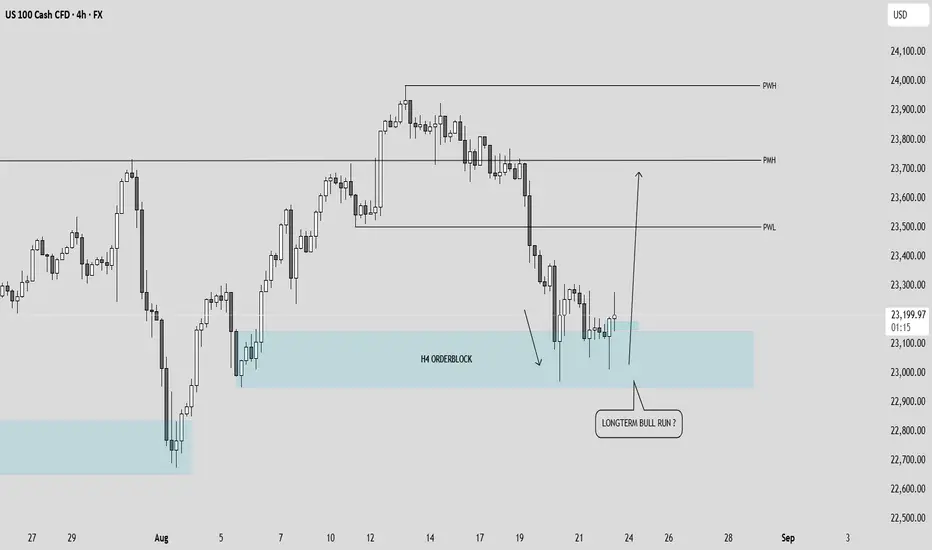
NAS100: BUY OPPORTUNITY AT H4 ORDERBLOCKHello traders Here's my point of view about PEPPERSTONE:NAS100
TECHNICALLY:
Price this week was very bullish until today FRIDAY. AS you can see price reached the psychological area of 23.000. Currently, price action seems to reject and print pin bars at the H4 ORDERBLOCK. This is a make-or-break area.
As long as we stay ABOVE 23 000 we can consider to look for BUY entries but only if fundamentals, confluences & confirmations. Otherwise, the area will be completely invalidated
I personally took a quick buy at the 23 080 AREA.
FUNDAMENTALLY:
All eyes on TRUMP speech today as well as Jackson Hole Symposium
You may find more details in the chart!
Thank you and Good Luck! MAKE SURE TO STAY STRICT WITH YOUR RISK MANAGEMENT!
PS: Please support with a like or comment if you find this analysis useful for your trading day.
NASDAQ After the Fireworks: Bearish Setup LoadedAfter the classic 4th of July rally, I stepped in on the short side of Nasdaq, targeting 22,000 and 21,400 zones. The market structure shows exhaustion, and with the cloud retest failing to hold new highs, I positioned accordingly.
Technical:
• Price stalled at prior expansion highs with tight compression near 23,000.
• Daily FibCloud offered resistance confirmation.
• Bearish risk-reward skew forms after extended rally and thin retraces.
• Volume divergence spotted.
Fundamentals:
Multiple overlapping uncertainties:
• Trump confirmed tariffs will take effect on August 1, threatening a 10% surcharge on BRICS-aligned nations.
• Treasury Secretary Bessent anticipates several trade deal announcements within 48h—but stresses quality over quantity.
• Bank of America maintains its base case of 0 rate cuts in 2025, citing strong economic data and sticky inflation risks.
The combination of tariff escalation, hawkish monetary expectations, and global trade friction creates a perfect backdrop for volatility and correction—especially in overextended tech indices like the Nasdaq.
Note: Please remember to adjust this trade idea according to your individual trading conditions, including position size, broker-specific price variations, and any relevant external factors. Every trader’s situation is unique, so it’s crucial to tailor your approach to your own risk tolerance and market environment.


NAS100 3 Drive Pattern Correction Wait For BoS📊 The NAS100 has pulled back after a strong bullish run and is currently facing some pressure 📉. I’m watching a three-drive pattern that appears to have extended into a fourth drive, followed by a corrective phase 🔄. From a smart money perspective, liquidity is often targeted after a strong expansion in trend — patterns like the three-drive can frequently lead to a deeper retracement before the continuation resumes. With that in mind, I’m anticipating the possibility of a further pullback before positioning for a potential long setup on a bullish break of structure 🚀 (not financial advice).

A case for a correction of the US100While the long-term trend remains bullish, several short-term factors suggest the index is poised for a significant pullback.
Why the US100 Could Be Bearish
Several key factors point to a potential downturn for the US100 in the coming days:
Elevated Valuations and Overbought Conditions: The US100 has experienced a rapid and significant rally in recent months, fueled largely by the enthusiasm for AI and the "Magnificent 7" tech stocks. This has pushed the index to all-time highs, but it has also led to stretched valuations. Many technical indicators, such as the Relative Strength Index (RSI), show that the index is overbought, indicating that momentum may be running out and a correction is due. 📉
Doubt on a Fed Rate Cut: While recent inflation data showed a slight cooling, some analysts are pushing back against the idea of a certain September rate cut. The core inflation number remains above the Fed's 2% target, and some Fed officials may express a more cautious or "hawkish" stance at this week's Jackson Hole Symposium. A hawkish surprise from the Fed would likely lead to a sharp sell-off in growth stocks, which are sensitive to interest rates.
Geopolitical and Trade Uncertainty: The ongoing trade tensions, particularly with China, continue to create a cloud of uncertainty. While a temporary truce has been announced, any renewed rhetoric or action could trigger a flight to safety, with investors pulling money out of riskier assets like technology stocks.
Slowing Economic Growth: The U.S. economy's underlying health remains a concern. GDP growth in the first half of the year was modest, and the labor market has shown signs of weakening. This economic softness, combined with the potential for tariffs to increase inflation in the second half of the year, could lead to a less optimistic outlook for corporate earnings, especially for multinational tech companies.
Key Technical Levels to Watch
A breakdown of key support and resistance levels can help define the potential bearish path.
Primary Resistance Zone: The immediate overhead resistance is the all-time high zone, which sits between 23,875 and 24,000. A failure to break above this area would confirm a bearish bias.
Immediate Support: The first critical support level is around 23,690. A sustained break below this would likely trigger further selling.
Correction Targets: A deeper correction could see the index fall toward the 23,500 zone, which represents a key technical support level. If that level breaks, the next target for bears would be the 22,800 mark.
In summary, while the long-term trend remains positive, the confluence of high valuations, potential hawkish Fed commentary, and a weakening economic outlook creates a significant risk for a bearish correction in the US100 over the next two weeks.
NASDAQ (CASH100) – Buy the Dip or Trend ReversalThe Cash100 has been trending in an upward channel since May 2025.
Today, price has broken through diagonal support.
For confirmation that the upward channel is over, I will be looking for these signals:
✅ First signal: a 4H close below diagonal support.
✅ Second signal: a retest of the diagonal. If price fails to reclaim,
I’ll start looking for short setups if both signals above confirm.
What do you think — is the uptrend finally breaking, or will buyers step back in? 👀
Thanks for checking out my post! Make sure to follow me to catch the next update. If you found this helpful, give it a like 👍 and share your thoughts 💬 — I’d love to hear what you think!
Please note: This is not financial advice. This content is to track my trading journey and for educational purposes only.

Bearish drop?US100 is rising towards the resistance level, which is a pullback resistance, and could drop from this level to our take profit.
Entry: 23,546.52
Why we like it:
There is a pullback resistance.
Stop loss: 23,936.40
Why we like it:
There is a swing high resistance.
Take profit: 22,986.60
Why we like it:
There is a pullback support that lines up with the 78.6% Fibonacci retracement.
Enjoying your TradingView experience? Review us!
Please be advised that the information presented on TradingView is provided to Vantage (‘Vantage Global Limited’, ‘we’) by a third-party provider (‘Everest Fortune Group’). Please be reminded that you are solely responsible for the trading decisions on your account. There is a very high degree of risk involved in trading. Any information and/or content is intended entirely for research, educational and informational purposes only and does not constitute investment or consultation advice or investment strategy. The information is not tailored to the investment needs of any specific person and therefore does not involve a consideration of any of the investment objectives, financial situation or needs of any viewer that may receive it. Kindly also note that past performance is not a reliable indicator of future results. Actual results may differ materially from those anticipated in forward-looking or past performance statements. We assume no liability as to the accuracy or completeness of any of the information and/or content provided herein and the Company cannot be held responsible for any omission, mistake nor for any loss or damage including without limitation to any loss of profit which may arise from reliance on any information supplied by Everest Fortune Group.

When Could Nasdaq's Bearish Momentum Shift ?U.S. stock indices are showing slight declines as investors digest mixed corporate earnings and await key signals from the Federal Reserve, as well as a report from the Massachusetts Institute of Technology, which warned against the hype surrounding artificial intelligence, noting that this technology needs more time to clarify the extent of its reliance. Weak retail results, including a sharp drop in Target’s sales, weighed on market sentiment, while traders remain cautious ahead of the release of the Fed’s July meeting minutes and the upcoming remarks from Chair Jerome Powell on Friday, August 22, at the Jackson Hole conference, searching for clues about the future path of interest rates.
The Nasdaq Composite, dominated by the technology sector, closed Tuesday down 1.4%, marking its largest one-day drop since August 1, while maintaining its downward momentum on Wednesday, August 20.
What can be monitored from a technical perspective to anticipate a potential correction in this index?
Traders should watch the exponential moving average (5), which indicates market momentum (positive when the fast moving average (5) is below the price, and negative when it is above the price). This indicator provides short-term signals of momentum shifts in the markets. As seen in the chart above, if the price rises above the exponential moving average (5) and closes a candle above it on the four-hour timeframe, one should then watch the Relative Strength Index (RSI) to move above 50. In this case, we could see a temporary shift in Nasdaq’s downward momentum toward a short-term upward momentum.

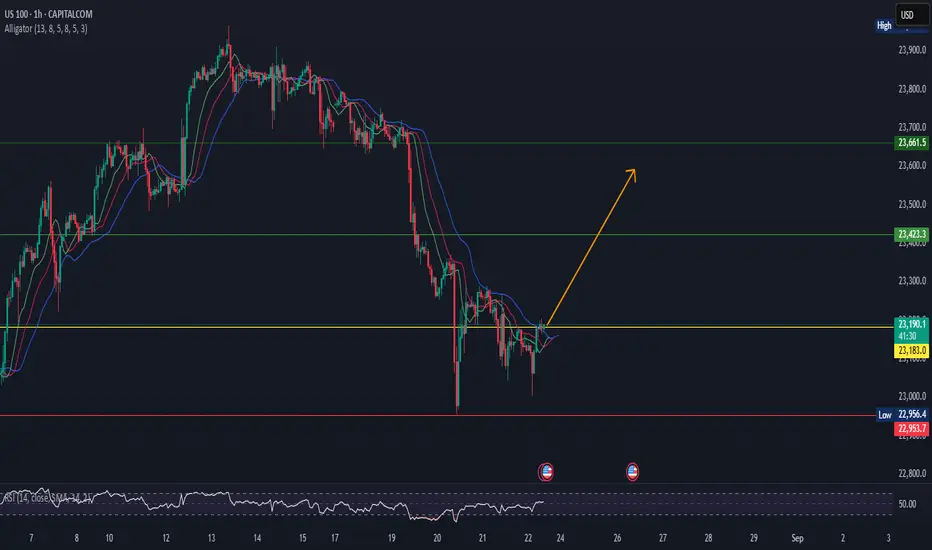
US100US100 is in bearish trend.
Printing LH and LL.
As per my analysis trend will be reveersal form here.
I tried to catch the reversal trend.
Alligator also indicates price will go up.
so buy at CMP.
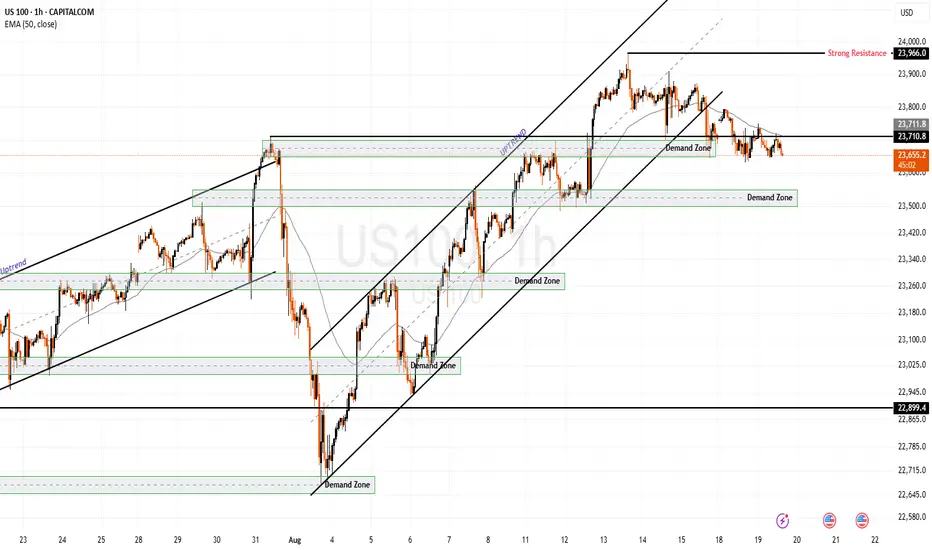
1 hour chart After take out at new ATH last week and break trough the 23700 level i think we are in a desending chanel and the breakout will be up.
The market has show alot of support around 23700 level for days now and after a strong elliot vawe 5 up it would go down alot faster if the bullsih trend was over.
Think we have 123 elliot or 12345 elliot vawe forward us now as long as we break out the desending chanel as i think!
Buy = 23700
Target Phase 1= 23900
Target Phase 2= 24000
Stoploss = 23600
Also fib retracment from the top stop at 0.618 directly wich is another strong support
Rsi 14= around 50 level and on 1 hour chart neutral and looks bullsih there to!
