Hanzo / Nas100 30 Min ( Accurate Tactical Break Out Zones )🔥 Nas100 – 30 Min Scalping Analysis (Bearish Setup)
⚡️ Objective: Precision Breakout Execution
Time Frame: 30-Minute Warfare
Entry Mode: Only after verified breakout — no emotion, no gamble.
👌Bullish After Break : 21710
Price must break liquidity with high volume to confirm the move.
👌Bullish After Break : 21550
Price must break liquidity with high volume to confirm the move.
☄️ Hanzo Protocol: Dual-Direction Entry Intel
➕ Zone Activated: Strategic liquidity layer detected — mapped through refined supply/demand mechanics. Volatility now rising. This isn’t noise — this is bait for the untrained. We're not them.
🩸 Momentum Signature Detected:
Displacement candle confirms directional intent — AI pattern scan active.
— If upward: Bullish momentum burst.
— If downward: Aggressive bearish rejection.
Hanzo / Nas100 30 Min ( Accurate Tactical Break Out Zones )
USTEC trade ideas

Nasdaq-100 Wave Analysis – 19 June 2025- Nasdaq-100 reversed from long-term resistance level 22000.00
- Likely to fall to support level 21000.00
Nasdaq-100 index recently reversed down from the major long-term resistance level 22000.00 (which has been steadily reversing the price from the end of last year).
The downward reversal from the resistance level 22000.00 will form the weekly Shooting Star candlesticks reversal pattern if the price closes this week near the current levels.
Given the strength of the resistance level 22000.00 and the overbought weekly Stochastic, Nasdaq-100 index can be expected to fall to the next support level at 21000.00.

NSDQ100 Geopolitics, Fed & Rates Outlook Geopolitics & Market Sentiment
Iran-Israel conflict enters its sixth day, raising fears of broader escalation.
Speculation is building that Donald Trump may authorize the use of the Massive Ordnance Penetrator (bunker-buster bomb) to target Iran’s nuclear facilities.
Trump is also meeting with Pakistan’s army chief today for talks on Iran, adding to geopolitical uncertainty.
So far, Iran’s oil infrastructure remains intact, and Hezbollah has stayed out of the conflict, limiting immediate economic fallout.
Fed & Rates Outlook
The Federal Reserve is expected to hold rates steady today as it waits for clearer economic signals amid ongoing Trump policy shifts.
Trump is pressuring the Fed, now arguing for lower rates to cut US debt costs.
Traders are building record positions betting on a dovish Fed shift after Powell's term ends in May 2026.
Market Implications for NSDQ100
Nasdaq futures are mildly positive, supported by:
Stability in tech earnings outlook
Expectations of Fed staying on hold, with a possible dovish bias emerging
However, Middle East tensions remain a risk. Any strike on oil infrastructure or major military escalation could:
Trigger a risk-off move
Push oil prices higher, raising inflation concerns
Weigh on tech stocks sensitive to rate outlooks and sentiment
Key Focus for Nasdaq Traders Today:
Fed decision and Powell’s tone (especially on inflation and growth risks)
Headlines from the Middle East
Oil price action near the five-month high (WTI around $73.50–$74)
Resistance Level 1: 22070
Resistance Level 2: 22370
Resistance Level 3: 22780
Support Level 1: 21300
Support Level 2: 21060
Support Level 3: 20820
This communication is for informational purposes only and should not be viewed as any form of recommendation as to a particular course of action or as investment advice. It is not intended as an offer or solicitation for the purchase or sale of any financial instrument or as an official confirmation of any transaction. Opinions, estimates and assumptions expressed herein are made as of the date of this communication and are subject to change without notice. This communication has been prepared based upon information, including market prices, data and other information, believed to be reliable; however, Trade Nation does not warrant its completeness or accuracy. All market prices and market data contained in or attached to this communication are indicative and subject to change without notice.

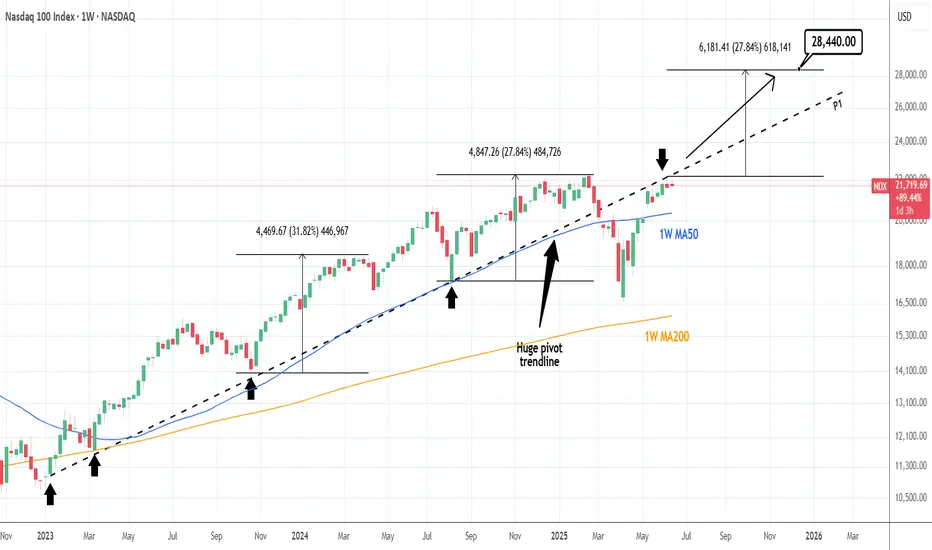
NASDAQ: Huge pivot can catapult it if broken.Nasdaq has turned neutral again on its 1D technical outlook (RSI = 54.712, MACD = 377..560, ADX = 20.644) as it has been struggling to cross above a hidden trendline, the Pivot P1 that was at the start of this Bull Cycle a support and after the trade war acts now as a resistance. If broken, we anticipate a +27.84% rise at least (TP = 28,440), which may very well be an end of year target.
## If you like our free content follow our profile to get more daily ideas. ##
## Comments and likes are greatly appreciated. ##


NASDAQ - UniverseMetta - Signal#NASDAQ - UniverseMetta - Signal
D1 - Formation of a narrowing diagonal + price broke through the lower trend line through a 3-wave structure. It is better not to increase risks. Stop behind the maximum of the 1st wave.
Entry: 21509.0
TP: 20986.3 - 20372.2 - 19784.5 - 18396.7
Stop: 22160.6

My View on NAS1001. Price has been trending up for a long time.
2. A possible Reversal Pattern spotted
3. Head and Shoulder Pattern
4. Almost all elements of the Pattern have appeared
5. Refer to the Chart for entry details
6. Apply proper risk management based on your account size.
"Direction is Better than Speed"
Aliyu Gital

NASDAQ 2 Expected Scenarios Very Clear , Which One You Prefer ?Here is my opinion on Nasdaq on 4H T.F , The price still below my res so we can sell it if the price touch the res level again , and if we have a daily closure above my res then we can buy it with retest for the broken res , so it`s very easy if we still below the res we can sell and if we going up it we can buy it . but we need a daily closure above first .

NASDAQ - Long now!⚡️ NAS100 15-Min Reversal Signal – Caught the Bottom?
The ELFIEDT – X-REVERSION indicator just printed a clean BUY signal on NAS100 after a strong sell-off into new session lows.
📉 Price had already extended far from structure
📈 RSI momentum began shifting and reversed sharply
✅ Volume spike and RSI reversal confluence added weight to the signal
📍 These types of signals are designed to catch mean reversion moves — especially powerful when price accelerates into extremes and the candle closes with absorption.
🎯 Remember: the signal is plotted on the close of the bar, meaning it doesn’t repaint and allows for real-time decision-making with a clear stop-loss just below the low.
💡 Watch for a potential retrace toward structure or session VWAP.


NASDAQ Analysis Stalking shorts on the Daily - nearby.
My weekly sentiment is bearish cause of technical factors.
Among the catalysts is bullish performance on the US Dollar index and price action compared to the US30 & US500.
Look to sell near 4H swing high, entry using the 15M bearish ChoCh only after three legs of bullish correction on the 1H frame into the highlighted levels of the swing high.
Anticipation is for the third leg to react bearish and the fourth leg to deliver impulse to the sell side.


NASDAQ 100 Under Pressure –Watching 21470 Break for ContinuationUSNAS100 – Technical Overview
USNAS100 has reached the support level we highlighted yesterday and continues to trade within a bearish trend, especially after confirming a 1H close below 21635.
Bearish Outlook:
As long as the price remains below 21635, the next target is 21470.
A break below 21470 would confirm further downside toward the support zone at 21375 and 21250.
Bullish Scenario:
Bullish momentum may return if the price breaks above 21635 on the 1H timeframe, targeting 21780 and potentially 21930 and 22090.
• Support: 21470 / 21375 / 21250
• Resistance: 21780 / 21930 / 22090


NASDAQStable bullish bias—large speculators are neither aggressively piling in nor stepping back.
Lack of a sharp position shift suggests the market is in consolidation or mild uptrend rather than a strong breakout.
Watch for fresh breakout above recent highs or shakeouts below support to confirm a shift in direction.
Bias: Slight bullish.

Nasdaq - This starts the next +50% rally!Nasdaq - TVC:NDQ - might break out soon:
(click chart above to see the in depth analysis👆🏻)
Despite the quite harsh correction of about -25% which we saw in the beginning of 2025, the Nasdaq is clearly heading for new all time highs. It sounds almost incredible but if the Nasdaq breaks above the current confluence of resistance, a breakout rally of +50% will follow thereafter.
Levels to watch: $21.500, $33.000
Keep your long term vision!
Philip (BasicTrading)

Hanzo / Nas100 30 Min ( Accurate Tactical Break Out Zones )🔥 Nas100 – 30 Min Scalping Analysis (Bearish Setup)
⚡️ Objective: Precision Breakout Execution
Time Frame: 30-Minute Warfare
Entry Mode: Only after verified breakout — no emotion, no gamble.
👌Bullish After Break : 21840
Price must break liquidity with high volume to confirm the move.
👌Bullish After Break : 21930
Price must break liquidity with high volume to confirm the move.
👌Bearish After Break : 21755
Price must break liquidity with high volume to confirm the move.
☄️ Hanzo Protocol: Dual-Direction Entry Intel
➕ Zone Activated: Strategic liquidity layer detected — mapped through refined supply/demand mechanics. Volatility now rising. This isn’t noise — this is bait for the untrained. We're not them.
🩸 Momentum Signature Detected:
Displacement candle confirms directional intent — AI pattern scan active.
— If upward: Bullish momentum burst.
— If downward: Aggressive bearish rejection.
🦸♂️ Tactical Note:
The kill shot only comes after the trap is exposed and volume betrays their position.
Hanzo / Nas100 30 Min ( Accurate Tactical Break Out Zones )
