Short idea nasdaq spotBased on -
- Correlation between eth and btc with equities shows potential short
- supply zone
- sector rotation (tech weak and small caps strong)
USTEC trade ideas
Nasdaq100 Triple bearish divergenceWe have a clear triple bearish divergence on the Nasdaq, and double bearish divergence on S&P500 which suggest downward movement sooner or later.
Disclaimer: This content is NOT a financial advise, it is for educational purpose only.

Nasdaq 100: Double Top or Double Bottom? (FRL Setup)Hello, dear traders! In my opinion the Nasdaq 100 is stuck between two opposite reversal structures.
• Globally: possible Double Top with neckline at 23513.
• Locally: potential Double Bottom with neckline at 23791.
According to Fractal Reversal Law (FRL), the neckline defines the real impulse.
• 🟢 Break above 23,791 → confirms Double Bottom → target 24113.
• 🔴 Break below 23,513 → confirms Double Top → target 23121.
What do you think about this? Will Nasdaq 100 confirm the local Double Bottom and push higher, or will the global Double Top take control?

Nasdak FULL BUYwe are going bullish soon be ready to take off , the nasdaq is fundamentally getting out from a potzntial crisis

How to determine if the Fed will change target interest rates?In this video, I explain the mechanism of the Fed target interest rates and how to determine if the Fed will cut the target interest rates in September 2025 (or any other FOMC). I also talk about the Overnight Reverse Repo balance sheet and the draining of the balance from a high of 2.55T on 30th Dec 2022 to just 25B as of 21st Aug 2025. I hypothesize a scenario from now till the September FOMC:
1. The Overnight Reverse Repo is completely emptied, meaning the stealth liquidity is gone.
2. The Equity Markets suffers a sharp fall (even a crash).
3. Funds rotate into US treasuries, causing yield to fall.
4. Fed cuts target interest rates without having to monetize the debts.
The most important key takeaway in this video is to understand that in order to know if the Fed will do anything is to see the 3month government bond yield. All the other information are supplementary and provide us information to paint a narrative on how the market will move in the coming weeks.
As aways, keep your risks tight, and Good Luck!

Lesson 17: NasDaq100 trade correction Explanation of trade correction. When trade's break a strong consolidation levels(4hr/daily) consolidations, it can days/weeks for price to correct towards point of break-out off consolidation.

NAS100 BUY OPPORTUNITYLooking to take longs on NAS100 from this level.
sweep of lows
imbalance mitigation
Trend continuation
R:R

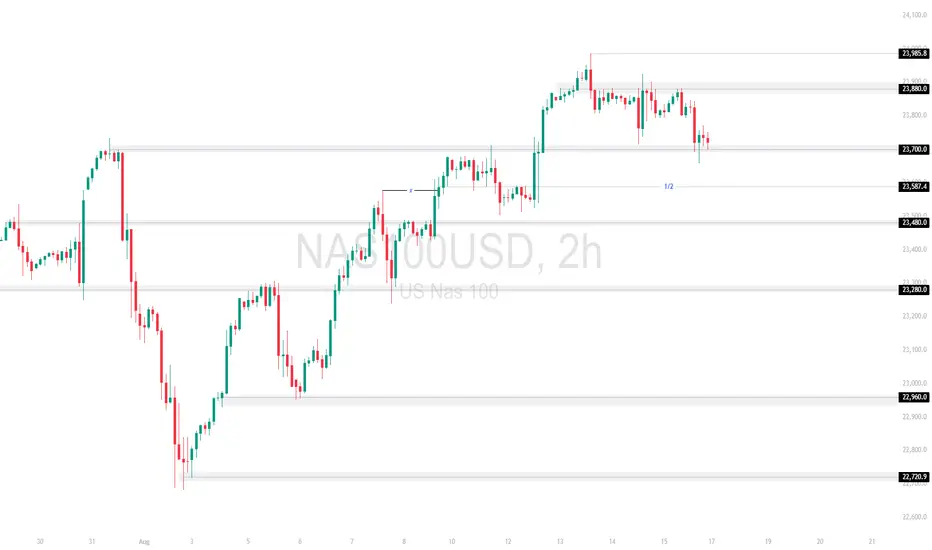
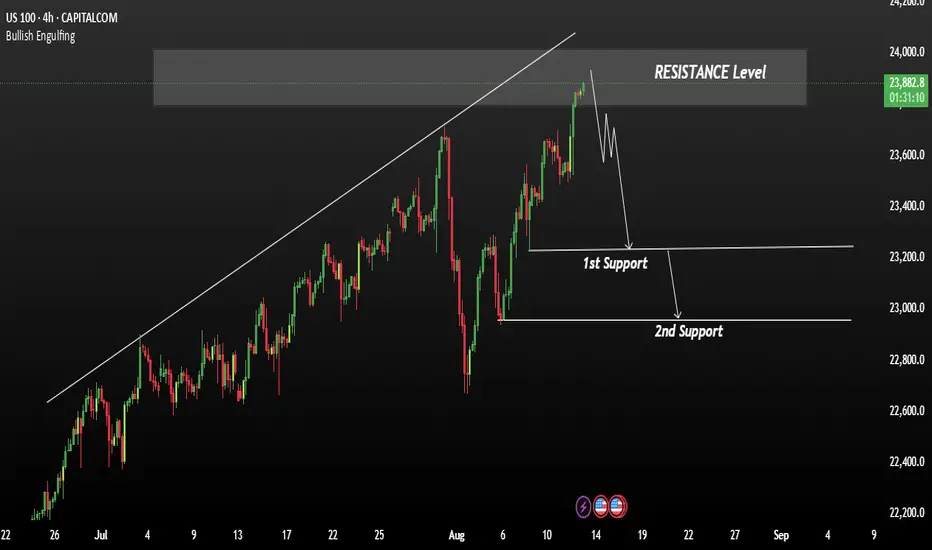
NAS100 – Key Support RetestPrice has pulled back from 23,985.8 resistance and is now testing the 23,700.0 zone. A solid hold here could fuel another leg higher, but a break lower may expose 23,587.4 and 23,480.0.
Support at: 23,700.0 🔽 | 23,587.4 🔽 | 23,480.0 🔽 | 23,280.0 🔽 | 22,960.0 🔽
Resistance at: 23,880.0 🔼 | 23,985.8 🔼
🔎 Bias:
🔼 Bullish: Holding 23,700.0 could lead to a retest of 23,880.0 and 23,985.8.
🔽 Bearish: A break below 23,700.0 shifts focus to 23,587.4 and 23,480.0.
📛 Disclaimer: This is not financial advice. Trade at your own risk.
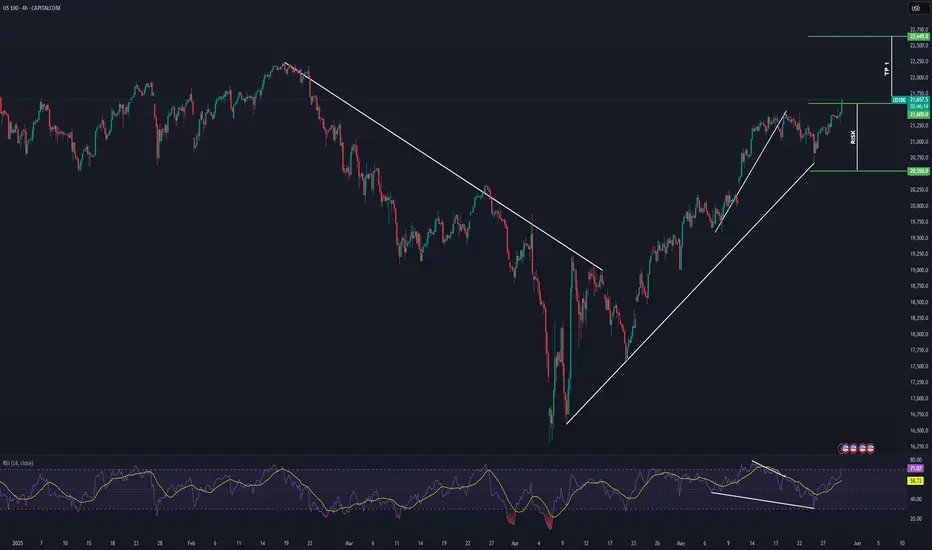
NASDAQ Potential Bullish ContinuationNASDAQ price action seems to exhibit signs of potential Bullish momentum as the price action may form a credible Higher High (after tarriff delays on the EU) with multiple confluences through key Fibonacci and Support levels which presents us with a potential long opportunity.
Trade Plan:
Entry : 21600
Stop Loss : 20550
TP 1: 22649
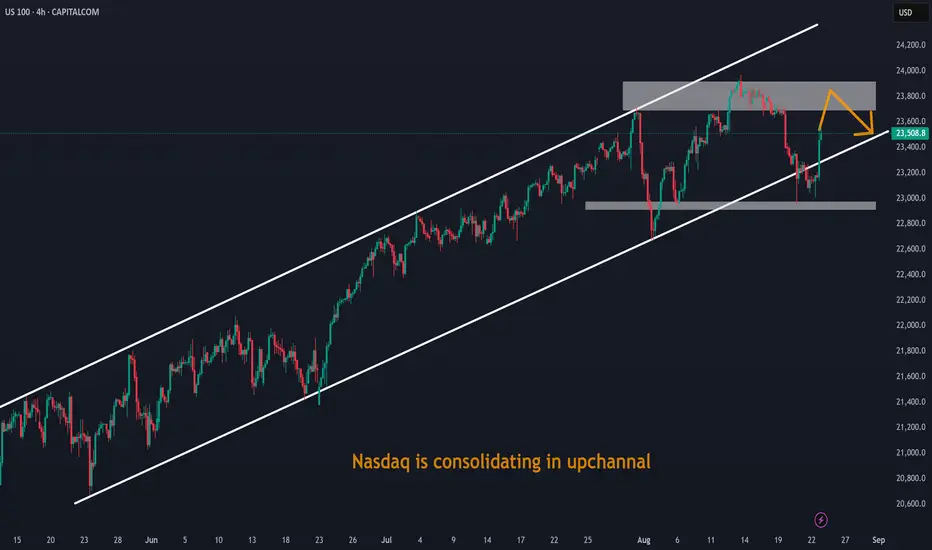
Nasdaq is consolidating in upchannalNasdaq is consolidating in upchannal. Furthur course of price action will be decided by dollar strenth.
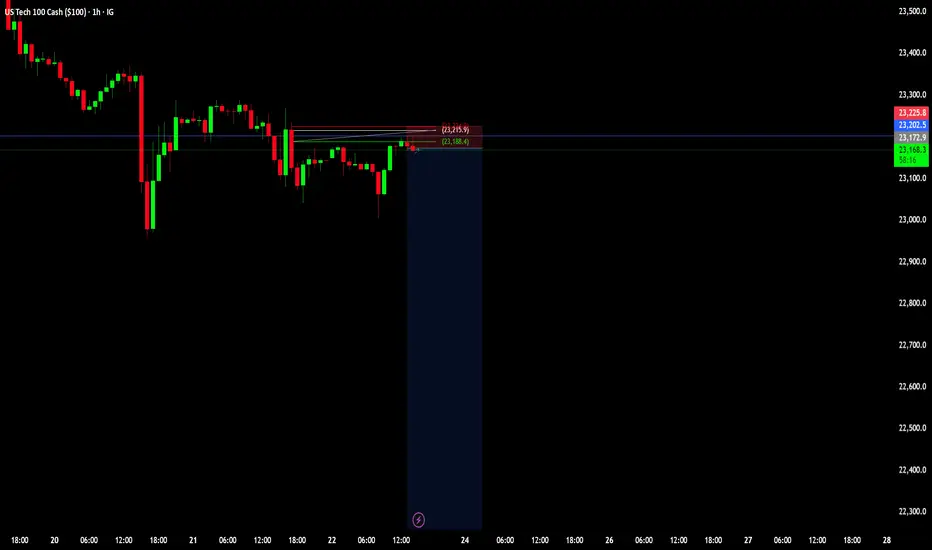
Profit-taking hits NASDAQ100: Uptrend still intact? The NASDAQ100 extended its losing streak as investors keep taking profits in tech stocks
Advanced Micro Devices and Broadcom each lost around 1%. Intel slid over 7%. Apple , Amazon , Alphabet , and Tesla also posted losses. Market volume typically falls in late August, which can lead to wilder swings.
The index has now broken below 23,600 and is trading near 23,300, marking its steepest pullback since late June. The short-term trend that began in mid-July is still possibly intact, with higher highs and higher lows. However, volume on down days suggests sellers are active, which may reinforce near-term downside pressure.


IS IT THE DIP?The nasdaq has pulled back a few %. I am going to open a long position here.
This is not a day trading decision. I will DCA if needed

ARIASWAVE MARKET UPDATE - NASDAQ 400K - DOW 200K...In this major market update, I’m sharing fresh analysis that signals the beginning of a powerful new uptrend.
Years of excessive money printing have fueled what appears to be a massive incoming bull market—one that could surpass all previous trends in strength, thanks to the extraordinary liquidity injected into global markets.
We may be entering a modern-day “Roaring 20s 2.0,” but eventually, this cycle will run its course.
For now, the key is to capitalize on the opportunities ahead by making well-informed decisions.

Nasdaq trading in upchannalNasdaq trading in upchannal. Trum -Putin meeting yesterday in Alaska looks like productive positive for markets.

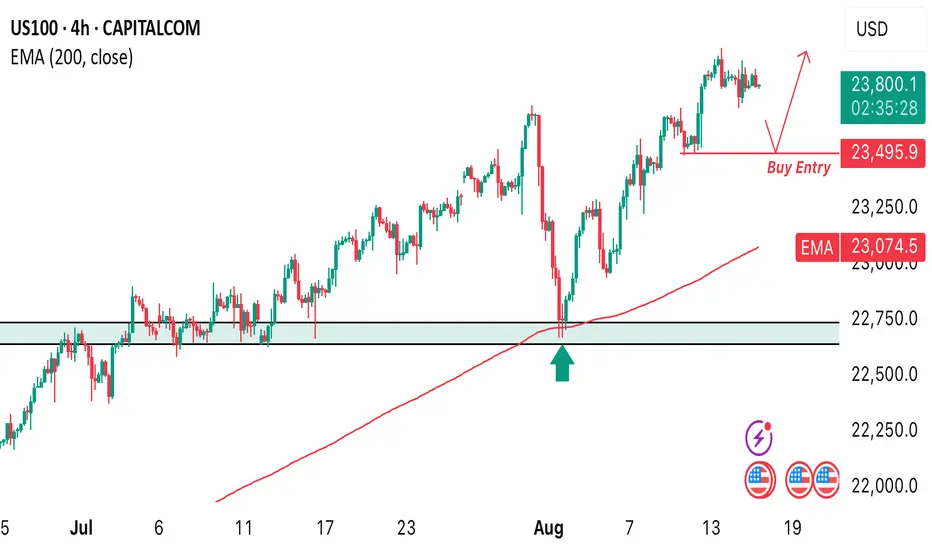
US100 HIGH TENDENCY TO CONTINUE BULLISH-Chart TalksUS100 Breaks its previous all time highs to make a new high recently after finding a new support around the 22642.07 from the technical standpoint, we’re expecting a little Pullback in price to 23495 so we can go long on this pair. Our take profit level is at 24,000.
Don’t miss out on this opportunity
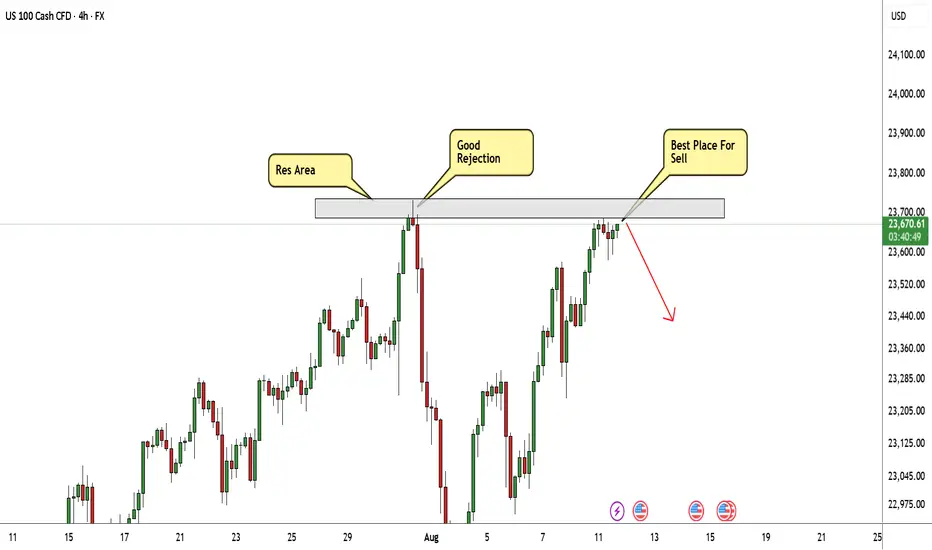
NASDAQ At Good Res , Is It A Chance To Sell To Get 200 Pips ?Here is my 4H Nasdaq Chart and my opinion is the price at very interesting selling area for me , and we have a very clear bearish price action and this Res Area forced the prices to go down Very hard and i think this Second Touch will be the best one , so i`m waiting selling this pair now and targeting from 100 to 200 pips . the only reason to cancel this idea if we have a clear daily closure above my res area .
Entry Reasons :
1- Clear Res Area .
2- Second Touch For The Res .
3- Bearish Price Action .
NAS100 - Potentiatl TargetsDear Friends in Trading,
How I see it,
Stocks are roaring with the cooling inflation report.
September "IR CUT" certainty driving markets at this time.
I sincerely hope my point of view offers a valued insight
Thank you for taking the time study my analysis.

NASDAQ H1 BUYING CHANNEL Buy Nasdaq Channel ?
Buy Gold At Nasdaq FVG
Buying Structre #NASDAQ
Buy At FVG

US100 A Waiting Reject from resistanceThe market is currently watching for a rejection from the top resistance zone. Sentiment improved after the US and China extended their tariff truce until November 10, avoiding triple-digit duties on each other’s goods.
2.8% or higher reading likely supports a bearish move toward 23,250 and then 23,950mBelow 2.8% reading → could fuel bullish momentum toward a new ATH at 23,900.
You may find more details in the chart.
Trade wisely best of Luck Buddies.
Ps; Support wit like and comments for better analysis Thanks.
Dip-buying on the Nasdaq?The Stock market rallied following the July US CPI inflation data, with the Nasdaq 100 climbing to an all-time high of 23,849. Overlooking the economic picture for now, price action has exhibited a clear uptrend since early April this year. This is evident from the price, which has chalked up a series of higher highs and higher lows, trading above the 200-day simple moving average at 21,100, and with the dynamic value pointing higher.
Traders seldom attempt to buy at record highs; they tend to buy into retracements from support levels. Therefore, support levels of note right now include 23,347 (1W), 22,990 (1W), and 22,592 (1M).
Written by the FP Markets Research Team

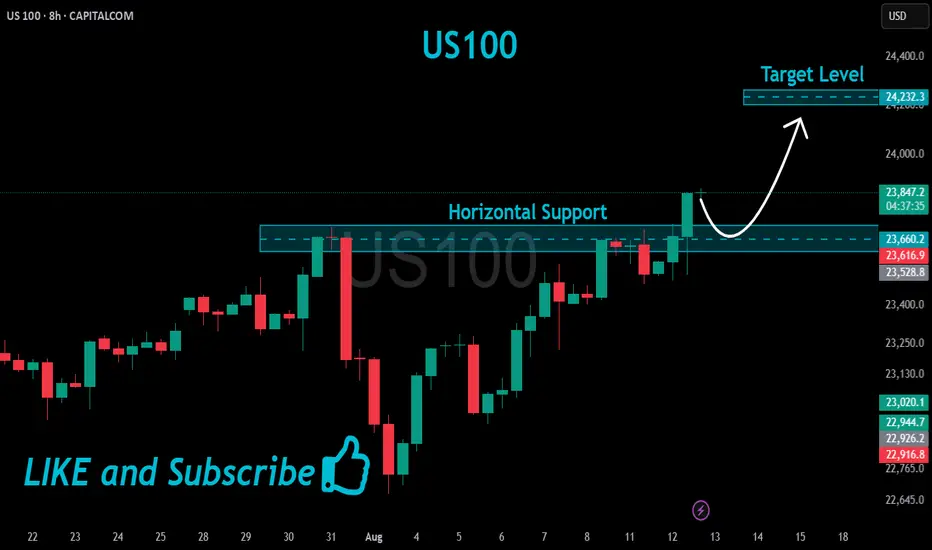
US100 Bullish Breakout!
HI,Traders !
#US100 is trading in a strong
Uptrend and the price made a
Bullish breakout of the key
Horizontal level of 23660.2
So we are bullish biased
And we will be expecting a
Further bullish move up !
Comment and subscribe to help us grow !
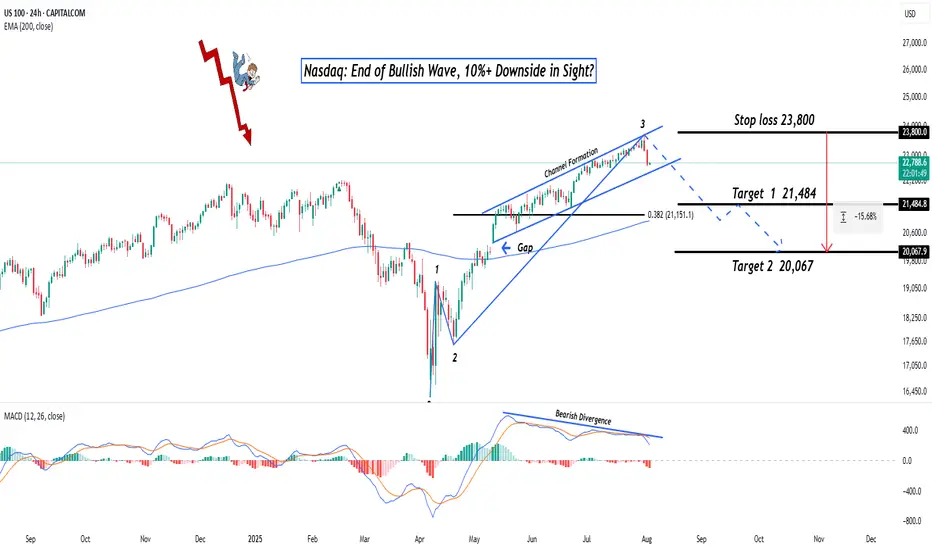
Nasdaq: End of Bullish Wave, 10%+ Downside in Sight?Hey Realistic Traders!
Has CAPITALCOM:US100 (Nasdaq) Finally Peaked? A Reversal Signal Just Flashed. Is This the Turning Point Toward a Deeper Pullback?
Let’s dive into the technicals to see what the chart is really telling us.
Technical Analysis
On the daily chart, the Nasdaq is starting to show signs of weakness. A bearish divergence has formed between the MACD and price movement , which is a classic signal that bullish momentum may be fading. This often indicates the potential for a trend reversal or a deeper correction.
A recent drop, confirmed by a strong bearish full-body candlestick, suggests that selling pressure is increasing. If this continues, we expect a breakdown from the current bullish channel.
In this scenario, the extended Wave 3 may have reached its peak. A correction could follow, with the first target at 21484, which lines up with the 0.382 Fibonacci retracement level. If the decline continues, the next downside target would be around 20067, where a previous gap may be filled.
This bearish outlook remains valid as long as the price stays below 23800 . A move above that level would invalidate the setup and return the outlook to neutral.
Support the channel by engaging with the content, using the rocket button, and sharing your opinions in the comments below.
Disclaimer: "Please note that this analysis is solely for educational purposes and should not be considered a recommendation to take a long or short position on Nasdaq.