USTEC trade ideas

NASDAQ | Bearish ContinuetionNASDAQ has not yet broken its descending parallel channel as well as it has not broken its lower high.Moreover there is no divergence on RSI which indicates the continuetion pattern.

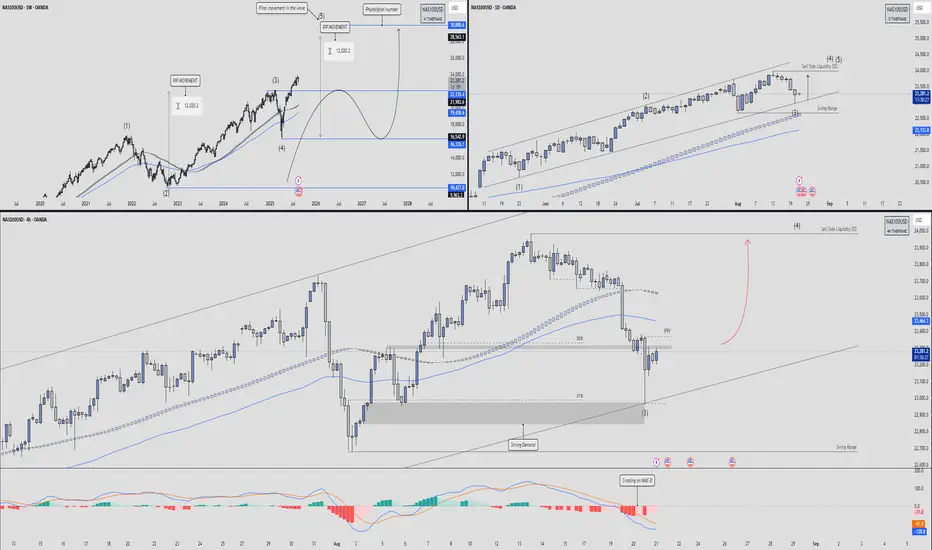
NAS100USD - Overview with Trade Idea🕰 Weekly View (Big Picture)
The Elliott Wave structure is playing out cleanly:
Wave (1) topped → Wave (2) corrective pullback.
Wave (3) extended strongly, now we’re inside Wave (5).
Price is showing final movement within the wave cycle, meaning the index is likely topping out.
A measured move of ~12,000 pips matches the symmetry between Waves (1–3) and (3–5).
Key downside retracement zones:
21,133 – 19,736 → first major support block.
16,352 – 16,351 → deeper retracement zone if momentum collapses.
Ultimate liquidity magnet sits around 10,427, but that’s long-term.
📉 Daily Structure
Market traded inside a rising channel, with the last leg forming Wave (5).
Current price action is rejecting sell-side liquidity, hinting at weakness.
Breakdown of the swing range → momentum shift underway.
Strong support rests near 22,133, aligning with the 200 EMA cluster.
Loss of that level = higher probability of completing Wave (4) retracement.
⏱ 4H Breakdown
The 4H chart shows the short-term battle:
Price wicked into the 71% retracement and tapped strong demand.
Currently consolidating inside a corrective bounce zone.
The 50% retracement and IPH level (~23,450) act as immediate resistance.
Expectation:
If supply holds, we rotate lower to re-test demand at 23,000 – 22,800.
If buyers defend, a relief push into 23,600 – 23,800 is possible before selling resumes.
🎯 Trade Plan
Bias: Short-to-mid term bearish (retracement phase of Wave (5)).
Entry Zone: Look for rejection around 23,450 – 23,600.
Target Zones:
First take profit → 23,000 – 22,800 demand.
Secondary target → 22,133 swing level.
Invalidation: A clean break and hold above 23,800 – 24,000 would re-open bullish continuation.
Risk Management: Trade within the channel structure, size down due to volatility.
NAS100 ATH or what? optimism coming back or no? Chyna CHyna CHyNAS100 ATH or what?
optimism coming back or no? Chyna CHyna CHyna? or no CHyna? let us know~~
we caught april bottom now run ATH?
🐉We value full transparency. All wins and fails fully publicized, zero edit, zero delete, zero fakes.🐉
🐉Check out our socials for some nice insights.🐉
information created and published doesn't constitute investment advice!
NOT financial advice

NAS100 BUY TECHNICAL ANALYSIS.nas100 buy technical analysis. price came down and touched support levels and now broke through this bear trend line. now the bear trend line will act as support all the way to resistance levels. gte vip breakout strategy!

Nasdaq BSL SweepExpecting for BSL to be sweep... before the Sell continuation.
Waiting for #PPP entry model

Market Sentiment Pulls Nasdaq to the 23,200 SupportOn the daily chart, Nasdaq’s RSI has pulled back to the 50 neutral zone, providing potential support for the recent correction. Price action is holding above the 23,200-support, while the 4-hour RSI is rebounding from oversold conditions.
If 23,200 continues to hold, Nasdaq may recover to test 23,500, 23,700, and potentially 24,100. A confirmed move above these levels could signal renewed momentum toward the 25,000-record.
A clean hold below 23-200 may extend the decline towards key support levels between 22,900-22,700 for another long-term bullish positioning opportunity, or deeper downturn risks.
Key Events in Sight:
- FOMC Minutes (Today)
- Fed Speech (Friday)
- Written by Razan Hilal, CMT
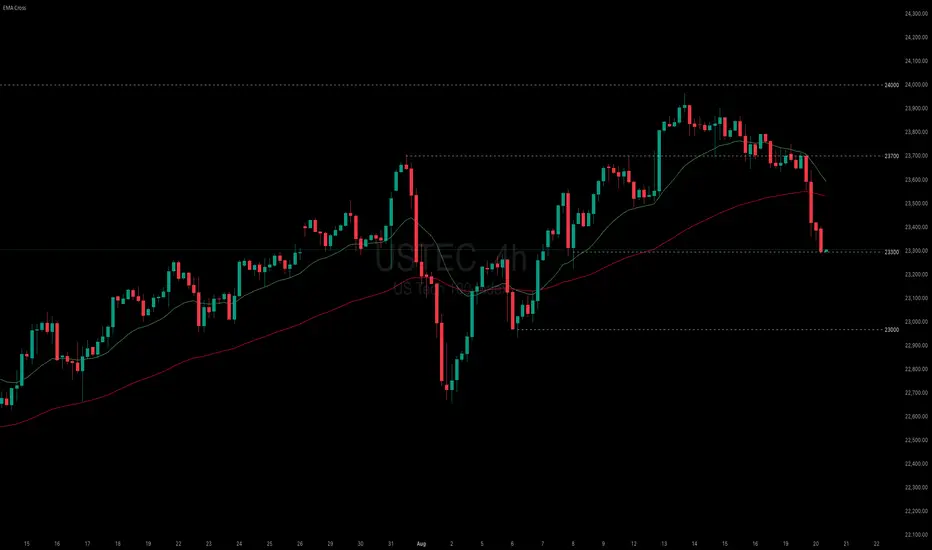
Could elevated valuations start weighing heavily on USTEC?
US equities fell sharply under pressure from stretched AI valuations. OpenAI CEO Altman cautioned that investors are overly excited about AI, warning that valuations have become “out of control.” Adding to the drag, Nvidia shares tumbled as China mandated domestic AI chips account for over 50% of local data center usage, raising concerns over export reliance. Markets now turn their focus to Fed Governor Waller’s speech and the FOMC minutes for clues on the rate-cut outlook.
USTEC is sliding lower, approaching the support at 23300. The narrowing gap between EMA21 and EMA78 points to a possible shift toward bearish momentum. If USTEC breaks below 23300, the index could decline further toward the next support at 23000. Conversely, if USTEC climbs back above both EMAs, the index may gain upside traction toward the resistance at 23700.
NAS100 always following the channels NAS100 now broken out into a new channel
Follow it to make some easy day trades!

Concern for the NASDAQIn no way certain of a large pullback on the NASDAQ NASDAQ:NDX , but I’m hedging for it. With YQQQ $YQQQ.

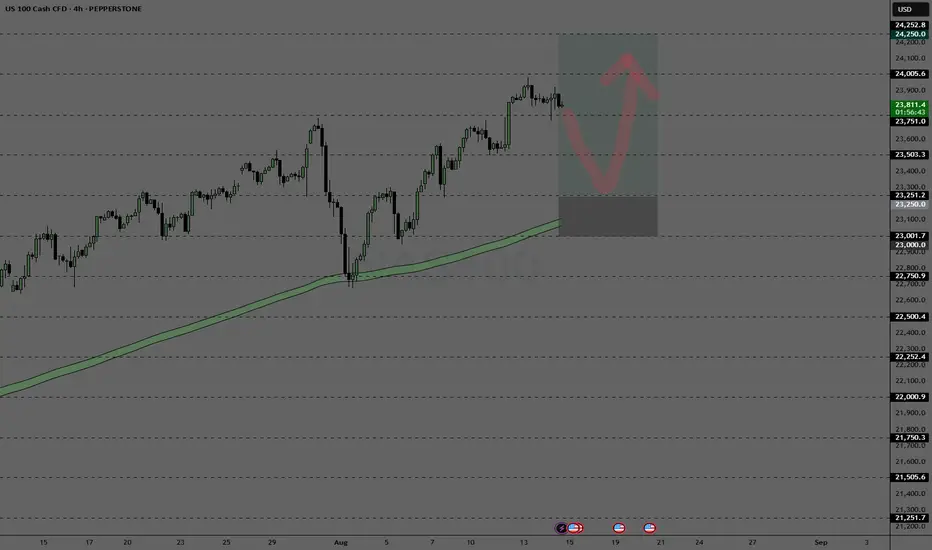
US100: Bullish Continuation & Long Trade
US100
- Classic bullish setup
- Our team expects bullish continuation
SUGGESTED TRADE:
Swing Trade
Long US100
Entry Point - 23703
Stop Loss - 23669
Take Profit - 23777
Our Risk - 1%
Start protection of your profits from lower levels
Disclosure: I am part of Trade Nation's Influencer program and receive a monthly fee for using their TradingView charts in my analysis.
❤️ Please, support our work with like & comment! ❤️

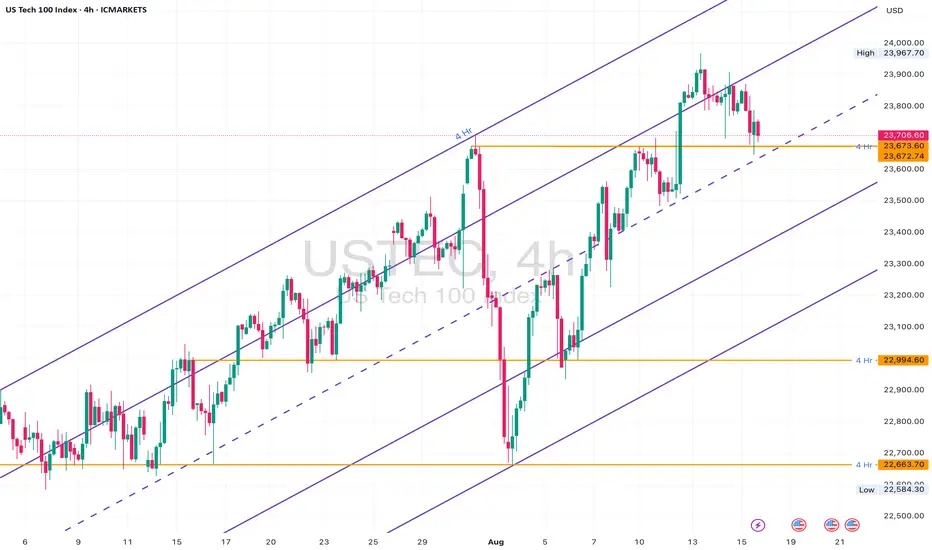
NAS100 4H Channel: Bounce or Breakdown?NASDAQ100 has been trending within a clean ascending channel on the 4H timeframe. We’re now sitting at a crucial decision point — the midline and horizontal support around 23,670.
This zone has historically acted as a strong S/R pivot. If price holds, we could see another bullish bounce toward 24,000+. But if it breaks and closes below, we may get a clean drop toward the bottom of the channel — with 23,200 and 22,663 as targets.
Plan:
• Wait for a 4H close above or below the 23,670 level
• Bullish scenario: Bounce toward upper channel (~24,300)
• Bearish scenario: Drop to lower channel boundary with incremental TP levels
Structure:
• 4H rising channel structure still intact
• Price testing midline zone
• Horizontal level at ~23,670 adds confluence
• No confirmed break of channel yet
Key Zones:
• Support: 23,670 (midline + structure support)
• Bullish flip zone: 23,967
• Bearish continuation zones:
‣ 23,200
‣ 22,994
‣ 22,663
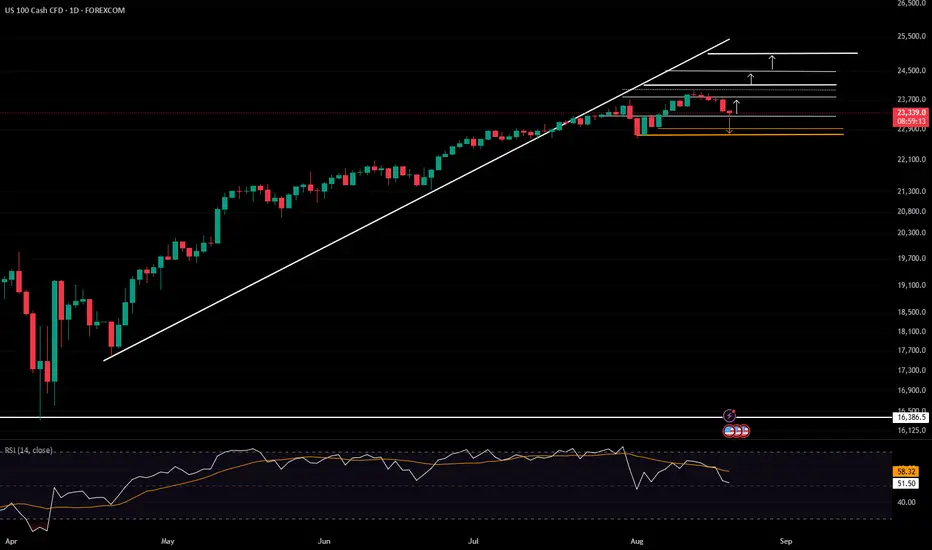
Nas100 sell opportunity Nas100 technical analysis. Nas100 price recently reached an all time high. Price is at resistance levels and has also broke through upward trend line which is strong indicator that price will continue down to main support levels over the next week.

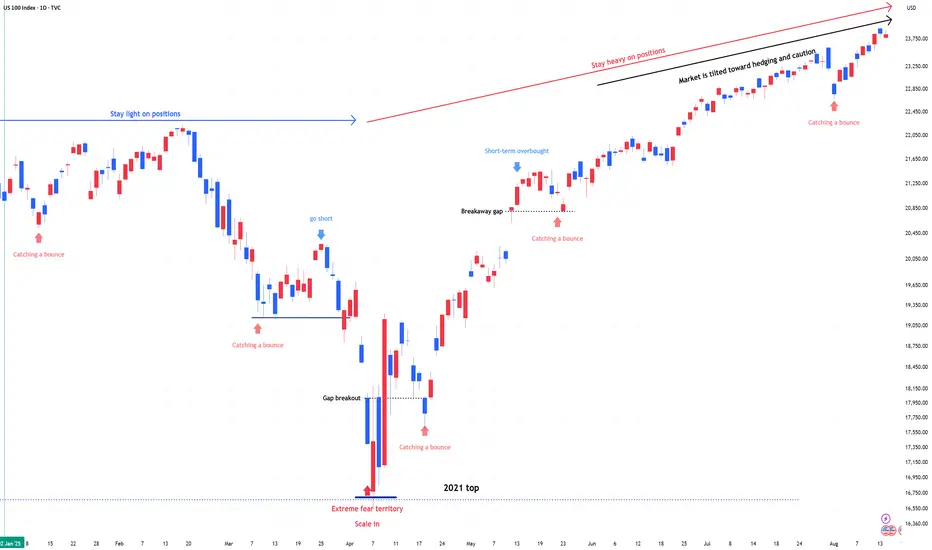
NDX & SPX , Stay heavy on positionsNDX & SPX , Stay heavy on positions. (QLD, TQQQ)
While the market continues to break all-time highs, market participants remain cautious.
Some are even anticipating a pullback in September, and overall, expectations for a correction are widely present.
Interestingly, market participants often have a good instinct for major turning points.
The issue, however, is timing—they tend to act too early.
** This analysis is based solely on the quantification of crowd psychology.
It does not incorporate price action, trading volume, or macroeconomic indicators.
NAS100 Looking for a retrace and into a key levelLooking for a potential buy position and holding.
This is my markup and potential buy position.
I am not a financial advisor.
Up Up Up... Nothing Can Stop NAS From RisingLet's take a look at the big picture in the NASDAQ: Do you see how nicely the spring crash landed on the 50% retracement of the upward movement since fall 2022?
Now that we've crossed the old ATH, the targets are clear, and they're way up in the NASDAQ.
The summer correction is therefore likely to fail and probably turn into a listless sideways slide. By September at the latest, however, the NAS should pick up speed again and head for targets between 25,000 and 26,000 - at the very least.
Clear skies!

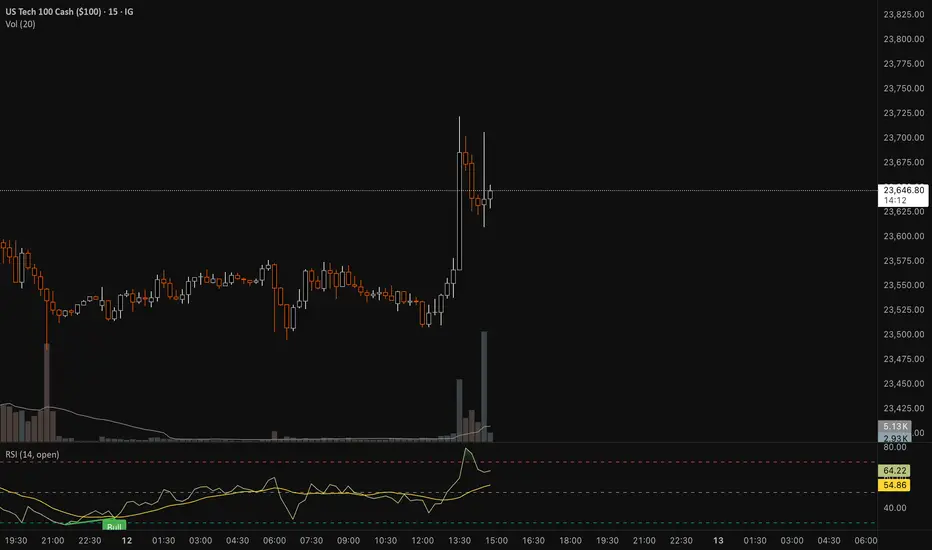
NAS100 – Potential Short Setup After Sharp RallyOn the 5-minute chart, NAS100 has made a strong upward move following a sharp drop earlier in the session.
Price is now approaching a potential exhaustion point near 23,940–23,960. I expect a reversal from this zone, followed by a move back toward 23,725 and possibly lower.
Trade Plan:
Sell Entry: 23,940–23,960 zone after confirmation
Stop-Loss: Above 23,960
Take-Profit: 23,725 initial target; further downside possible if momentum continues
Notes:
Watch for reversal candlestick patterns or break of short-term structure before entering.
This setup is based on intraday momentum and may require fast execution.

Nasdaq to 23,050RECENT TRENDLINE, as you can see, is broken. Next stop is 23,050 to the recent major support, because economy cracks under Trump administration...good luck

US100 Trade Idea – Risking 1% for Potential 5% Gain 13/8/2025
I trade with a fixed 1:5 risk–reward ratio, focusing on setups that offer asymmetric profit potential. My approach emphasizes precise entries, strict risk management, and the patience to let trades reach their full potential.
This method allows me to risk small while aiming for meaningful gains, keeping my results consistent and sustainable over time. Trading, for me, is as much about mindset as it is about method — staying calm, following the plan, and letting probabilities work in my favor.
Disclaimer: This is purely an idea shared for educational purposes. I take no responsibility for any financial decisions you make. Please assess it carefully and adapt it to your own trading plan before acting.


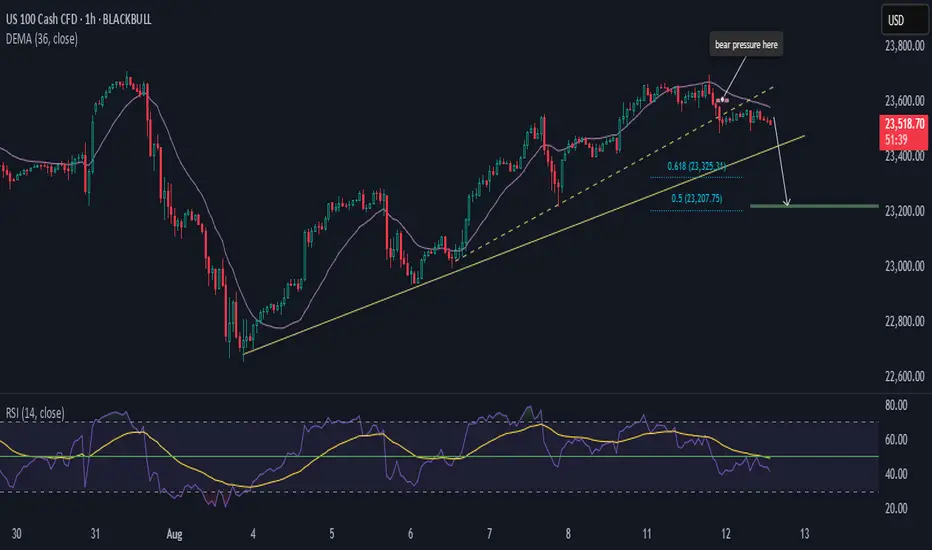
NAS100 Building Up On Bearish PressureHi there,
NAS100 has been very surprising for us recently, with increased bullishness that appears to be giving a bearish bias.
🦉 We'll use RSI and DEMA to coordinate price movements.
🎙️The price is bearish from the 23,600 area and has broken a minor dashed trendline. As long as the price remains below the purple 36 DEMA, below the RSI 50 level, and below the yellow RSI EMA, we remain bearish toward the solid trendline. This outlook points to two target support areas: 23,325 and 23,207.
🧩 Note: the bearish momentum is driven by the 3-hour chart. If it changes there, the setup will be invalidated.
Happy Trading,
K.
Rate-cut optimism fueled risk-on mood, lifting US equities
July CPI showed little inflationary impact from tariffs, amplifying expectations for a September Fed cut. Optimism also returned for small-cap firms, previously seen as most vulnerable to tariff pressures. Headline CPI rose 2.7% YoY in July, 0.1% lower than a year earlier, with a 1.1% MoM drop in energy prices contributing to the overall decline.
BlackRock CIO Rick Rieder noted that shelter costs, the largest CPI component, slowed to their lowest since 2021, significantly boosting the odds of a September cut. He added that the Fed could take a more aggressive approach, with a 50bp cut at the September FOMC.
USTEC extended its sharp uptrend after breaching above the 23700 high. The widening gap between both EMAs indicates the potential continuation of bullish momentum. If USTEC holds above 23700, the index may gain upward momentum toward the psychological resistance at 24000. Conversely, if USTEC breaks below 23700, the index could retreat toward 23300.