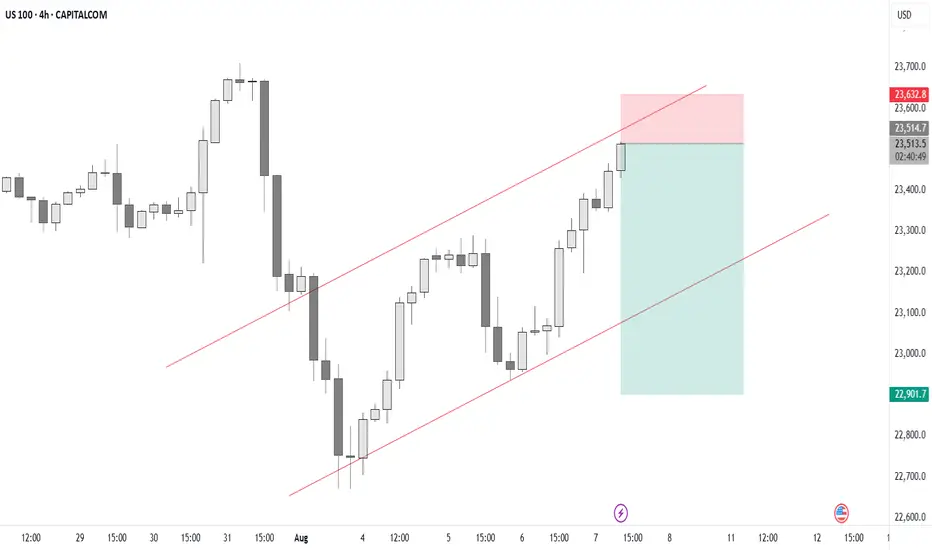
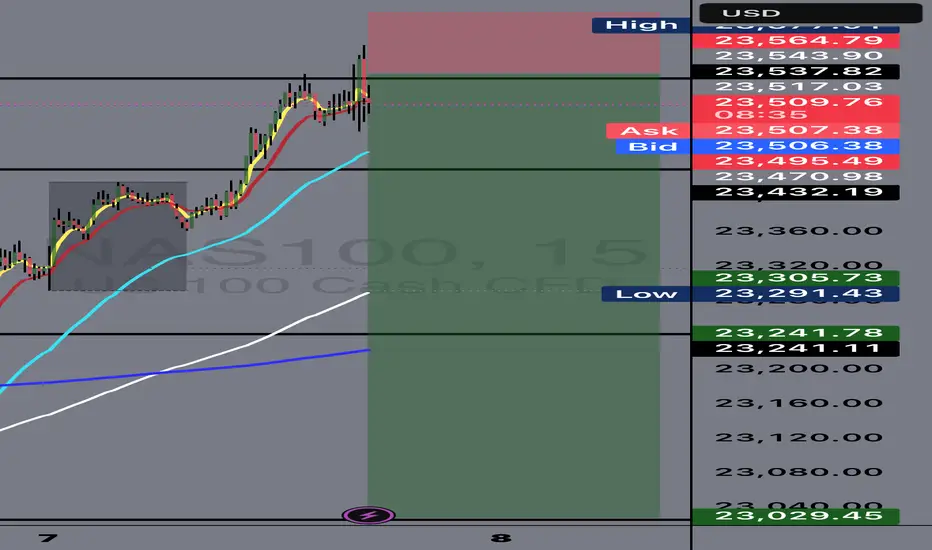
USNAS100 Volatile – Key Level at 23440 in FocusUSNAS100 – Market Overview
The indices market remains highly volatile following the latest developments regarding the Federal Reserve Chairman.
The situation remains tense, with the possibility of one rate cut this year still on the table.
Technical Outlook
Bullish Scenario:
Stability above 23440 will keep bullish momentum intact, targeting the All-Time High (ATH) at 23690, with further potential toward 23870.
Bearish Scenario:
A 1H close below 23430 would shift the bias to bearish, targeting 23295, and possibly lower.
Resistance: 23570 – 23690 – 23870
Support: 23295 – 23180 – 23045
USTEC trade ideas

Trading update on NASDAQ 100
MEGA Cycle ended?
Greetings, traders!
The markets are at a critical juncture, and it's essential to prepare for what could be a significant correction in the NASDAQ 100 and, by extension, the broader stock market. Here's my analysis and outlook based on current price action, key levels, and technical indicators.
Potential for a 21% Decline in the NASDAQ 100
As I highlighted in the attached daily and weekly charts:
Elliott Wave Analysis:
The NASDAQ has completed its five-wave impulsive structure, signaling the potential end of a major bullish cycle. We are now in the midst of a corrective phase, which appears to be unfolding in the form of an ABC correction. This correction suggests that Wave C, the final leg down, is still in progress, with room for further downside.
Break of Structure (BOS):
A Break of Structure has occurred, confirming the bearish sentiment. Coupled with the presence of an unfilled gap overhead, it's clear that sellers are currently in control.
Key Fibonacci Levels:
The 0.618 Fibonacci retracement at 16,210 is a critical level to watch. A break below this support could open the door for a more extended drop to the 0.75 retracement at 13,200, representing a 21% decline from current levels.
Trendline at Risk:
The ascending trendline that has supported the NASDAQ since its 2022 lows is being tested. If this trendline breaks, it will likely trigger a cascade of selling pressure, accelerating the move to our projected downside targets.
Broader Market Implications
The NASDAQ often serves as a barometer for risk appetite in the financial markets. A sharp decline here could have ripple effects across other indices and sectors, particularly tech-heavy and growth-focused stocks. Watch for potential spillovers into the S&P 500 and Dow Jones Industrial Average, which could amplify market-wide volatility.
Key Levels to Watch
Resistance:
Gap area near 21,600–21,800.
This zone is likely to act as a supply area if the market attempts any retracement.
Support:
16,210 (0.618 retracement) – Initial target and a potential temporary bounce zone.
13,200 (0.75 retracement) – Ultimate target if bearish momentum persists.
Trading Strategy
For traders looking to capitalize on this potential move:
Short Positions:
Consider shorting retracements into resistance zones like the gap area or the 0.25 Fibonacci level.
Use 16,210 as a primary profit target, with a portion of the trade left to run toward 13,200 if bearish momentum accelerates.
Risk Management:
The markets remain volatile, so ensure you have clear stop-losses in place to protect against unexpected reversals.
Watch for Confirmations:
Monitor volume spikes, candlestick patterns (e.g., bearish engulfing), and breaks of key levels like the ascending trendline for additional entry confirmations.
Final Thoughts
The NASDAQ and broader markets are entering a critical phase. While the correction presents risks, it also provides opportunities for traders and investors who stay vigilant and disciplined.
Remember, patience and preparation are key to navigating volatile markets like these.
Stay sharp, stay informed, and trade smart.
Lord MEDZ

NASDAQ Index (US100 / NASDAQ) Analysis:The NASDAQ index has shown strong bullish momentum recently and is currently trading near a key resistance level at $23,500.
🔻 Bearish Scenario:
If the price fails to break above $23,500 and selling pressure emerges, we could see a downward correction toward $23,310. A break below this level could extend the decline toward $23,000.
🔺 Bullish Scenario:
If the price successfully breaks and holds above $23,500, it could support further upside toward $23,600 as the first target. With continued bullish momentum, the price might reach $23,750.
⚠️ Disclaimer:
This analysis is not financial advice. It is recommended to monitor the markets and carefully analyze the data before making any investment decisions.


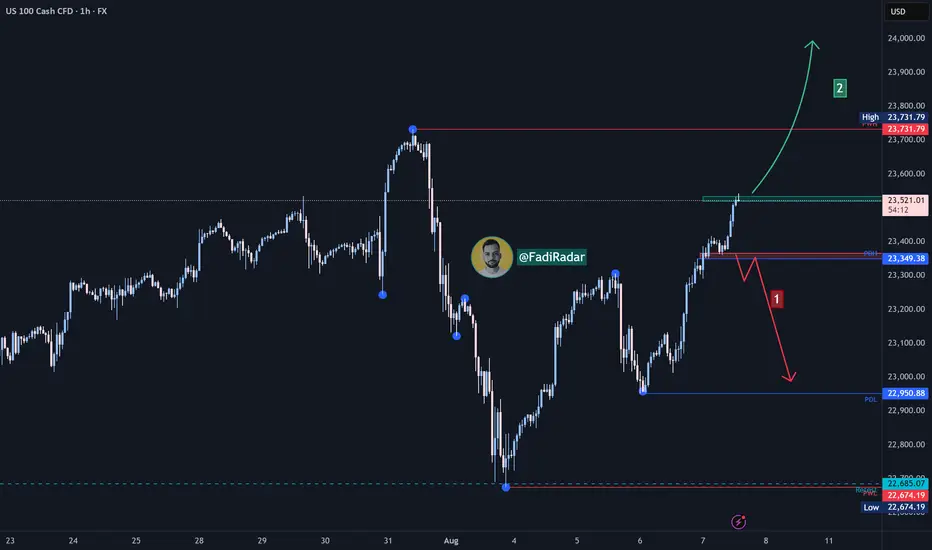
NAS100 H4 | Bullish bounce offUS100 (NAS100) has bounced off the buy entry which is a pullback support that is slightly above the 38.2% Fibonacci retracement and could rise to the take profit.
Buy entry is at 23,276.48, which is a pullback support that is slightly above the 38.2% Fibonacci retracement.
Stop loss is at 23,029.35, which is an overlap support that aligns with he 61.8% Fibonacci retracement.
Take profit is at 23,736.91, which is a swing high resistance.
High Risk Investment Warning
Trading Forex/CFDs on margin carries a high level of risk and may not be suitable for all investors. Leverage can work against you.
Stratos Markets Limited (tradu.com ):
CFDs are complex instruments and come with a high risk of losing money rapidly due to leverage. 65% of retail investor accounts lose money when trading CFDs with this provider. You should consider whether you understand how CFDs work and whether you can afford to take the high risk of losing your money.
Stratos Europe Ltd (tradu.com ):
CFDs are complex instruments and come with a high risk of losing money rapidly due to leverage. 66% of retail investor accounts lose money when trading CFDs with this provider. You should consider whether you understand how CFDs work and whether you can afford to take the high risk of losing your money.
Stratos Global LLC (tradu.com ):
Losses can exceed deposits.
Please be advised that the information presented on TradingView is provided to Tradu (‘Company’, ‘we’) by a third-party provider (‘TFA Global Pte Ltd’). Please be reminded that you are solely responsible for the trading decisions on your account. There is a very high degree of risk involved in trading. Any information and/or content is intended entirely for research, educational and informational purposes only and does not constitute investment or consultation advice or investment strategy. The information is not tailored to the investment needs of any specific person and therefore does not involve a consideration of any of the investment objectives, financial situation or needs of any viewer that may receive it. Kindly also note that past performance is not a reliable indicator of future results. Actual results may differ materially from those anticipated in forward-looking or past performance statements. We assume no liability as to the accuracy or completeness of any of the information and/or content provided herein and the Company cannot be held responsible for any omission, mistake nor for any loss or damage including without limitation to any loss of profit which may arise from reliance on any information supplied by TFA Global Pte Ltd.
The speaker(s) is neither an employee, agent nor representative of Tradu and is therefore acting independently. The opinions given are their own, constitute general market commentary, and do not constitute the opinion or advice of Tradu or any form of personal or investment advice. Tradu neither endorses nor guarantees offerings of third-party speakers, nor is Tradu responsible for the content, veracity or opinions of third-party speakers, presenters or participants.

BUY USTEC 8.8.2025Confluence order: BUY at M15
Type of order: Limit order
Reason:
- The current top is not touching anything, expected to rise to the MAINKEY of H1~M15 above.
- M15~FIBO 0,5-0,618 (same position)
Note:
- Management of money carefully at the last bottom (23,459)
Set up entry:
- Entry buy at 23,438
- SL at 23,423
- TP1: 23,459 (~1R)
- TP2: 23,481 (~2R)
- TP3: 23,540 (~6R)
Trading Method: Price action (No indicator, only trend and candles)

USNAS100Preferably suitable for scalping and accurate as long as you watch carefully the price action with the drawn areas.
With your likes and comments, you give me enough energy to provide the best analysis on an ongoing basis.
And if you needed any analysis that was not on the page, you can ask me with a comment or a personal message.
Enjoy Trading ;)


Nasdaq bull flag forming with a sweet entry.I think we've got a bull flag forming on the hourly on the NASDAQ. I think we need to take out this wick. And I think we come down and take out these stops just above where the red box is. And I think that's a pretty sweet entry before we go to new all-time highs. Um, let's see what happens. Hope you guys can follow.

NAS100 - LONGPrice pushed down a lot lower than I thought it would but sentiment still remains the same. Waiting for bullish confirmation for price to reach today's highs.

NAS100 - LONGstrong sell of this morning. Waiting for buyers to reenter the market and push price back to todays highs.


NQ long thursdays reversalmultiple SSMTs on the weekly and daily cycles
Expecting to do a 1-1 of the current range

A slight push to the upside - inboundWe're going to see a slight push to the upside, before NASley will do a proper drop for us to a position that has been support for a long time.
I'm of the opinion that she'll break that support, re-test it and then drop even further - motivated by the current political instability within the US and world in general.
Watch this move - It's going to be one for the books!

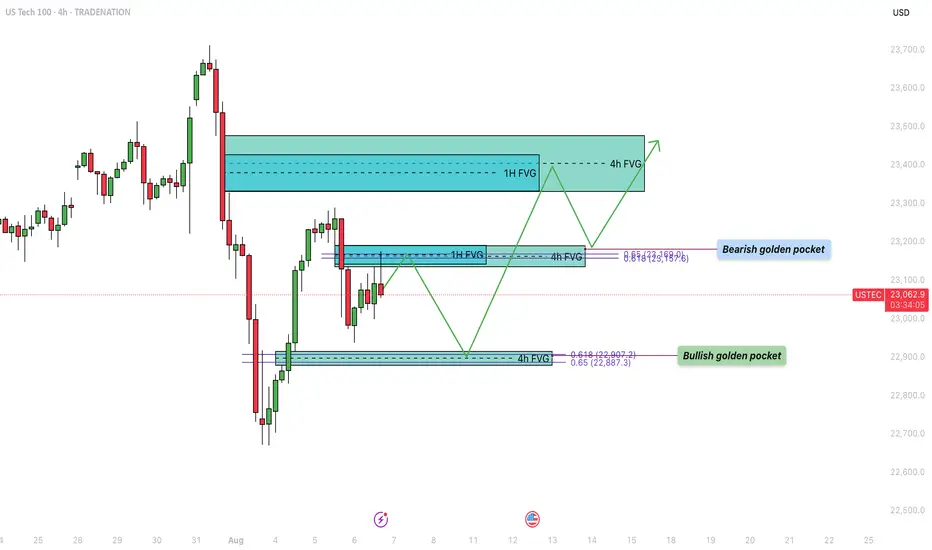
US100 - Bullish trajectory to fill the inbalance zones!Over the past week, the US Tech 100 (US100) experienced a sharp decline, dropping into a significant support zone. During this bearish move, several fair value gaps (FVGs) formed on both the 4-hour and 1-hour timeframes, which remain unfilled. Currently, price action is retracing upward, aiming to fill these imbalances. The structure of the market suggests that both bullish and bearish scenarios are in play, depending on how price reacts to key levels marked by these FVGs and Fibonacci retracement zones.
Bearish Resistance
The first major area of resistance is located around the $23,160 level, which has just been tapped. This zone presents a strong potential turning point due to the confluence of a 1-hour and a 4-hour fair value gap, which perfectly align with the 0.618–0.65 Fibonacci retracement level, also known as the golden pocket. This cluster of technical signals increases the probability that this level will act as a strong supply zone, potentially initiating a rejection back toward the lower support area.
Bullish Support
On the downside, a key level to watch is around $22,900. This zone marks a 4-hour FVG that was formed during the recent upward move. Importantly, this area also coincides with the golden pocket from that very same leg up, offering a compelling confluence for bullish support. If price revisits this level, it may act as a strong demand zone, providing a springboard for the next leg higher, particularly if buyers step in aggressively to defend it.
Bullish Trajectory
If support at $22,900 holds, the bullish trajectory suggests a possible continuation toward the $23,400 region. This upper target contains a large overlapping 1-hour and 4-hour FVG that remains unfilled. Historically, price tends to revisit and fill such imbalances before choosing a definitive direction. A bounce from the lower support zone and a successful break of the $23,160 resistance could pave the way for a clean move toward this higher target, completing the FVG fill sequence.
Final Thoughts
The US100 is currently navigating a key technical crossroads. With multiple unfilled fair value gaps and well-aligned Fibonacci levels on both the upside and downside, the next few sessions will be critical in determining short-term direction. If the $23,160 resistance continues to hold, a pullback to $22,900 could offer a high-probability long setup, while a clean break above this resistance opens the door to filling the higher FVGs.
-------------------------
Disclosure: I am part of Trade Nation's Influencer program and receive a monthly fee for using their TradingView charts in my analysis.
Thanks for your support. If you enjoyed this analysis, make sure to follow me so you don't miss the next one. And if you found it helpful, feel free to drop a like 👍 and leave a comment 💬, I’d love to hear your thoughts!
Technical Analysis of US100 on TradingView A trader is analyzing the US100 (Nasdaq 100 Index) using a 4-hour chart on TradingView. The chart displays a clear upward channel, with price action bouncing off the lower boundary and heading toward the upper trendline. A blue arrow indicates a bullish prediction, anticipating further upward movement. Support and resistance zones are highlighted, and the setup suggests a continuation of the bullish trend.
📊 Chart Overview:
Timeframe: 4-hour (H4)
Instrument: US100 (Nasdaq 100 Index)
Platform: TradingView via Capital.com
Date/Time in Chart: 25th August, 10:00 (likely UTC)
---
📈 Trend Analysis:
The price is moving within an upward parallel channel, indicating a strong bullish trend.
The chart shows multiple touches of both the upper and lower bounds of the channel, confirming its validity.
---
🟩 Support and Resistance:
Support Zone: Around 22,850–23,050 (highlighted by the green rectangular box).
Price bounced sharply from this area, showing buyers are defending it.
Resistance Area (Projected): Upper bound of the channel, which aligns with the 24,000 level.
---
🕊️ Current Market Behavior:
The price recently bounced off the lower channel boundary and the key support zone.
A strong bullish candle broke through a mini pullback area, suggesting momentum is favoring buyers.
The blue arrow indicates an expected continuation upward toward the upper resistance line.
---
📌 Technical Implications:
Bullish Bias: As long as price remains inside the channel and above the support zone, the bullish trend is intact.
A retest of the upper channel line (~24,000) is a realistic target if momentum continues.
Invalidation Level: A clean break below the support zone (~22,850) and out of the channel could shift sentiment to bearish.
---
✅ Possible Trade Idea (for Educational Purposes):
Entry: Around 23,400–23,500 (already in motion)
Target: 23,900–24,000 (upper channel line)
Stop-loss: Below 22,850 (beneath the support zone)

NAS100 LTF Bearish CorrectionAlthough overall trend is still bullish on Higher TFs, here is a high probability setup for a bearish correction on M15 TF

USNAS100 Gains on Tariff Exemption Hopes – 23690 in SightUSNAS100 – Market Overview
Tech shares lift Wall St futures on tariff exemption hopes
U.S. stock index futures rose on Thursday as optimism grows that major tech companies may be exempt from President Trump’s latest tariffs on chip imports, supporting continued strength in the tech sector.
Technical Outlook
USNAS100 has gained nearly +400 points since yesterday, maintaining strong bullish momentum.
As long as the price holds above 23440, the uptrend is expected to continue toward 23690, with potential to extend to 23870.
However, a 1H close below 23440 would suggest weakening momentum and could trigger a correction toward 23295.
Resistance: 23690 – 23870
Support: 23295 – 23045

NASDAQ Index (US100 / NASDAQ) Analysis:The NASDAQ index has shown strong bullish momentum recently and is currently trading near a key resistance level at 23,530.
🔻 Bearish Scenario:
If the price fails to break above 23,530 and selling pressure begins to appear, we may see a downside correction toward 23,350. A break below this level could extend the decline toward 23,000.
🔺 Bullish Scenario:
If the price successfully breaks and holds above 23,530, it could support a continued move upward toward 23,730 as the first target. With sustained momentum, we might see a further push toward 24,000.
⚠️ Disclaimer:
This analysis is not financial advice. It is recommended to monitor the markets and carefully analyze the data before making any investment decisions.
Sell US100US100 Sell idea. This trade setup is based on a bearish flag pattern seen on the 4HR chart. Let us see how price reacts from this resistance.