TLM/USDT breakdown analysisTLM/USDT breakdown analysis
TLM/USDT has recently broken down from a descending channel, which suggests a bearish outlook in the short term. This breakdown could indicate a continuation of selling pressure, potentially leading to further price declines.
Key observations:
1. Descending channel breakdown: The price has moved below the channel, signaling increasing bearish momentum. This often points to a retest of lower support levels.
2. Short-term outlook: TLM is likely to face further downward pressure. Traders should remain cautious in the short term.
3. Critical support zones: Watch for key support areas where the price may stabilize or attempt a bounce.
If you are holding TLM/USDT or planning a trade, ensure you apply proper risk management and avoid overleveraging. Stay patient and wait for confirmation of the next move. This is not financial advice—always do your own research (DYOR).
Market insights

Unbelievable profit!!!hello guys
We have come with the introduction of this coin, which we think can grow a lot.
After bottoming in weekly and daily time, this coin gives us this signal that it wants to grow big.
Now, according to the price, we suggest you to buy a step.
Now is the time to buy one step, and in case of modification, we have determined for you that it is suitable for buying two more steps.
The targets have also been specified that we drew for you.
If you like this analysis, please support us with like and comment

TLMUSDT - Idea TLMUSD has seen some bear action lately, the curved trend plotted on chart allows for the bulls to return
The only big resistance is the one at the dashed red line .06
Other than that the bear could turn to bull as the curve progresses
Daily chart

#TLM/USDT Ready to go higher#TLM
The price is moving in a descending channel on the 1-hour frame and sticking to it well
We have a bounce from the lower limit of the descending channel, this support is at 0.01466
We have a downtrend on the RSI indicator that is about to be broken, which supports the rise
We have a trend to stabilize above the moving average 100
Entry price 0.01800
First target 0.02084
Second target 0.02301
Third target 0.02648

#TLMUSDT Analysis: Are Bulls Ready to Take Control?Yello, Paradisers! Could #TLMUSDT be gearing up for a breakout, or will it fail to hold critical support levels? Let’s dive into the key areas of #AlienWorlds:
💎#TLM has been trading within a descending channel formation throughout most of 2024, consistently creating lower highs and lower lows. However, recent price action is showing signs of potential bullish momentum. The price has broken above the descending resistance of the channel and is now retesting critical levels that could determine its next significant move.
💎The demand zone between $0.01017 and $0.01523 remains a crucial area to watch. This region has consistently acted as a strong support, and as long as the price holds above this zone, the bullish narrative remains intact.
💎A strong rejection from this area could propel the price higher, potentially targeting the major resistance zone at $0.02400–$0.02800. This resistance is a key hurdle for bulls, and a confirmed breakout above $0.02800, supported by strong volume, could ignite a rally toward $0.04000 and beyond.
💎On the other hand, caution is warranted. A daily candle close below $0.01017 would invalidate the bullish structure and likely trigger a deeper correction. In such a scenario, the price could revisit lower levels around $0.00720 or even lower, signaling further downside risks and shaking out weaker market participants.
Stay focused, patient, and disciplined, Paradisers🥂
MyCryptoParadise
iFeel the success🌴

Alien Worlds (TLMUSDT) Higher High: Can Grow 290% MoreThe peak that was established 18-August has been broken on the current active session. TLMUSDT (Alien Worlds) is now 100% bullish and ready to forge ahead.
Now that resistance has been broken, we can expect a sudden and fast jump. We see green, green, green, green, green, together with high green/bull volume; and it keeps on going up.
The stage is set for a boom move!
We have two targets mainly based on the short-term: (1) 157% at 0.04889 and (2) 293% at 0.7463. This will be hit very soon and it will be easy.
➖ The Altcoins market will continue to grow.
➖ Bitcoin's price will continue to increase.
The Altcoins within the Cryptocurrency market is a sure way to win.
Make sure to develop a sound trading strategy to maximize profits. Opportunities are endless in this market, but we have to be smart to secure a sure win.
Timing is great right now. It doesn't get any better than this.
If you are reading this now, you are still early, the market has so much more to give.
We still have many months ahead of us that will be characterized by maximum growth.
Yes, there will be a correction at some point, but this will be good too, this will be an opportunity to buy the pairs that we missed.
We buy now the ones that are low and secure profits. When the correction comes, this will open up a second entry.
We are likely to get only one correction in the entire bull-market phase.
Focus on the upside. When bullish, look up. Aim high.
Thank you for reading.
Namaste.

Alien Worlds Enters New Bullish Wave (Breakout Confirmed)Trading volume has always been high for this pair, which is a very good signal overall. Many pairs have really low volume and this shows lack of interest from the public. Here we can see healthy volume on the TLMUSDT (Alien Worlds) trading pair.
How are you feeling today?
I hope this day is treating you good.
It is going good indeed because the altcoins market is up and green; fully confirmed.
➖ TLM produced a major bullish breakout. We are seeing more than 70% growth in a single day. This type of action is always only the start of something big; something great.
➖ The bullish momentum we are seeing reveals what's to come. The bullish wave can last three weeks, 21 days, just as it can last 40 days or more. With this momentum, we can experience massive growth.
Of course, it is for the market to decide...
➢ Has the bottom been hit?
➢ Should we focus on a short-term move or rather long-term growth?
These are questions to ponder because: What does down, must sooner or later recover and move back up! (In reference to the altcoins which are now growing strong.)
Namaste.

Technical Analysis for $TLM/USDT Technical Analysis for $TLM/USDT
#TLM The chart displays a falling wedge breakout, a bullish reversal pattern that signals a shift from a downtrend to an uptrend.
The "Buy here after correction" zone at $0.01355 serves as a strong support and an ideal entry point for long positions during a retracement.
$0.01355 - $0.01187: Key support zone, marking the Fibonacci retracement area and a critical zone for potential accumulation.
Resistance Levels (Targets):
T1: $0.03115
T2: $0.03897
Last Target: $0.04772

inverted H& S Breakout pending Alt coin that would blast - Inverted H&S
This is another coin that is going to blast, formed bullish pattern at the bottom
Enjoy, keep learnign and keep earning
GK Trade Manthan

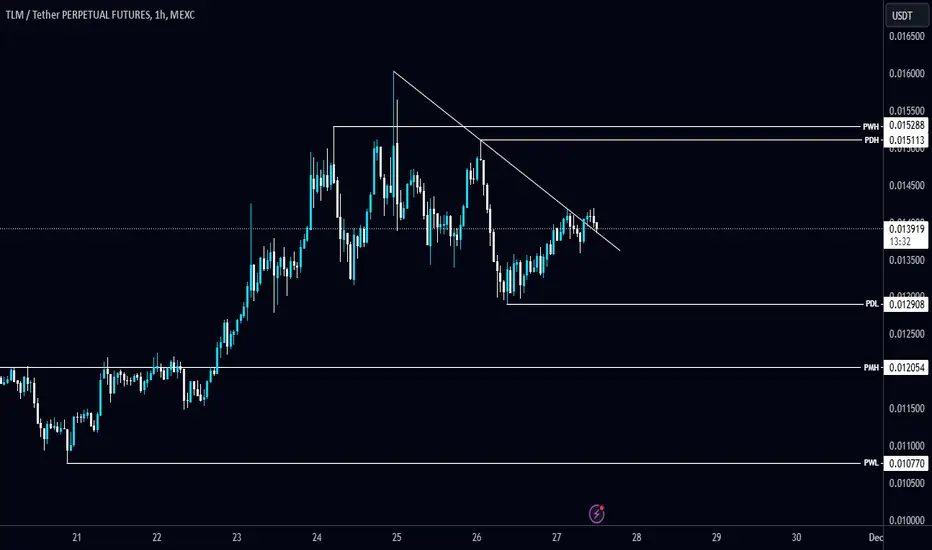
Keep an eye on #TLM/USDT Diagonal Trendline retest in 1-Hour TF!Keep an eye on #TLM/USDT Diagonal Trendline retest in 1-Hour TF!
In case of a successful retest, it can bounce from here. the local resistance level is PWH $0.015288 and the support level is PMH $0.012054.
TLMUSDT | Buy Now, Thank Later | Near Term (4HR)TLMUSDT | Buy Now, Thank Later | Near Term (4HR)
Money flow... BTC, then ETH, then Large Caps, Then Mids and Smalls
Additional altcoin near term and midterm chart ideas listed below
Timeline of events for the Bull Market indicated on chart
DODOUSDT | Buy Now, Thank Later | Near Term (4HR)
LPTUSDT | Buy Now, Thank Later | Near Term (4HR)
VRAUSDT | Buy Now, Thank Later | Near Term (4HR)
XCHUSDT | Buy Now, Thank Later | Near Term (4HR)
CSPRUSDT | Buy Now, Thank Later | Near Term (4HR)
VELOUSDT | Buy Now, Thank Later | Near Term (4HR)
UMAUSDT | Buy Now, Thank Later | Near Term (4HR)
OGNUSDT | Buy Now, Thank Later | Near Term (4HR)
DOTUSDT | Buy Now, Thank Later | Near Term (4HR)
VIDTUSDT | Buy Now, Thank Later | Near Term (4HR)
BTCUSDT | Alts Poised to Explode | Near Term (2H)
Mock Up Price Action for ALGOUSDT | Mid Term (12HR)
MYRIAUSDT | Interested to see where this goes | Mid Term (2D)
Mock Up Price Action for VRA w/ Timeline | Mid Term (3D)
Mock Up Price Action for XCH | Mid Term (12HR)
OGNUSDT | Interested to see where this goes | Mid Term (3D)
Mock Up Price Action for CSPRUSDT | Near/Mid Term (2D)
VIDTUSDT | Interested to see where this goes | Mid Term (3D)
RAREUSDT | Interested to see where this goes | Mid Term (3D)

#TLM/USDT took the liquidity above PMH in 1-hour TF!#TLM/USDT took the liquidity above PMH in 1-hour TF!
ASX:TLM breaks the Diagonal Trendline and looks bearish. The local resistance level is PMH $0.012055, and the support level is PML $0.008175.

TLMUSDTTLM ~ 6D
#TLM is currently at its lowest price. If you still have Conviction on this coin,. This support block will be an excellent buying place. at least for a 20%++ increase

TLM trade setup. Bullish move!TLM up from support zone and broke HTF bearish trendline. Should result in a move up to the next resistance level at least. I put a limit order now on a LTF FVG, so lets see if it hits my entry or not. One percent risk on this trade. NFA! :)

TLMUSDTTLM ~ 2D
#TLM If you still have Conviction on this coin,. This is an excellent price to start buying again.

TLM/USDT Looking Ready TLM/USDT has completed a breakout and retest on the 12-hour time frame. The price has cleared the previous resistance level, indicating potential bullish momentum. The recent retest held at the breakout level, which is now acting as support.
With increasing buying pressure, there’s a chance for a significant move soon. Keep an eye on volume trends to confirm the strength of this upward movement.
This is not financial advice; always do your own research before making investment decisions.

TLMUSDT is BullishPrice was in a strong down trend, however a matured divergence seems to be at play now as previous lower high is broken successfully, and if the bullish momentum further sustains we can expect a bullish rally as per Dow theory. Targets are mentioned on the chart.

TLMUSDT Perpetual Futures Binance 15m Chart AnalysisThis is my personal analysis and for educational purposes only. Kindly do yiyr research before trading.

TLMUSDT Perpetual Futures Binance 15m Chart AnalysisThis is my personal analysis and for educational purposes only. Kindly do yiyr research before trading.

TLMusdt trading opportunityTLMusdt is currently exhibiting a determined effort to breach a persistent supply trendline. The buy back zone is an important demand zone for immediate accumulation.
A successful breakout from this resistance could trigger a substantial rally towards our immediate setup target.
Upon a successful breakout, the initial target becomes pivotal, and a surge in price momentum towards this level is anticipated. Subsequently, the continuation of this move towards the final target zone is within the realm of possibility.
Your participation is appreciated, please don't hesitate to contribute.
Thank you.

TLM Long PlanTLM/USDT Long+spot buy Plan
price is coming to 8h discount zone
plus OTE trade level
HTF liquidity sweep is done
We can open long here after LTF confirmation

TLMUSDT 1WTLM ~ 1W
#TLM this is the lowest price of TLMUSD, It's interesting to make purchases gradually from here, At least 20%+ increase from here,

a cute butterfly was found on TLMUSDTNOT A RECOMMENDATION.
Harmonic Bearish Butterfly Pattern on TLMUSDT.P
:)
