Part 4/4 GoldGroundbreaking move from Beijing:
Chinese insurance giants can now invest in gold for the first time .
Firms: PICC, China Life, and 8 more
Max allocation: 1% of assets
Potential inflow: 200 billion yuan ($27.4 billion)
Why is this big?
China = #1 gold consumer globally (910 tons consumer demand in 2023)
Gold has cultural, symbolic and strategic importance
China moving reserves from USD to gold
This policy change is a structural shift, not just a headline]
Conclusion:]
Add China’s institutional demand to war + inflation + falling rates, and we get one clear strategy:
BUY Gold. Target: $5000 in 2025]
TGD1! trade ideas

GC Ready for a Push to New All-Time HighsGold Futures (GC) are showing signs of accumulation and upward momentum, with the chart forming a rounded base suggesting a potential breakout. Recent price action has been consolidating in a bullish structure, and we may be gearing up for a breakout towards new all-time highs.
With rising geopolitical tensions in the Middle East, gold's safe-haven appeal could drive significant buying pressure in the coming sessions. Volume is stable and supportive, and the technical structure aligns with a bullish continuation.

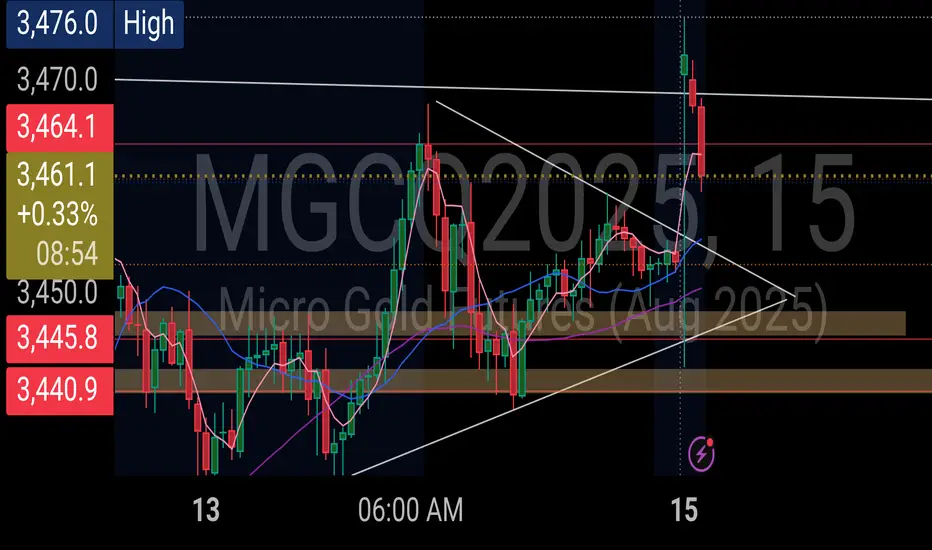
Gold is giving up a Set up! Been waiting for this set up. But trying to remain disciplined on this one. I Need to see a sweep of lows at this point in order to be interested in the buy. Once we see that its on. Until then we sit on hands and wait.

$MGC / $GC / Gold Post-Market UpdateHello Fellow Degenerates,
Price retraced below a 3416.2 and it is now between that level and a FVG. I do see some signals that a possible pull back might happen and I have now marked 3442-3430 as an important range to watch.
- If the pullback happens, it could be a retest of the HVN resistance, and if price gets rejected in that range, we will go towards our bearish scenario.
- However, if price breaks above that range with strength it will mean that we are now going towards our Wave 5 target near 3504.
- Levels to watch: 3504, 3442, 3430, 3416, 3358, 3283.

$MGC / $GC / Gold - Pre Market Update - June 16Hello Fellow Gamblers,
This dip on gold is tracking with our Wave 4 dip. If the level hold we're going towards Wave 5 at 3504 and above.
Losing 3416 can trigger price to retrace all the way down towards 3358.
- Levels to Watch: 3504, 3416, 3358, 3283

GC analysis GC continues to trade higher and has made a new ATH. I have got two successful trades in gold.

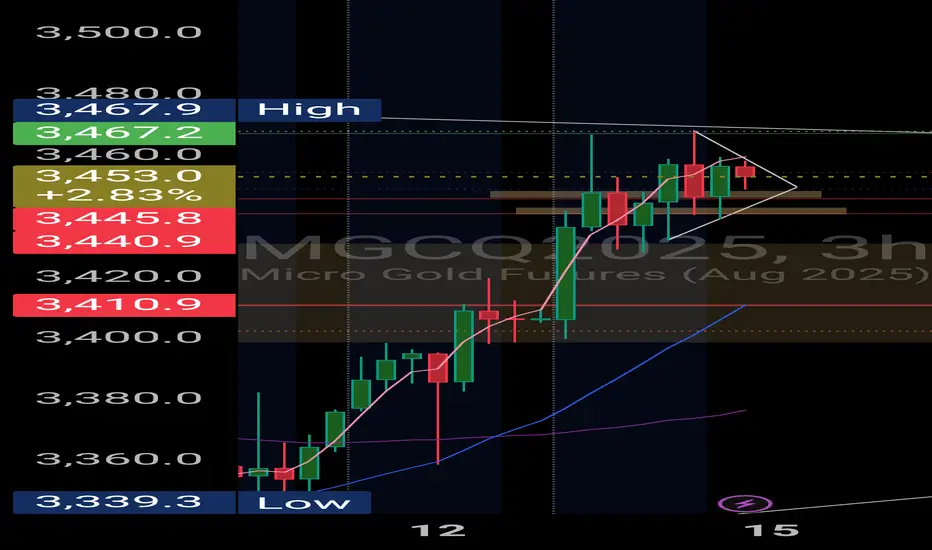
Global Activities are looking to Push Gold bullishWaiting to see a full on break out before confirming its going to be bullish for the week but it sure does look like that's what its going to be for the next few days. Just be patient and wait for price to confirm.

Opening gap manifests... Likely retrace too cover gap. I'd watch for 50% of gap before considering possible reentry below recent high. May retest. 👀

Seeking new ATHAlready broken through top off pennant after long consolidation so likelihood of big drops are slim... and based on events, likelihood of retesting ATH between now and end of the month...

Gold driven by war in middle east Thoughts on gold:
Slight possibility of reversal to 3410.9 (3h 20 EMA). More likely, given war in middle east, is gap open to the downside to cover price to 3446.0...

Supply and Demand Flips. No bias needed. Gold Covering the supply and demand flips on Gold. how to trade without a bias. If the sole goal is to make money then you can trade this. I will make another part 2.

GOLD ANALYSIS FOR THE WEEKI've been studying GOLD (GC) & others and want to share my analysis. Trading involves probabilities, so it's essential to be confident and prepared. Study the market thoroughly before trading with real money.
Let's test strategies this week. You may use a live account if you have capital, and manage your stop losses carefully. Next week, I'll provide more details on entry points and stop losses. Wait for trades at specified levels and avoid positions in the middle to minimize losses. Be patient and trade from one edge to the other.
Good luck and make money.
For one-on-one sessions: $20k per person. You'll learn weekly, monthly, and yearly calculations. Weekly subscriptions are also available for $500 per person. COMEX:GCD1!

$MGC1(Gold) Weekend Update - June 14Hello Fellow Gamblers,
I hope you're not sinking in your twin size bed thinking about your losses from this week.
I am bringing to you a weekend update on gold, so we can get ready for this week. This video is a little bit longer and my ability to speak becomes worse as time extends, so take your time and get your notes right to prepare for the week.
- 3416.2 needs to hold for more upside. A break below that level can take us towards 3358.8.
- A break below 3358.8 validates our bearish scenario.
- A break above 3504.1 validates our bullish scenario.
- Levels to watch: 3416.2, 3358.8, 3504.1

Beginner Friendly Price Action Analysis For GoldIn this video, I demonstrate the process of analyzing a chart from a top down perspective so that the beginner trader can understand the process.

GC1! BuyOverall Gold is Bullish so I wouldn't recommend risking playing the pull back to key level. Setting (1 contract) Buy Limit order for a tap of zone between 3425-3427 on the 5/15 min timeframes. Add to position after reversal confirmation

I'm Buying!Price will go above 3500 just don't know how much. I want to play safe, 1st target @3500. As our 2nd target accomplishes we'll take reverse position on the possible top.

Geopolitical Scenario. Market Outlook during London OpenCovering Gold Dax NQ and other assets with proper reasoning.

Gold Up?Gold might continue to go up even more, seems like a 4th wave in hourly
Price currently at a gap resistance, need to wait and watch what it does
4 Hourly Chart showed price taking a retest of trendline
Daily chart shows a clear ABC wave, possible all time high soon?

What is Gold Silver Spread?What is gold silver spread? How to understand them to determine the market direction.
Reuters mentioned that the gold-silver ratio dropped from 105 to 94. What does this mean? Does it indicate that silver is about to trend higher, or is it a sign that gold will continue its trend?
Micro Silver Futures
Ticker: SIL
Minimum fluctuation:
0.005 per troy ounce = $5.00
Disclaimer:
• What presented here is not a recommendation, please consult your licensed broker.
• Our mission is to create lateral thinking skills for every investor and trader, knowing when to take a calculated risk with market uncertainty and a bolder risk when opportunity arises.
CME Real-time Market Data help identify trading set-ups in real-time and express my market views. If you have futures in your trading portfolio, you can check out on CME Group data plans available that suit your trading needs www.tradingview.com
Trading the Micro: www.cmegroup.com
www.cmegroup.com

New Highs for Gold = New bull RunHere it is!! the breakout I been talking about in my other updates. doing it on a Friday cause Israel is starting ish! Sitting this out cause it can get volatile.

MGC Post Market Update - The Battle of the Two CountsHello Fellow Gamblers,
As you know we are tracking 2 EW counts at this time and they are both still in play.
W5's are tricky to deal with but with a little patience we should be able to make our portfolio grow.
- I am currently looking for bearish divergences to support our bearish Scenario but the current price move strength favors our bullish scenario.
- Be aware of a possible Cup and Handle formation
- Levels to watch: 3508.4, 3441.9, 3365.2, 3314.7.
See you next time!
