TON: Bullish Wave Still In ProgressTON: Bullish Wave Still In Progress
From our last analysis, TON keeps building momentum and overall the trend is getting stronger.
The bullish setup is still intact. I don’t expect it to fall below 2.75, and I believe the bottom is already in place.
Since accumulation has been ongoing since Febr
No news here
Looks like there's nothing to report right now

Lingrid | TONUSDT Channel Border Challenge Potential LongOKX:TONUSDT is consolidating near 3.15 after holding above the key 3.10 upward trendline support. The recent flag structure suggests buyers are preparing to regain momentum, with the projection aiming for 3.30 as the next target. A sustained break above 3.30 would strengthen bullish momentum toward


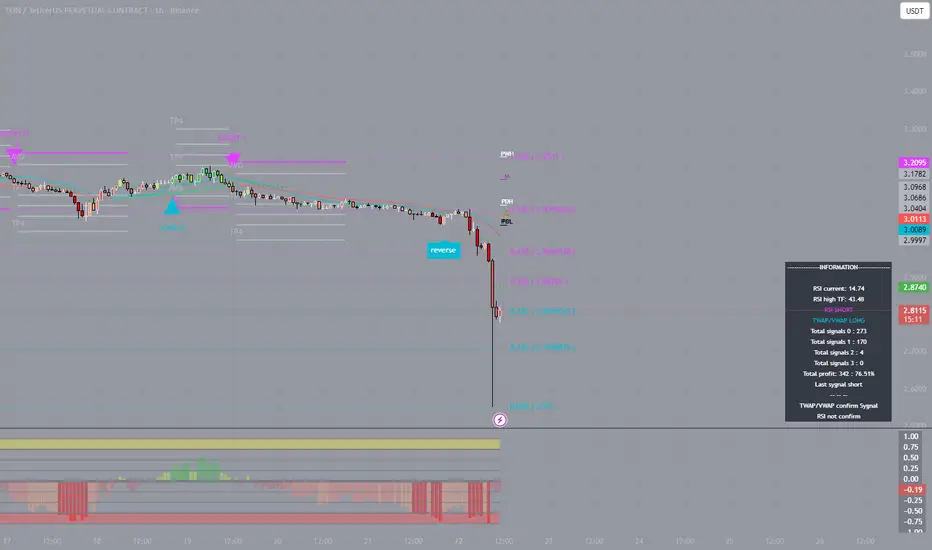
TON: Precise ExecutionOn September 19, I entered a short at $3.1313 on the 1-hour chart, using 20x leverage. The trade is still active, but the first two profit stages have already been secured. TP1 was closed at $3.0941, and TP2 at $3.0536. The difference of about 8 cents per coin, with such leverage, delivered a notice
TON/USDT –> Inverse Head & Shoulders Breakout SetupHello guys!
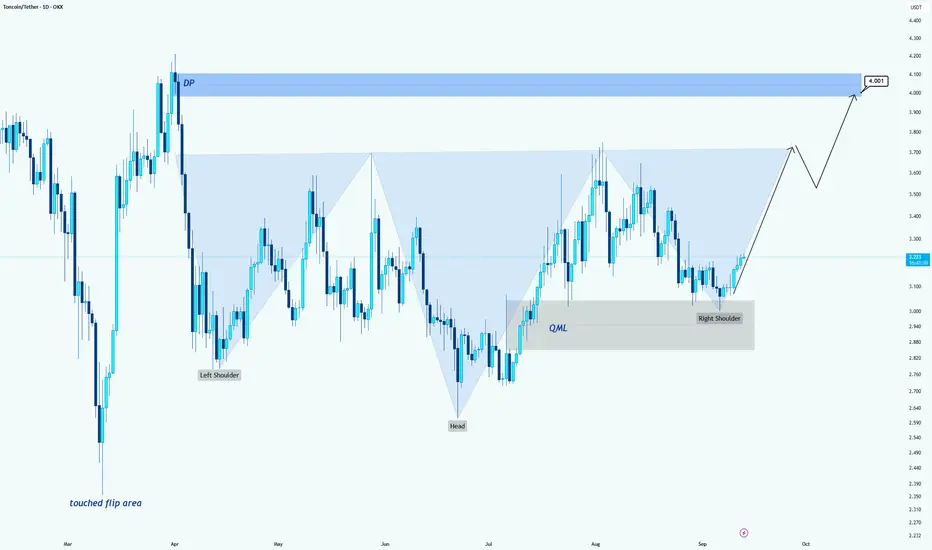
On the daily chart, TON is forming a clear Inverse Head & Shoulders pattern, a classic bullish reversal structure.
Key Levels & Structure:
Left Shoulder: Around 3.00
Head: Around 2.30
Right Shoulder: Recently formed around 3.00, confirming buyer interest.
QML Zone: 2.90 – 3.
Long trade
Pair: TONUSDT
Direction: Buyside trade
Date/Session: Fri 19th Sept 2025, NY Session AM
Timeframe: 1H
🔹 Trade Details
Entry: 3.0937
Profit Level: 3.3803 (+9.09%)
Stop Level: 3.0406 (-1.20%)
Risk-Reward (RR): 2.58
🔹 Technical Structure
Liquidity:
Previous lows swept near 3.10 (stop run/liquidity g

TON - About to be worth a TON of moneySeeing a few of these easily identifiable trend changes, expecting bears to likely fight the first bullish move back hard after hitting both local high VWAP +Resistance trend line, but after that I suspect swift bullish movement. Very clean chart overall.
Overall Wave-Count Confidence: Above Avera

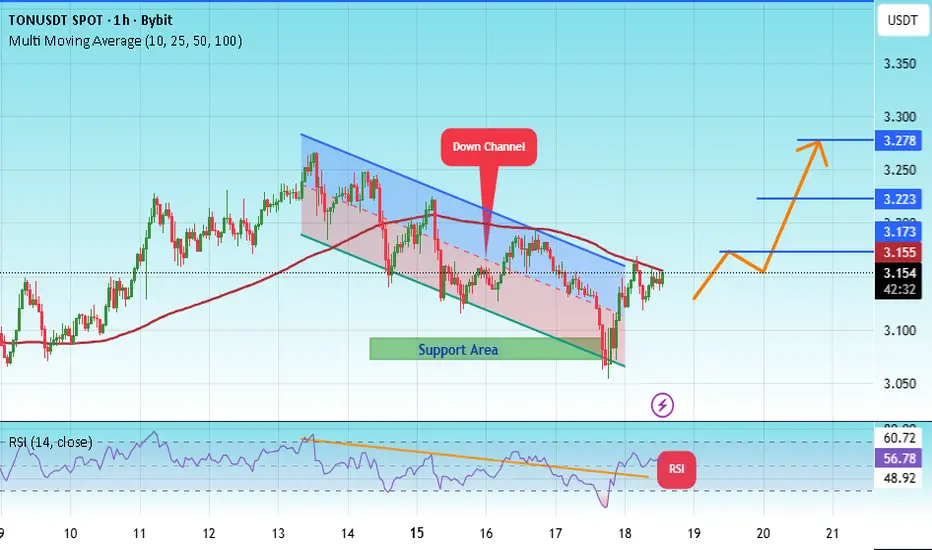
#TON/USDT | TON Testing Wedge Breakout Amid Key Support#TON
The price is moving within a descending channel on the 1-hour frame, adhering well to it, and is heading for a strong breakout and retest.
We have a bearish trend on the RSI indicator that is about to be broken and retested, which supports the upward breakout.
There is a major support area i

See all ideas
Summarizing what the indicators are suggesting.
Oscillators
Neutral
SellBuy
Strong sellStrong buy
Strong sellSellNeutralBuyStrong buy
Oscillators
Neutral
SellBuy
Strong sellStrong buy
Strong sellSellNeutralBuyStrong buy
Summary
Neutral
SellBuy
Strong sellStrong buy
Strong sellSellNeutralBuyStrong buy
Summary
Neutral
SellBuy
Strong sellStrong buy
Strong sellSellNeutralBuyStrong buy
Summary
Neutral
SellBuy
Strong sellStrong buy
Strong sellSellNeutralBuyStrong buy
Moving Averages
Neutral
SellBuy
Strong sellStrong buy
Strong sellSellNeutralBuyStrong buy
Moving Averages
Neutral
SellBuy
Strong sellStrong buy
Strong sellSellNeutralBuyStrong buy
Displays a symbol's price movements over previous years to identify recurring trends.