$TON Trendline Probe – Support Hold or Further Fade?BINANCE:TONUSDT LSE:TON Trendline Probe – Support Hold or Further Fade?
Current trend: TON's grinding along the descending trendline from 2.50 peaks, now hugging 1.90 support amid alt bleed—sellers probing, but low-volume wicks signal potential buyer trap 🛡️.
Hold support? Yes probable; EMA stack and prior lows confluence could spark a clean rejection.
Breakout above resistance? Bullish if 2.30 clears on close—unleashing 5-7% rally to trendline top 🚀.
Dip risk? Moderate to 1.85 on breach, tied to BTC drag.
Target: Short-term 2.10 bounce; downside 1.80 buffer.
Indicators tracking: RSI (42, neutral zone), Trendline slope, and MACD histogram fade 📊.
#TONTrading #CryptoSupport #FiboTrendCrypto
Market insights

Lingrid | TONUSDT Demand Area Long Entry OpportunityThe price perfectly fulfilled my previous idea . OKX:TONUSDT is dipping into the support zone after a sharp breakdown from the compression structure, retesting the lower boundary of the descending channel. 4H chart shows price interacting with both the long-term support line and the short-term descending trendline, creating a confluence area for a potential rebound. A sustained hold above 1.85 opens the path for a corrective rally toward the 2.00 psychological mark as buyers step in from the reaction zone. Overall, the structure favors a short-term bullish bounce as long as the support base remains intact.
⚠️ Risks:
A clean H1/H4 close below 1.86 would invalidate the rebound setup and expose 1.79.
Weak market sentiment across majors could limit the strength of the corrective move.
Failure to break above the descending trendline may trap price in extended consolidation.
If this idea resonates with you or you have your own opinion, traders, hit the comments. I’m excited to read your thoughts!

$TON Downtrend Pressure – Support Lifeline?BINANCE:TONUSDT CRYPTOCAP:TON Downtrend Pressure – Support Lifeline?
Current trend: TON's riding a descending channel, bouncing off the 1.84 support after capping at 2.36 resistance—fading volume on reds points to weakening bear control 🛡️.
Hold support? Yes likely; hammer patterns and channel base confluence drawing buyers for a potential stall.
Breakout above resistance? Setup for 2.36 flip on strong close—could propel 7-9% upside to channel top 🚀.
Dip risk? Moderate to 1.80 if trendline accelerates, but oversold signals curb it.
Target: Rebound to 2.20 short-term; deeper 2.40 on momentum.
Indicators tracking: RSI (42, neutral bounce zone), Channel slope for breaks, and VWAP pivot 📉.
#TONTrading #CryptoChannel #FiboTrendCrypto

$TON Support Rebound, Telegram Token Takeoff?BINANCE:TONUSDT CRYPTOCAP:TON Support Rebound, Telegram Token Takeoff? 📊📱
TON's 1H trend bullish, firmly bouncing from key support ~1.95 with volume surge—ecosystem bulls defending!
High hold probability, breakout above 2.35 resistance targets 2.50.
Deeper dip risk low (watch 1.90), but trail stops.
RSI ~54 (momentum build), 50 EMA crossover, MACD positive.
TON to the moon! 🚀
#TON #CryptoTrading #Altseason

TON Spot LONGThe newly formed range indicates local signs of accumulation.
After the deviation of the lower boundary of the range, an upward IOF was born, and with additional manipulation in the POI zone, there will be a great opportunity to open a long position. 📈

Lingrid | TONUSDT Pullback Trading OpportunityThe price perfectly fulfilled my previous idea . OKX:TONUSDT rejected from resistance and began to slide, confirming a bearish reaction from the upper boundary. The structure shows a consolidation breakdown followed by lower highs forming beneath the trendline. A drop below 2.00 could accelerate toward 1.88–1.79 as the market resumes its downward phase. Bearish momentum remains dominant while the pattern points toward a continuation of the sell-off.
⚠️ Risks:
A sudden BTC rally could lift the broader crypto market and delay further decline.
Strong buying pressure near the 1.90 zone might trigger a temporary rebound.
Unexpected positive TON ecosystem news could invalidate the bearish setup.
If this idea resonates with you or you have your own opinion, traders, hit the comments. I’m excited to read your thoughts!

Scalp Short – TON💎 Scalp Short – TON
RSI is weakening and entering the overbought zone, while price has broken below key support, signaling potential downside continuation.
🎯 Plan:
→ Enter after confirmation of breakdown retest.
→ TP: 2.148 | SL: 2.36 | RR: 1 : 2.85
Momentum favors the short side.
Keep entries precise, trail SL as price moves lower.
Stay disciplined — execute only after clear confirmation.

Not Yet Done — TON’s Triangle RunI’m slightly adjusting my previous plan, as the current structure made me rethink the pattern.
Earlier, I thought the ABCDE triangle was already complete, but now I’m starting to doubt that.
At the moment, I believe wave E might still need to form — and I see two possible scenarios for how it could unfold:
either along the green path or the purple one.
I’m leaning more toward the purple scenario, but it’s also possible that what we’re seeing now is still part of wave D — meaning yesterday’s low at 2.0959 could be just a portion of that move.
If that’s the case, Tone may first drop toward 1.96 to finish wave D,
then rise again to complete wave E of the triangle before continuing downward.
In that case, the decline could extend well below 1.96, possibly even toward 1.6.

Ton Holds Strong Support, Targets 28% Rally Toward $2.70Hi
the support and resistances on the chart are based on the previous data and weekly candlesticks if OKX:TONUSDT holds this last support the potential of 28% gain is logical toward 2.70$

TON Buy/Long Setup (2H)On your chart, the coin has been forming consecutive higher lows and consistent bullish CHs on the lower timeframes.
We can enter positions around the green lines, which are our ENTRY levels.
The targets are marked on the chart.
Let’s wait and see what happens.
For risk management, please don't forget stop loss and capital management
When we reach the first target, save some profit and then change the stop to entry
Comment if you have any questions
Thank You

TONLSE:TON is forming a clean descending wedge pattern, showing strong potential for an upside breakout. The measured target sits at $5.8, offering around 160% upside from current levels. Momentum is building, and this setup looks ready to play out soon.

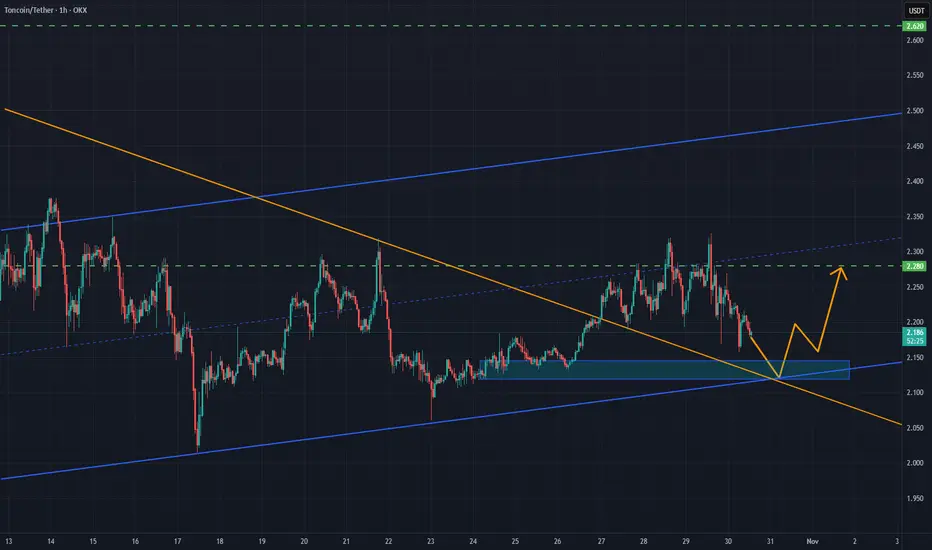
Lingrid | TONUSDT Key Confluence Support Long OpportunityThe price perfectly fulfilled my previous idea . OKX:TONUSDT is retesting the key confluence area near 2.13 after multiple higher lows formed along the ascending support trendline. Price action shows compression within a narrowing structure, hinting at potential breakout momentum building up. A confirmed bounce from this support may lift price toward 2.28, aligning with short-term resistance and the upper boundary of the range. Overall bias stays bullish as long as the 2.10–2.13 support cluster holds firm.
⚠️ Risks:
Failure to hold the 2.10 support zone could invalidate the bullish scenario.
Increased volatility ahead of macro data releases could cause short-term whipsaws.
Weak momentum or low trading volume may limit the breakout’s sustainability.
If this idea resonates with you or you have your own opinion, traders, hit the comments. I’m excited to read your thoughts!

Technical Analysis: #TON/USDT 1-Day ChartTechnical Analysis: #TON/USDT 1-Day Chart shows a drop from a high of around 4.211 to a low of 2.355 recently, with a small dip (-1.69%) today. A falling wedge pattern is forming could mean a chance to bounce back
Support Zone: A strong base is at 2.600-2.789, where buyers might jump in.
Resistance Level: The next big test is at 3.091-3.265—break that, and it could rise
Falling Wedge: This pattern, with its narrowing lines, often signals a bullish move if it breaks above 3.265
Momentum: The downtrend had steady volume, but the pattern hints at a possible upturn.
Timeframe:Watch the next few days for the wedge to break out.
Possibilities:
Bullish Move: A jump above 3.265 with good volume could push it to 3.600 or more!
Bearish Drop: A fall below 2.789 might take it back to 2.355—stay careful!
Safety Tip: Set a stop-loss below 2.789 to stay safe.

TON/USDT: Compression Builds Above Support as Bulls Eye BreakoutTON/USDT is retesting the key confluence zone near 2.13, supported by multiple higher lows along the ascending trendline. Price is compressing within a narrowing structure, signaling potential breakout momentum.
A confirmed bounce from this area could drive price toward 2.28, aligning with the upper boundary of the range. The bullish bias remains intact as long as the 2.10–2.13 support cluster continues to hold.
TON/USDT — Defense Zone at 2.20–1.92: Reversal or Breakdown?TON is now standing at a critical inflection point — the 2.20–1.92 zone (yellow block).
This area isn’t just another support level — it’s the make-or-break zone that will decide whether TON will rebound for a macro reversal or collapse into a deeper downtrend.
After a sharp fall from the 8.28 high, price has reached its historical demand base, showing a strong wick rejection below support — a classic sign of liquidity sweep or stop-hunt, often marking the final shakeout before larger players begin accumulating.
However, without a clear structure break and volume confirmation, the risk of a fake bounce remains high.
---
Structure & Pattern Analysis
1. Macro trend remains bearish, with a series of lower highs and lower lows since the 2024 peak.
2. The 2.20–1.92 zone represents a major accumulation range, also aligning with the previous breakout base from early 2023.
3. The deep wick indicates a potential spring phase in a Wyckoff Accumulation pattern, where weak hands are flushed out.
4. A confirmed close above 2.65 would mark a structural shift — signaling a possible start of a new bullish leg.
5. On the other hand, a close below 1.92 would validate a macro breakdown, opening room for a prolonged bearish continuation.
---
Bullish Scenario (Potential Reversal)
Confirmation: A 4D candle close above 2.65, supported by increasing volume.
Technical narrative: After a long liquidation event, price tends to form a V-shaped rebound or base breakout once smart money steps back in.
🎯 Upside Targets:
Target 1 → 3.55 (local distribution zone)
Target 2 → 4.60 (key structural pivot)
Target 3 → 6.84 – 8.09 (major supply zone & prior 2024 top)
💡 If momentum builds, this could evolve into a multi-month recovery rally, similar to the early bull phase of 2024.
---
Bearish Scenario (Continuation Risk)
Confirmation: A 4D close below 1.92 confirms breakdown of the macro support.
Technical narrative: Once this zone fails, buyer exhaustion could drive price toward 1.50–1.20, the next historical liquidity pool.
🎯 Downside Targets:
Short-term support → 1.80
Extended range → 1.50 – 1.20
A proper reversal would then require a new long accumulation base forming at lower levels.
---
Technical Summary
TON is currently hovering within its largest accumulation zone in over a year.
This yellow block (2.20–1.92) will determine the next major trend:
Hold and reclaim 2.65 → bullish reversal confirmed.
Fail and close below 1.92 → macro breakdown confirmed.
At this stage, TON offers a high-risk, high-reward setup for swing traders — ideal for those waiting for clear structural confirmation before entry.
#TON #TONUSDT #CryptoAnalysis #TONCoin #TechnicalAnalysis #SwingTrade #BreakoutSetup #SupportAndResistance #Wyckoff #MarketStructure #AccumulationPhase #CryptoUpdate #PriceAction

$TON (WEEKLY): BEARISH PENNANT breakdown, super OVERSOLDMassive news for the CRYPTOCAP:TON ecosystem as Pavel Durov unveiled #COCOON. Let me start by saying that there are some massive red flags with this blockchain.
Huge monthly unlocks began earlier this month (see attached info): 36.59 million tokens were released on 12 OCT, marking the first of 36 monthly unlocks scheduled over the next 36 months — roughly $80M worth. The next batch is due 11 NOV, two weeks from now.
Another red flag is TON’s general performance this cycle — it has heavily underperformed compared to CRYPTOCAP:ETH , #DeFi tokens, and basically every major category. See the attached graphic in the comments (on X).
Further, on-chain metrics — especially revenues and fees — are disappointing. You’d expect more adoption considering Telegram has nearly a billion users. Nope — the blockchain still struggles to generate meaningful revenue.
Finally, on the weekly chart, CRYPTOCAP:TON remains in a steady downtrend this cycle, with a bearish pennant breakdown in place.
It’s very oversold (RSI ≈ 20) and does show a bullish OBV divergence, though.
The COCOON collaboration does sound exciting, and I’ll research it further — but there are still too many red flags surrounding this layer 1.
Definitely not aping in yet. The charts have to convince me first, not Durov — so, not yet.
💙👽

Ton’s Turn — Watch It Burn Before the ReturnWe’re following one of the scenarios I shared earlier —
the yellow path from my previous publication.
At this stage, I expect further downside movement on $TON.
🎯 First target: 2.12
🎯 Global target: 1.98 - — and possibly even slightly lower
🔴 Invalidation zone: 2.2618
Please stay cautious and avoid catching the bottom —
it’s always better to wait for confirmation before any long entries

TON on the Run — Before It’s DoneMy previous forecast for TON has played out as expected — the price reached 2.26 and even moved slightly higher.
At the moment, I see two potential scenarios, yet both seem to point toward the same outcome.
In my opinion, wave E of the corrective pattern might not be fully completed.
Structurally, this looks like a contracting triangle, which often precedes a bearish breakout.
For now, I’m watching for a move down to the lower red line as a short-term target.
But from a broader perspective, I believe TON could drop even lower once the triangle is complete and the downward wave resumes
⚠️ Disclaimer: This analysis is based on technical patterns and personal observations. Trading cryptocurrencies carries significant risks. Always perform your own research and manage your risk accordingly

#TON/USDT Consolidation Buy After Sell-Off#TON
The price is moving in a descending channel on the 1-hour frame and is expected to break it and continue upward.
We have a trend to stabilize above the 100 moving average again.
We have a downtrend on the RSI indicator that supports the upward move with a breakout.
We have a major support area in green that pushed the price higher at 2.12.
Entry price: 2.15.
First target: 2.16.
Second target: 2.18.
Third target: 2.21.
To manage risk, don't forget stop loss and capital management.
The stop loss is below the support area in green.
When the first target is reached, save some profits and then change the stop order to an entry order.
For inquiries, please comment.
Thank you.

TONUSDT 3D#TON is moving inside a falling wedge pattern on the 3-day timeframe chart. Consider buying here and near the support zone. In case of a breakout above the wedge resistance, the potential targets are:
🎯 $2.666
🎯 $2.955
🎯 $3.537
🎯 $4.008
🎯 $4.478
🎯 $5.147
🎯 $6.000
⚠️ Always remember to use a tight stop-loss and maintain proper risk management.

TON have a good Investment Opportunity Hi Everyone;
today we have one of the best risk to reward Investment opportunity
it is more than 34 times the risk and the chart is look very promising.
I expect breaking the previous bear market key point will clear the way to the final target

A TON of Hope — or Just a Slope?I expect TON/USDT to rebound toward 2.26.
The invalidation zone is marked in red on the chart.
Still, let’s keep our feet on the ground — we all remember that recent crash.
So far, there are no strong signals of a new bullish trend.
This move up looks more like a correction phase inside a broader bearish structure, not the start of something bigger.
Trade wisely — not emotionally

Lingrid | BTCUSDT Buying Opportunity In Sideways Market OKX:TONUSDT recently rebounded from the support zone after completing a range breakout and forming an ABC corrective move near the $2.0 mark. Price structure remains compressed between the descending resistance and rising trendline, hinting at a potential bullish recovery setup. A sustained above $2.10 could signal continuation toward $2.22. The bullish scenario builds from the ongoing rebound phase within the structure break above current range zone.
⚠️ Risks:
Rejection from $2.10 may invalidate the breakout structure.
Broader crypto weakness could cap upward momentum.
Failure to sustain above the trendline may shift bias back to bearish continuation.
If this idea resonates with you or you have your own opinion, traders, hit the comments. I’m excited to read your thoughts!
