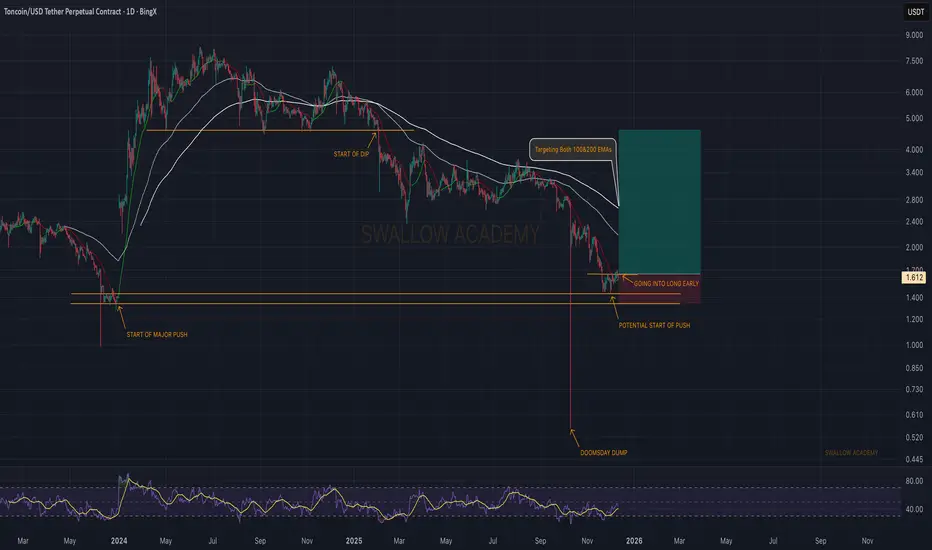
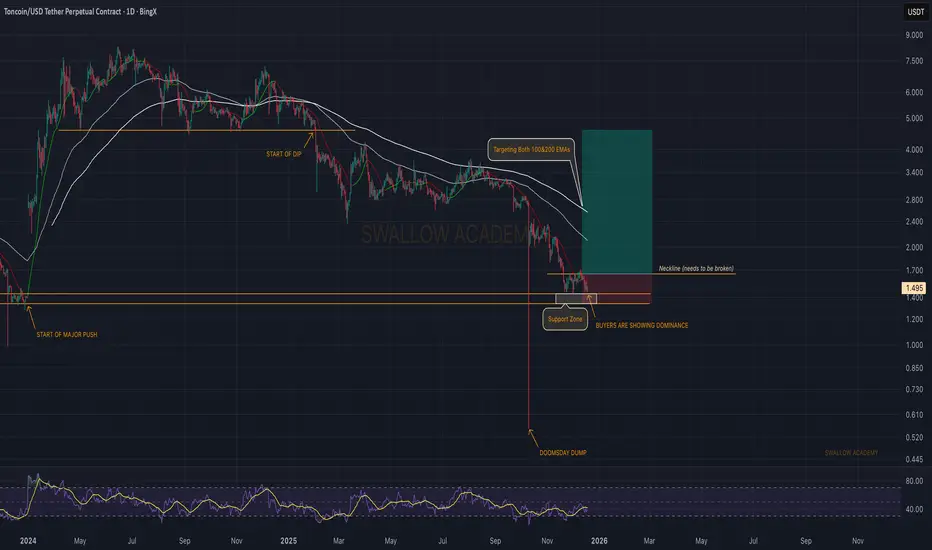
Toncoin (TON): Getting Into Early Long Here | Bullish SetupTON is trying to build a local bottom after that sharp flush, and buyers are starting to show interest around this support zone again. This is the same region where the last major push began, so it naturally attracts reaction.
For the long idea to play out, buyers need to push price back toward the 100 and 200 EMAs and reclaim them. That would be the first real sign that momentum is shifting. Until then, EMAs remain the main target and the first hurdle.
If buyers manage to take control here, the structure allows a steady climb back into the upper zones where the bigger move could start forming.
Swallow Academy
Market insights
Lingrid | TONUSDT Potential Long During Consolidation PhaseOKX:TONUSDT continues to trade within a consolidating structure, but it's printing a sequence of higher lows while holding above the $1.60 base. The recent pullback found demand near this support region, where buyers stepped back in and defended trend support. Price action suggests the latest dip could be corrective rather than the start of a reversal.
If momentum rebuilds above the mid-range and holds above channel support, price may attempt another drive toward the 1.70 resistance zone, where prior highs and sell-side liquidity sit. That area could act as a magnet if buyers maintain control and volatility expands to the upside.
➡️ Primary scenario: hold above 1.60 → continuation toward 1.70.
⚠️ Risk scenario: sustained acceptance below 1.60 may weaken the structure and expose a deeper pullback toward 1.55.
If this idea resonates with you or you have your own opinion, traders, hit the comments. I’m excited to read your thoughts!

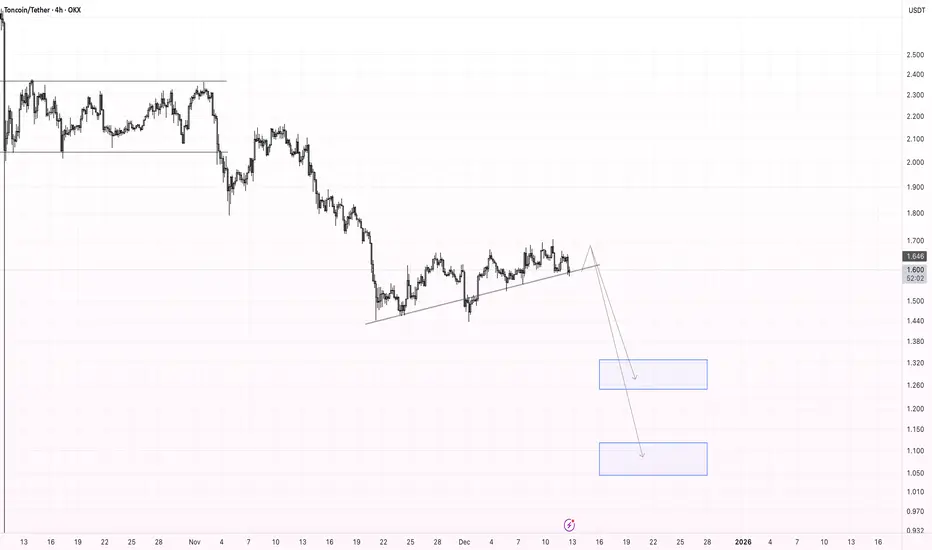
TON Correction Scenario: $1.33 → $1.10 TargetsPrice is breaking below the local ascending trendline, signalling a potential shift in short-term momentum. If the breakdown holds, I expect a continuation to the downside toward the next support zones. My targets are $1.33 as the first demand area and $1.10 as the secondary, deeper target.
TON Sits at a Critical Turning PointTON continues to trade inside a broad descending structure, but price is now pressing against a key trendline that has rejected every rally for weeks. This compression is creating a decision point.
A zone of demand has formed just beneath price, aligning with the mid-range of the falling wedge. This region has acted as support multiple times, showing that buyers are still defending. At the same time, the upper trendline is steadily guiding price lower and compressing volatility.
If the market holds above this support range and reclaims the short term structure, the next wave of expansion can begin. A clean breakout above the descending trendline would open the path toward the previous imbalance levels and the higher value zones above.
However, a failure to maintain this support may trigger one more downward leg into the lower boundary of the channel before any renewed attempt at recovery.
TON is entering a phase where price will reveal the next directional move. Patience is important as the structure prepares for expansion.

TON - Long idea.The TON looks pretty long. The structure is good. I expect another test near the local low. Ideally, we should break through the low and rise!
I've sketched out a rough plan and set up alerts. I'll be watching!
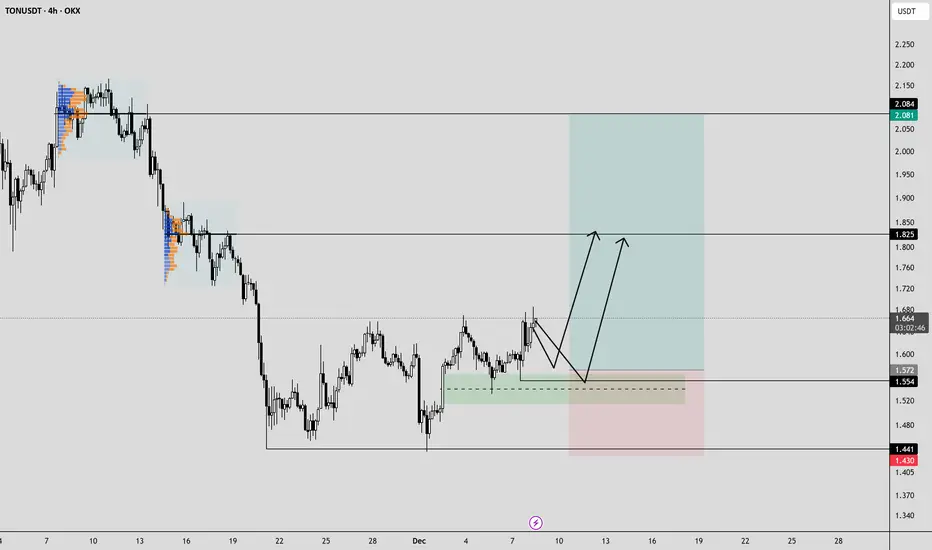
Lingrid | TONUSDT Support Zone Retest Buy OpportunityOKX:TONUSDT perfectly played out my previous trading idea . Price is hovering just above the reclaimed downward trendline after breaking out of the prolonged consolidation block. Price is now pulling back toward the 1.50 psychological level, where the retest aligns with both structure support and the underside of previous compression. This creates a constructive setup for buyers as long as the market continues to defend this reclaimed territory.
If price stabilizes above 1.50, upside room opens toward 1.80 where the descending channel ceiling meets key resistance. Momentum remains neutral but primed for expansion should buyers maintain control near the retest area.
➡️ Primary scenario: stabilization at 1.50 → continuation toward 1.80.
⚠️ Risk scenario: a breakdown below 1.50 exposes 1.30 and shifts bias back to the broader downtrend.
If this idea resonates with you or you have your own opinion, traders, hit the comments. I’m excited to read your thoughts!

Ton Buy SetupThis weekend was very Volatile that all of short term position liquated & Shaked out. but my opinion about bullish price didn't change. My target for Ton for next days 2.2 and 2.5 . then let see what will happen.

TONUSDT : Bearish Breakdown with Mini Retest PotentialTONUSDT 30-Minute Chart Analysis: Bearish Breakdown with Mini Retest Potential
The analysis hints at a bearish continuation after a volatile upswing, with annotations suggesting a "Pattern Must" (possibly "must fail" or "must hold") and a "Mini Retesting" zone where price might stabilize before deciding direction. I'll expand on this below in a TradingView Idea-style format, adding more depth with historical context, pattern implications, and broader market ties for TON in late 2025.
Chart Overview
The x-axis displays time in 6-hour increments from 06:00 on December 6 onward, covering intraday swings into December 7 and projections to December 9. The y-axis scales prices from about 1.545 to 1.625 USDT, with the ask price marked at 1.577 (red) and bid at 1.576 (blue? – appears as "Ask 1.577 Bid 1.576").
Candlestick Sequence: Starting left, there's a bearish drop with red candles, followed by a sharp bullish rally (green candles climbing to ~1.615 around December 6, 18:00). This peaks and reverses with a cluster of red candles, forming a top around December 7, 06:00. Post-peak, price consolidates with smaller mixed candles, then drops sharply near the center, labeled "Pattern Must." The right side shows fading momentum, with a projection line sloping downward.
Trendline and Projections: A descending black trendline from the peak projects future downside, pointing toward lower levels by December 8–9. This acts as resistance, with price hugging it during the decline.
Key Annotations:
"Pattern Must": Labeled with an arrow at a sharp drop around 1.585, suggesting a critical pattern (e.g., head-and-shoulders or double top) that "must" play out bearishly. The word "Must" implies inevitability in the analyst's view, perhaps a must-fail bull trap.
"Mini Retesting" Zone: A green horizontal box around 1.565–1.570, with a circle dot, indicating a minor retest of support. This could be a brief pause where price checks former resistance-turned-support.
"Volume Burst": Below the retest zone, highlighting a potential surge in trading volume at lows, which might signal capitulation or accumulation.
Lightning Bolt Icon: At the bottom, similar to volatility warnings, possibly denoting a high-impact event like news (e.g., Telegram ecosystem updates affecting TON).
Horizontal red line at ~1.575 acts as a pivot.
Overall, the chart captures TON's typical crypto volatility, influenced by factors like Telegram integrations, NFT/adoption news, or broader market correlations with BTC/ETH in 2025.
Technical Analysis Breakdown
Expanding on the visuals with deeper indicators and context:
Trend and Momentum: The initial rally from ~1.550 (December 6) to 1.615 forms an impulsive wave, potentially Wave 3 in Elliott terms, followed by a corrective pullback. The descending trendline confirms lower highs, signaling bearish control. Momentum appears waning on the right, with smaller candle bodies – a sign of exhaustion.
Support/Resistance and Zones:
Resistance: Peak at 1.615 and the trendline (~1.590 declining). Breaking above could negate the bearish setup.
Support: "Mini Retesting" at 1.565, with "Volume Burst" implying buyer interest. Lower supports at 1.550 (chart low) or psychological 1.500.
Volume: 14.0B is substantial for TON, suggesting institutional interest; bursts at lows could indicate smart money entry.
Patterns and Signals:
Potential Head-and-Shoulders or Double Top: The "Pattern Must" points to a topping formation – left shoulder rally, head at 1.615, right shoulder weaker. Neckline break at ~1.585 triggers downside targets (project to 1.515, height subtracted).
Retest Dynamics: The "Mini Retesting" suggests a quick backtest of the breakdown level, common in ICT (Inner Circle Trader) concepts for liquidity grabs before continuation.
Projection Implications: The downward line forecasts a test of 1.545 by December 8, aligning with Fibonacci 61.8% retracement from the rally base.
Broader Context: In 2025, TON has seen growth from Telegram's 900M+ users, but faces competition from Solana/ETH. Recent dips might tie to regulatory news or market-wide corrections.
If indicators like RSI/MACD were overlaid (not shown), we'd likely see overbought at peaks (>70) and divergence at lows, supporting a reversal tease.
Trade Idea: Short Bias with Retest Entry
Leveraging the chart's bearish lean:
Bearish Setup (Primary): Short on failure of "Mini Retesting" (break below 1.565). Entry: 1.564. Stop Loss: Above trendline at 1.580 (risk ~1%). Take Profit: 1.545 (initial), then 1.520 (extension). R:R 1:2+. Rationale: "Pattern Must" implies continuation, amplified by volume bursts flushing weak hands.
Bullish Counter-Trade (Risky): If "Volume Burst" holds and price reclaims 1.575, long for a squeeze. Entry: Above 1.578. Stop Loss: Below 1.560. Take Profit: 1.600 (prior high). This bets on the retest as a fakeout bottom.
Position Sizing: Limit to 0.5-1% risk, use leverage cautiously (e.g., 5x on Binance). Watch correlations: TON often moves with BTC; if BTC dumps, amplify downside.
Always incorporate news – e.g., Telegram Wallet updates could spark reversals.
Key Insights and Mindsets for Traders
Drawing from TradingView wisdom and crypto trading psychology:
Mindset 1: Respect the Pattern: "Pattern Must" reminds us patterns aren't guarantees but probabilities. Backtest similar TON setups historically for edge.
Mindset 2: Volume Tells the Story: Don't ignore "Volume Burst" – it's where real moves start. In crypto, spikes often precede 20-50% swings; use it to confirm entries.
Mindset 3: Scale Timeframes: This 30-min view is tactical; zoom to 4H/Daily for confirmation. TON's 2025 uptrend (from ~$2 earlier? – check live) might make this a dip-buy opportunity.
Mindset 4: Event Awareness: The lightning bolt screams "catalyst watch." Monitor X/Telegram for TON news; volatility spikes on announcements.
Mindset 5: Risk First: In volatile assets like TON, preserve capital. Use the retest zones for defined stops, avoiding emotional FOMO.
This detailed breakdown positions the chart as a bearish alert with reversal caveats. For live updates, check TradingView or Binance directly. DYOR, and consider #TON #Crypto #TechnicalAnalysis for community input!

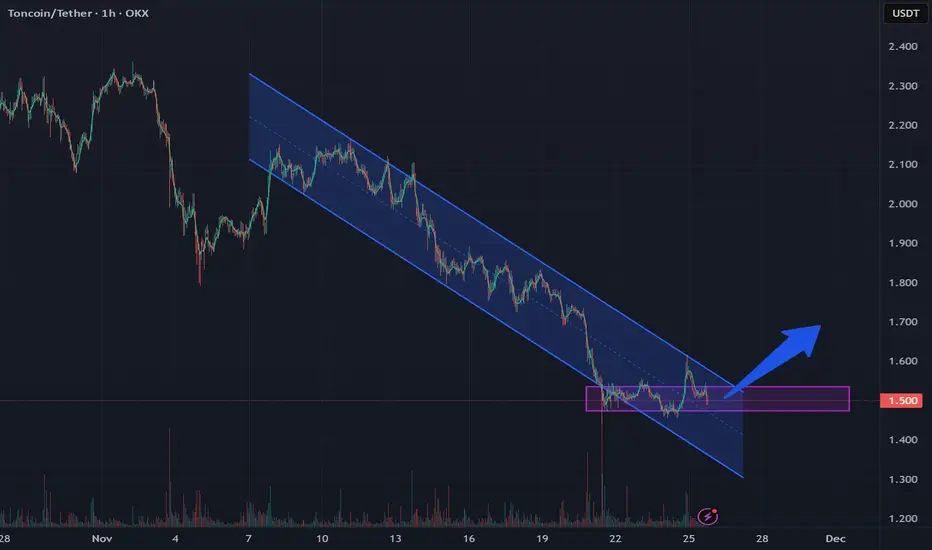
Toncoin (TON): Looking For Break of Neckline | Expecting UP MoveTON is holding the local support zone well and buyers are starting to show dominance again in this area. The reaction from this zone is clean so far, which keeps the bullish idea valid.
Game plan is simple here: we’re waiting for a break of the local neckline. If that neckline gets reclaimed and accepted, this opens the door for a solid upside move from here toward the higher targets.
Swallow Academy
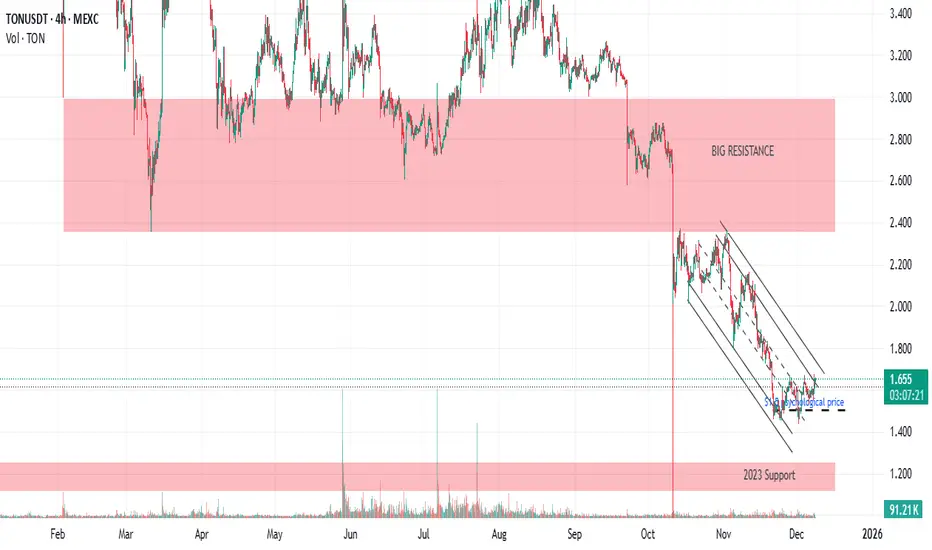
TONCOIN heads towards major resistance at $3After the decline that occurred on 10/10, MEXC:TONUSDT closed the wick candle with a very neat trendline.
Will it break the trendline and try to rise to $3 resistance?
$1.5 would be the psychological price
Toncoin (TON): Expecting a Good Push From Here | BullishTON is reacting from the same area where the previous big push started, which shows this zone still matters. After that heavy dump, buyers stepped in again and we’re getting the first signs of a potential shift.
Now we wait for a proper MSB to confirm the reversal. If we get it, TON has enough space for a solid recovery and a clean move back toward higher levels. As long as this zone holds, this could be the start of the next push.
Swallow Academy

TON : SELL LIMIT
Hello friends
considering the downtrend we are in, the power of sellers is quite clear and it is logical that we also move to the strong side, and in this downtrend, any price increase can be a selling opportunity.
So now, considering the buyers' support of the support area identified with Fibonacci, we need to see whether the sellers will enter again in the identified resistance area or not?
If the buyers weaken again in the resistance area, the price can fall to the specified targets.
This analysis is purely technically reviewed and is not a buy or sell recommendation, so do not act emotionally and observe risk and capital management.
*Trade safely with us*

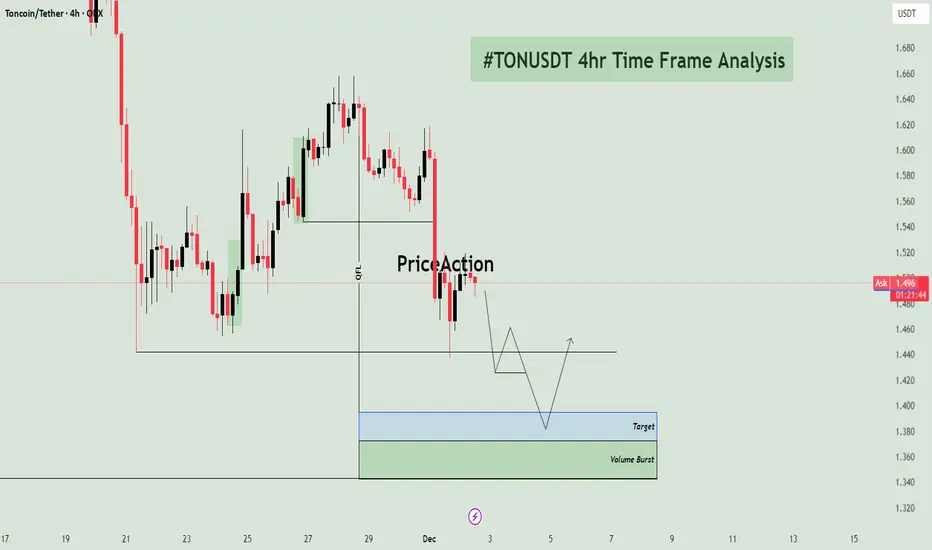
TONUSDT - Short Setup - Targeting Unmitigated Demand 📉 TON/USDT 4H: Anticipating Continuation Short Towards Unmitigated Demand
📝 Market Overview and Structural Context
The TON/USDT pair on the 4-hour chart is exhibiting a clear bearish structural shift. After a period of an attempt at a reversal (the recent small rally), the price has decisively broken below the most recent swing low, confirming that sellers are firmly in control.
The price is currently consolidating just below a key structural point and is expected to continue its descent toward a significant Demand Zone that was the origin of a previous move higher. The overall hypothesis is a short continuation trade, targeting this fresh demand zone.
🔑 Key Technical Zones and Order Flow
The analysis highlights the key structural break and the ultimate target zone:
1. Structural Break and Retest
Level: The swing low around 1.550 was recently breached.
Current Action: Price is now consolidating around the 1.480 - 1.500 area. The arrows on the chart suggest the expectation of a brief retest of the broken support level (around 1.460) before the bearish momentum continues.
2. Target and Volume Burst Zone (Demand) 🟢/🔵
Zone Location: This is the combined target area, spanning approximately 1.360 to 1.400.
Significance: This area is a high-quality Demand Zone, identified as the "Volume Burst" zone. This area was the origin of the last significant bullish momentum (likely a Drop-Base-Rally structure) that launched the previous swing high. It represents the first major unmitigated area where institutional buy orders are expected to be located.
The blue box, labeled "Target" (around 1.380 - 1.400), is the most immediate technical objective for the current short trade.
The lower green box, "Volume Burst" (around 1.360 - 1.380), marks the distal boundary of the demand zone, providing the ideal area for the final take-profit and potential reversal.
3. Order Flow Level (OFL)
Location: The price level around 1.560.
Significance: This marks the origin of the last structural high before the move down. The structural breakdown confirms the selling pressure from this point.
📊 Trading Hypothesis: Short Continuation
The trade plan anticipates a short continuation after a minor retest:
Trade Direction: Short (Sell)
Entry Strategy: The chart suggests waiting for a minor rally back toward the broken support level (around 1.460) to capture a more favorable entry price, minimizing risk. The short trade is initiated upon the rejection of this broken level.
Stop Loss (S/L): The Stop Loss should be placed safely above the recent swing high that failed to break the prior structure (e.g., above 1.560 or the most recent significant high).
Take Profit (T/P) 1: The Target (blue box) around 1.380 - 1.400.
Take Profit (T/P) 2: The distal boundary of the Volume Burst zone around 1.360, which represents the maximum expected extension of the current move before a significant bounce occurs.
⚠️ Risk Management and Invalidation
The risk lies in price reversing prematurely before reaching the target or failing to reject the retest level.
Invalidation: A decisive move and close above the OFL level (1.560) would indicate renewed bullish momentum and invalidate the bearish structural thesis.
FireHoseReel | TON’s Last Support of Defense🔥 Welcome to FireHoseReel !
Let’s dive into the analysis of Telegram Coin (TON).
👀 TONUSDT 4H Overview
TON has reached a very critical support zone. A clean break below this level could activate our next short trigger and lead to a deeper drop than many expect.
📊 Volume Analysis
Selling pressure during the formation of this support has been significant. With heavy market FOMO, many traders have already exited their TON positions. If this downside momentum continues, TON could enter a deeper corrective phase.
🔁 TONBTC Prespective
Meanwhile, the TON/BTC pair is also in a bearish structure, indicating that TON’s relative strength against Bitcoin is weakening.
📌 Trading Scenario
At the moment, TON presents one primary scenario, focused on the short side, which you can use alongside your own trading setup.
🔴 Short Scenario
A breakdown below the current support at $1.465, confirmed by a strong increase in sell volume, could trigger a sharp decline in TON.
❤️ Risk Management & Emotional Discipline
Crypto trading is highly risky. Without proper risk management and emotional control, trading is no different from gambling.
Logic must always come before emotions. Learn to manage your trades—and enjoy the process of trading with control and discipline.

TON, Strong Weekly Support and Potential Recovery SetupTON is currently sitting on a strong multi month support zone around 1.40, a level where price has reacted several times in the past.
From this zone, TON has potential to start a steady recovery toward the next key levels, first near 2.50 then 3.00 and possibly 3.50.
This is a spot setup based on the weekly structure, showing a possible mid term reversal if the support continues to hold.
#TON #TONUSDT #CryptoTA #MarketStructure #SupportZone #PriceAction #CryptoTrading #ReversalZone
Long trade 🟩 1. Trade Details
Pair: TONUSDT
Type: Buyside Trade (Trade 2)
Date: Tue 25th Nov 2025
Time: 2:00 PM
Session: London → NY AM
Entry Timeframe: 15-min
Chart Timeframe: 1H
Entry: 1.5948
Stop Loss: 1.5533 (-3.81%)
Take Profit: 1.7833 (+11.84%)
Risk-to-Reward: RR = 14.49R
🟦 2. Higher-Timeframe Context (Blue Tab — HTF Narrative)
HTF Trend:
• The 4H & 1H structure shows the larger downtrend has completed its corrective leg.
• Price forms a multi-tap accumulation range with repeated liquidity sweeps under 1.5520 – 1.5600.
• A clear BOS on the 1H shifts narrative from bearish → bullish.
Key HTF Confluences:
Breaker block reclaimed (originated from the last sell-side displacement).
Discount pricing beneath the 0.618 retracement of the previous leg.
Daily Open reclaimed → bullish orderflow.
FVG cluster left behind during displacement, acting as fuel for a pro-trend continuation.
Directional bias: HTF buy-side targeting 1.70 → 1.74 liquidity.
1Hr TF
🟧 3. Liquidity Story
Liquidity events leading to the entry:
1️⃣ Sell-side liquidity swept
• Deep wick into 1.5520 level (multi-session equal lows).
• New York session provided the liquidity injection needed for expansion.
2️⃣ Inducement / engineered liquidity
• Double-bottom fakes & equal-low structures were purposefully created during Asia/London.
3️⃣ Displacement
• Strong impulsive displacement from 1.5580 → 1.6200
• Break of Structure confirms bullish orderflow.
4️⃣ Pullback into discount
• Price retraced into:
0.618 retracement
15-min FVG
1H FVG stack
Order block 1.5630–1.5690
This created the optimal trade entry.
5️⃣ Final Liquidity Target
• Buyside resting above 1.7300 → 1.7500
• TP aligns with prior swing-high inefficiency and breaker block.
🟪 5. Market Sentiment & Narrative
Session Flow:
• Asia created the range → engineered liquidity
• London manipulated → swept sell-side
• NY AM gave the displacement → bullish confirmation
Market Psychology:
Retail assumed trend continuation downwards due to prior bearish leg.
Smart money accumulated aggressively in discount during multi-session compression.
🟫 6. Outcome
Trade Status: ACTIVE (Price mid-leg expansion)
Current Position: in +6.3% unrealised PnL at time
Market Structure: intact bullish MS
Invalidation: Break & close below 1.5600

Toncoin (TON/USDT): Trendline Break & Double BottomHi!
TON has formed a double-bottom reversal pattern after a sharp decline, signaling early bullish momentum. Price has also broken the minor descending trendline, confirming a short-term shift in structure.
Key Levels
Immediate Resistance: $1.63–$1.68 (first supply zone)
Major Resistance: $1.78–$1.82 (trendline + supply confluence)
Bullish Scenario
A sustained move above $1.63–$1.68 opens the path toward $1.78–$1.82, where the main descending trendline is located. A breakout there would confirm a stronger trend reversal.
Bearish Scenario
Failure to hold above the breakout zone may lead to a retest of $1.50–$1.52, the neckline of the double bottom.

Ton coin on a BULL movetake this set up as the downtrend strated converting , the created higher high and the continuation of the bullish trend is a strong buy call

Lingrid | TONUSDT Retracement Short OpportunityOKX:TONUSDT is climbing into the 1.700 resistance zone, where the downward trendline and the previous-week low (PWL) converge — a classic confluence that often produces bearish reactions. Price is recovering from the lower-low at 1.450, but the structure remains decisively bearish as the pair continues to trade inside a well-defined downward channel. The current pullback shows slowing momentum, suggesting buyers may be running out of steam as the market nears supply.
If price rejects the 1.700 zone, downside pressure is likely to resume with the target at 1.500, where the buying area aligns with the channel floor. Bears maintain structural advantage as long as price stays beneath the trendline and fails to close above 1.700.
➡️ Primary scenario: rejection from 1.700 → drop toward 1.500.
⚠️ Risk scenario: breakout above channel would signal a bullish shift and open room for a corrective rally.
If this idea resonates with you or you have your own opinion, traders, hit the comments. I’m excited to read your thoughts!

#TON/USDT (TON/USDT): Trendline Break & Double Bottom#TON
The price is moving within an ascending channel on the 1-hour timeframe and is adhering to it well. It is poised to break out strongly and retest the channel.
We have a downtrend line on the RSI indicator that is about to break and retest, which supports the upward move.
There is a key support zone in green at the price of 1.47, representing a strong support point.
We have a trend of consolidation above the 100-period moving average.
Entry price: 1.50
First target: 1.53
Second target: 1.58
Third target: 1.63
Don't forget a simple money management rule:
Place your stop-loss order below the support zone in green.
Once you reach the first target, save some money and then change your stop-loss order to an entry order.
For any questions, please leave a comment.
Thank you.

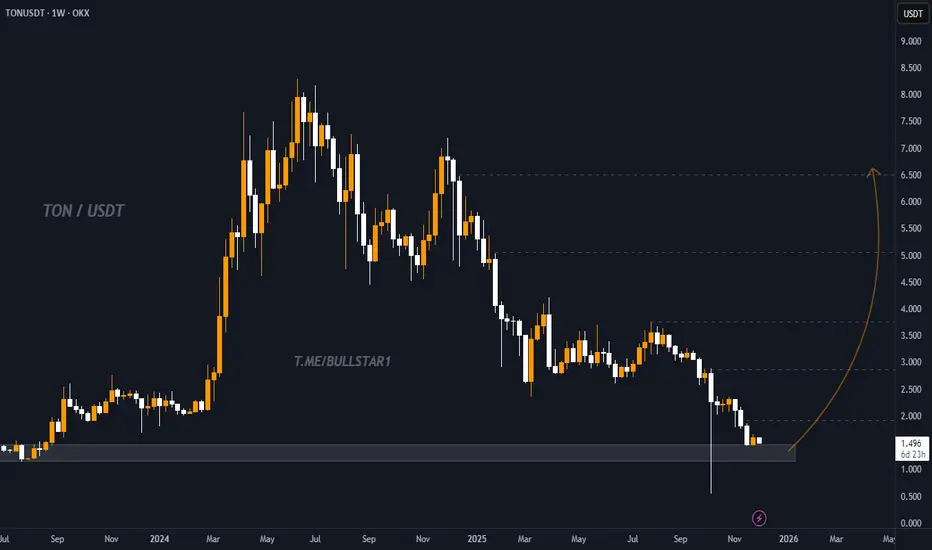
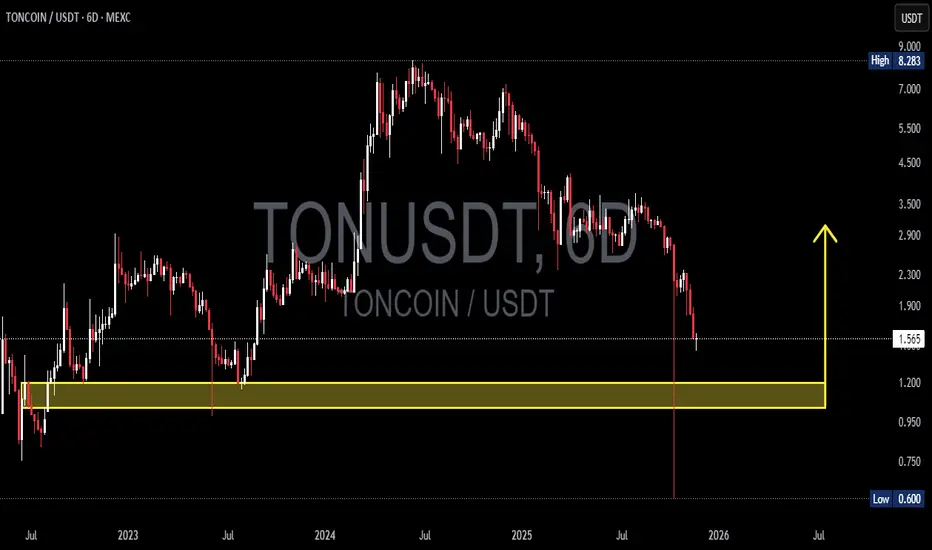
TON/USDT — Reversal Setup or Deeper Breakdown Ahead?On the 6D timeframe, TON has reached its most critical level since 2023. After forming a macro top near 8.28, the market shifted into a clean sequence of lower highs and lower lows, signaling sustained bearish control.
And now… price has landed directly inside the historical accumulation zone at 1.20 – 1.03 — a golden area that has repeatedly dictated long-term trend direction.
This isn’t just another support zone.
This is a psychological battleground, where major buyers stepped in previously and triggered multi-month rallies.
---
🔥 Why the 1.20 – 1.03 Zone Matters So Much
It has served as a macro pivot zone in previous cycles.
Every major uptrend in TON began with accumulation inside this area.
Holding this zone = potential multi-month bullish reversal.
Losing this zone = full transition into a macro bearish cycle.
TON is standing on the edge:
Either it rebounds explosively, or it breaks down toward levels not visited in years.
---
📈 Bullish Scenario — “Rebound from the Sacred Zone”
This scenario gains strength if:
1. Price prints a strong reversal inside 1.03–1.20 (pin bar / bullish engulfing).
2. A 6D candle closes back above 1.20 → confirms demand.
3. Breakout above 1.90–2.30 → confirms a macro trend shift.
If confirmed, upside targets are:
First target: 2.30
Expansion target: 3.50
Mid-cycle target: 5.00+
This could mark the beginning of TON’s next bullish cycle — but only with proper confirmation.
---
📉 Bearish Scenario — “Freefall Toward Extreme Lows”
Bearish continuation becomes likely if:
1. Price fails to hold the 1.03–1.20 support zone.
2. A 6D candle closes below 1.00 → macro support officially broken.
If breakdown confirms, downside targets become:
0.80
And potentially a retest of 0.60 (the previous flash-low wick).
A clean break below the yellow zone signals the end of TON’s multi-year bullish structure and opens the door for deeper corrective moves.
---
TON has entered the most decisive zone of the past two years.
The 1.03–1.20 range will determine whether TON launches a new bullish expansion…
or whether the market continues the strong downtrend toward 0.80–0.60.
The reaction inside this zone will dictate TON’s direction into 2026.
#TON #TONUSDT #CryptoTA #MarketStructure #SupportZone #PriceAction #CryptoTrading #ReversalZone
Long trade 📘 TONUSDT – Trade Journal Entry (2-Min Chart)
Tue 25th Nov 25 — 12:30 pm — London Session AM
Buyside Trade
🟦 TRADE SUMMARY
Pair: TONUSDT
Direction: Buyside
Date: Tue 25 Nov 25
Time: 12:30 pm
Session: LND Session AM
Timeframe: 2m
🟩 TRADE PARAMETERS
Entry: 1.5161
Take Profit: 1.5487 (+2.15%)
Stop Loss: 1.5089 (–0.47%)
Risk-to-Reward: 4.53 R
🟨 MARKET CONTEXT & STRUCTURE (Tab 3 — Yellow Transparent)
1. Higher-Timeframe Context
TONUSDT completed a macro retracement after a major rally to:
0.382 retracement @ 1.5530
0.618 retracement @ 1.5949 (pivot correction)
After the macro correction, price moved into accumulation inside a tight range along the 1.50–1.52 region.
2. Intraday Structure
The London AM session shows:
A sweep of internal sell-side liquidity at 1.5089
A BOS through 1.5205
A return to a discount FVG
A clean Order Block interaction at your entry zone
The structure turned decisively bullish, setting up continuation.
15min TF
🟪 LIQUIDITY
Sell-Side Liquidity Taken
Multiple low hunts at:
1.5097
1.5089
These acted as inducements prior to bullish displacement.
Buyside Liquidity Targets
Internal buyside pockets:
1.5348
1.5487
HTF buyside targets beyond TP:
1.5600
1.5740 (FVG unmitigated)
1.5949 (macro 0.618 retrace)
🟧 ICT MODEL BREAKDOWN
Model Used: SLL Sweep → BOS → FVG → OB Retest → Expansion
1. Inducement
Price swept the range low at 1.5089, completing the liquidity cycle.
2. Displacement
BOS occurred as price broke above 1.5205 with strong bullish displacement.
3. Entry Confluence
Entry at 1.5161 aligns with:
✔ Discount-side FVG
✔ Micro OB retest
✔ Unbalanced price inefficiency
✔ EMA supports (50 EMA crossing above 13 EMA on 2-min)
✔ Strong volume at displacement candle
🟫 WYCKOFF ALIGNMENT
Wyckoff Phase TONUSDT Price Behaviour
Phase A Preliminary Support at 1.5100
Phase B Multi-hour accumulation zone
Phase C Spring at 1.5089
Phase D SOS → LPS (entry)
Phase E Mark-up to 1.5487
We assume we are in Phase D
🟩 VOLUME & CONFIRMATION
Heavy sell volume absorbed at the lows (confirming spring)
Volume increased during BOS candle → institutional footprint
Declining retracement volume → bullish absorption
Strong breakout volume into premium → validates continuation
🟥 OUTLOOK / CONTINUATION
As long as price holds above 1.5160–1.5180 (post-break structure):
→ Expect continuation flow toward premium levels.
Upside Continuation Levels
1.5540 (2m FVG)
1.5600
1.5740 (HTF breaker)
1.5949 (macro pivot)
Invalidation
Break below 1.5089 negates bullish model.

TON forms a bullish flag pattern with a local liquidity zoneTON has formed a bullish flag pattern, and we've also reached the local liquidity zone we've collected
According to the pattern, an upward rebound is expected
Current price: $1.492
If the price falls below the zone of interest and consolidates below, the movement will continue in a downward corridor within the pattern